Last updated: December 19, 2025
Article
New Research: Images of Rapids Can Help Measure River Flow
A new technique uses critical flow theory to estimate river discharge from Google Earth images. The results accurately match on-the-ground measurements.
By Brooke Bauman, Carl Legleiter, and Christy Leonard
About this article

This article was originally published in the "In Brief" section of Park Science magazine, Volume 39, Number 2, Summer 2025 (August 29, 2025).
NPS / Mark Lellouch
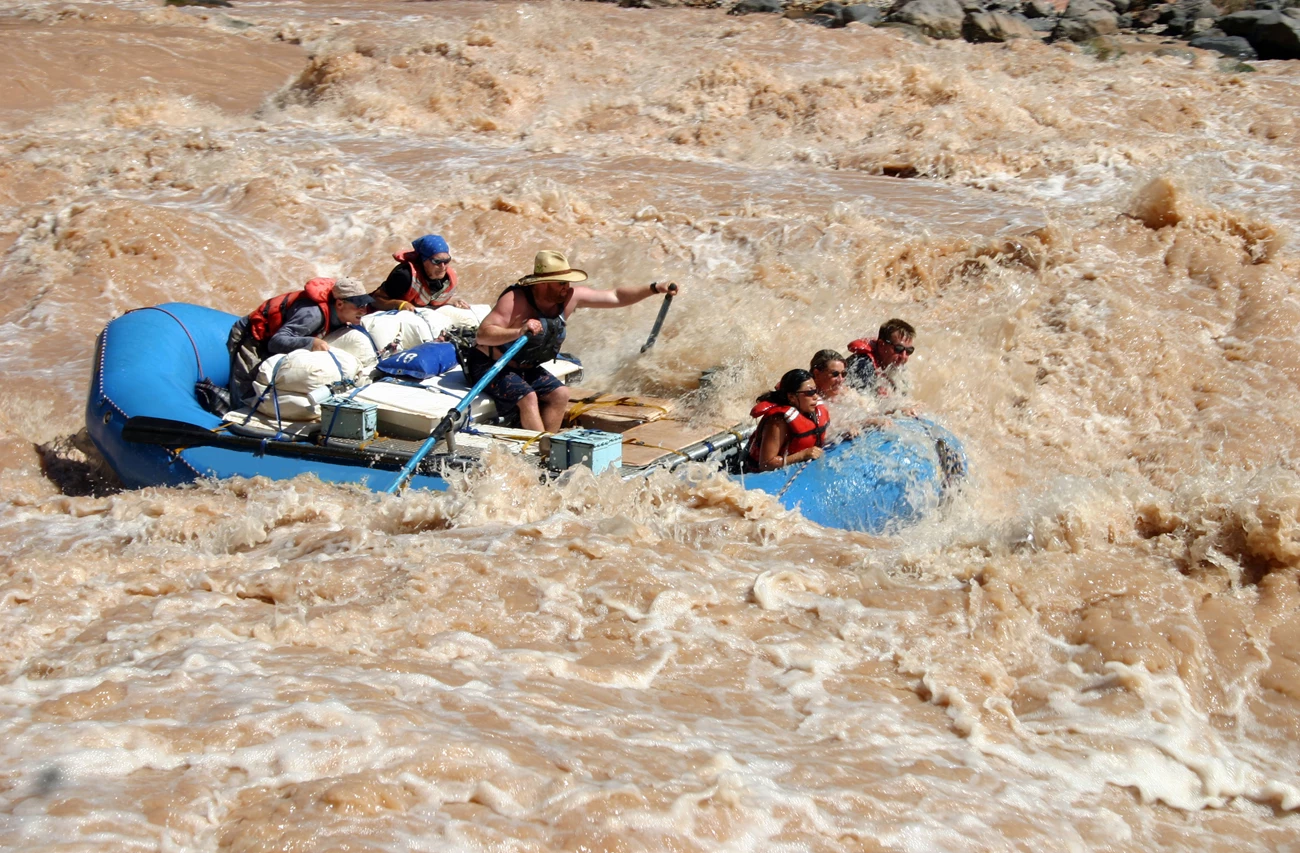
Imagine you’re on a whitewater rafting trip on the Colorado River. Your guide has been talking up a section of the river with some huge standing waves. As you approach it, you get ready, anxiously awaiting the thrill.
And off you go! Water splashes over the raft as you navigate the rapids, following the directions that the guide yells out.
“Forward two!”
“Forward three!”
“Lean in!”
Then suddenly, you’re through and into calmer waters. Smiles all around.
Turns out those rapids aren’t just for fun. They could help scientists figure out what’s going on in remote rivers, far away from towns and cities. That’s important because those rivers may be the source of your drinking water. They may sustain critical habitat that supports recreational fishing. Or they may cause problems for downstream communities when there’s too much rain or too little. Land management agencies like the National Park Service often need to know how much water is in a river, even if it’s far away or hard to get to.
Getting this information requires measuring river discharge. That’s the volume of water flowing in a river over a certain amount of time. But river discharge isn’t always easy to measure, especially for remote rivers that are difficult to access. This causes data gaps that could have real-world consequences during floods or drought. A study published in Geophysical Research Letters in May 2025 shows that Google Earth images of rapids may help scientists and resource managers measure discharge in some distant rivers without leaving the office.
Measuring River Discharge
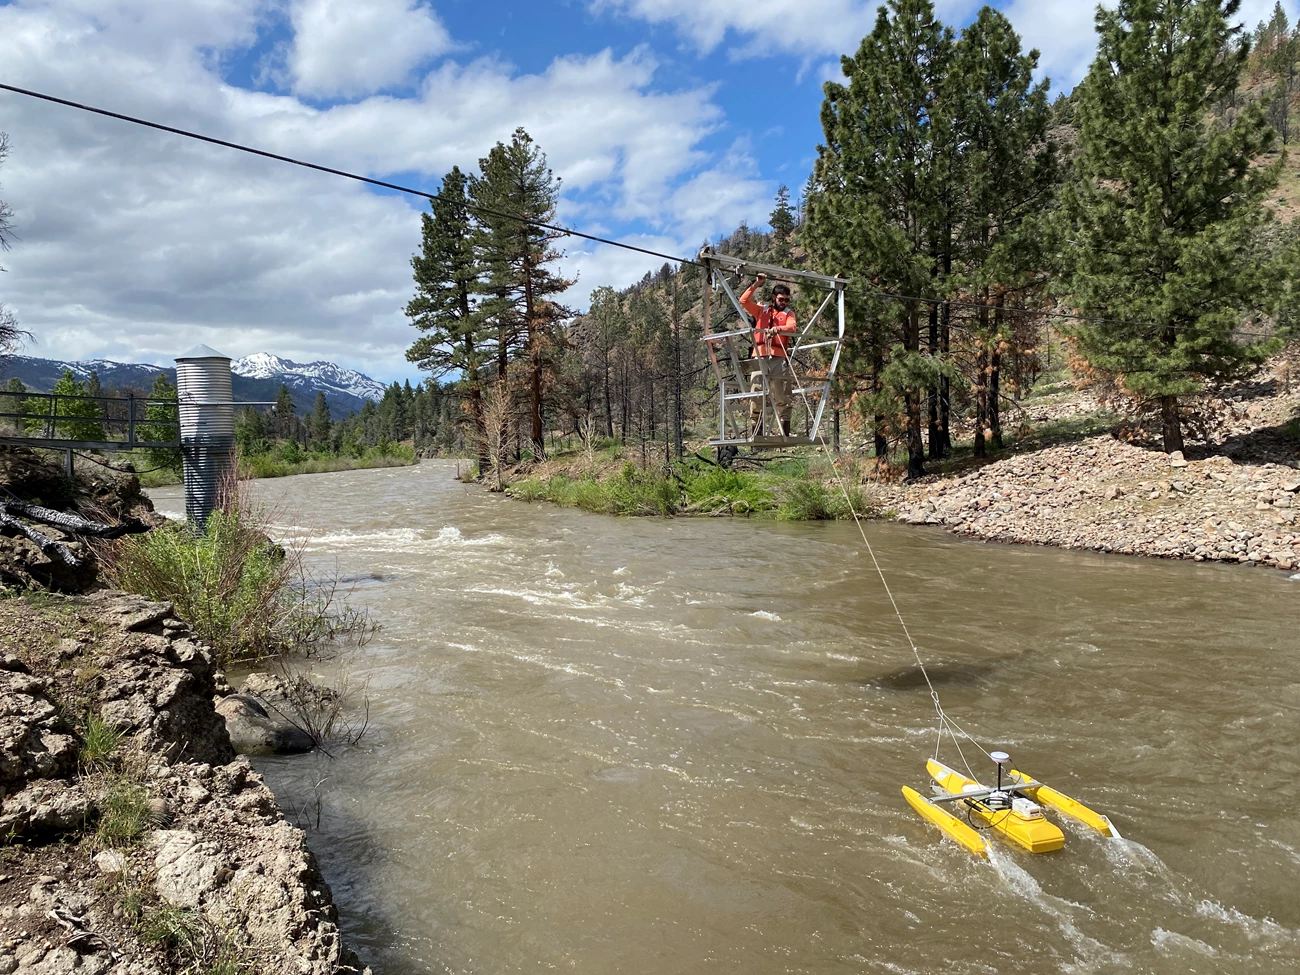
The standard way to measure river discharge is to establish gaging stations. These are locations along a river where a sensor measures changes in water level over time. Trained technicians will visit the stations to record flow depth and velocity at multiple positions across the channel. This requires a substantial investment in labor, time, and money and can be dangerous for people and equipment.
USGS
“In steep canyon rivers with roaring rapids, navigating by boat is often impossible,” said co-author Danny White, an assistant professor in the Department of Civil and Environmental Engineering at Colorado State University. ”Reaching the water’s edge to make measurements can require hauling heavy equipment long distances over loose, rocky slopes. Once there, swift currents and deep water make wading unsafe and can make it difficult to install flow gauges.”
"Swift currents and deep water make wading unsafe and can make it difficult to install flow gauges.”
Challenges like these have prompted river stewards to explore remote methods of measuring river discharge. Previously tested remote methods used satellite images and data from manned and unmanned aircraft. They proved best suited to relatively shallow, clear-flowing rivers. Optical images obtained by helicopter were effective for measuring flow velocities in sediment-laden rivers. But they often required extra steps for clearer waters.
Getting data through aircraft or satellites can also be expensive and unreliable. Images may be obscured by cloud cover or other weather effects. To overcome these challenges, the study authors devised a new technique. It uses measurements taken from Google Earth images, which are freely available and screened for cloud cover.
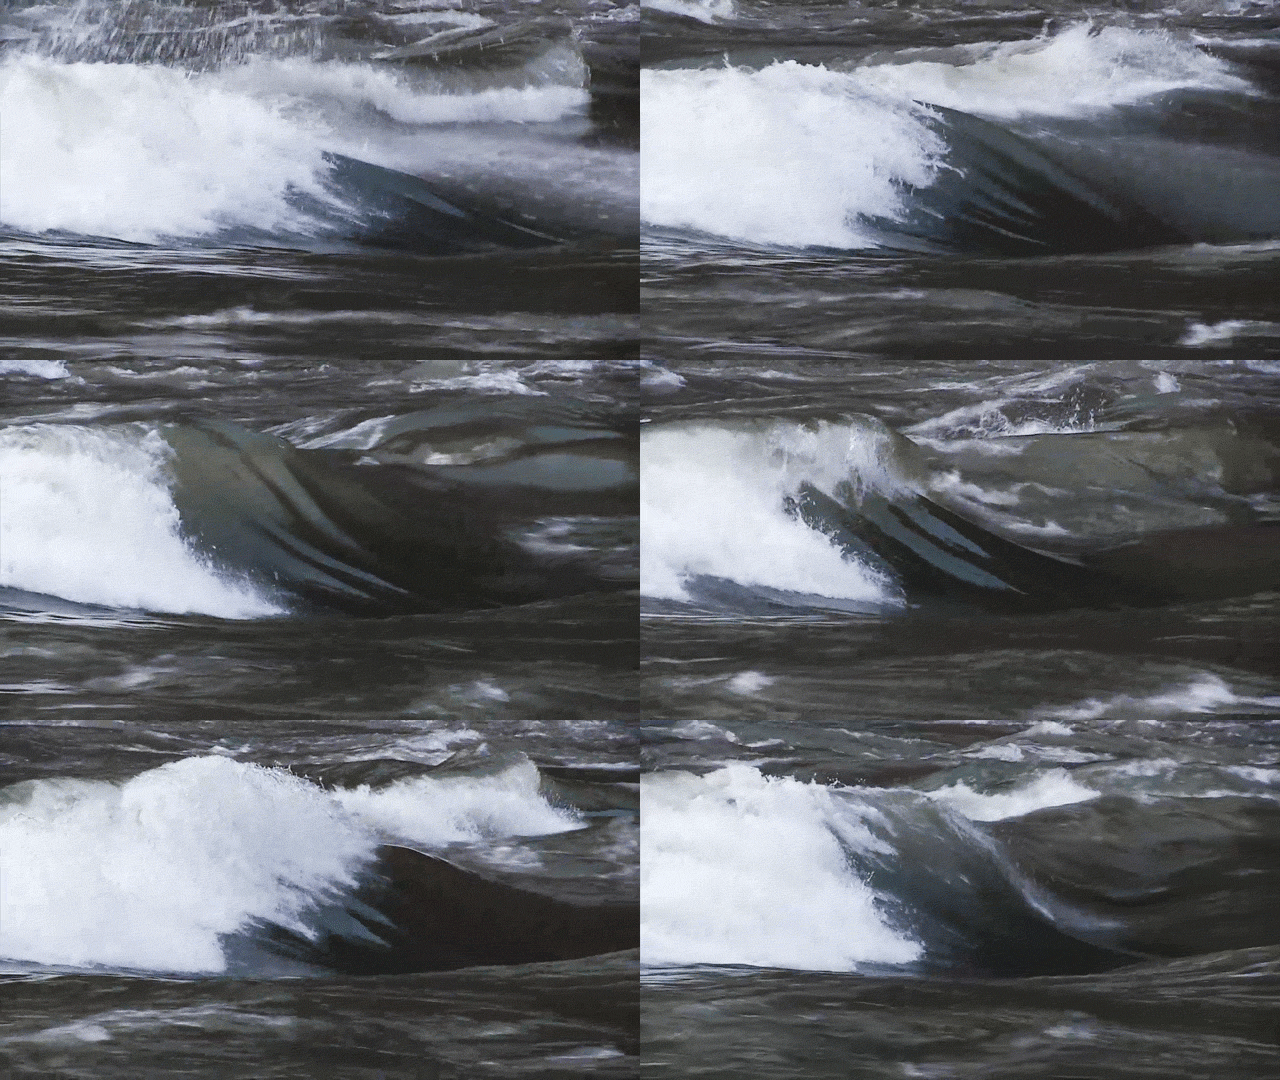
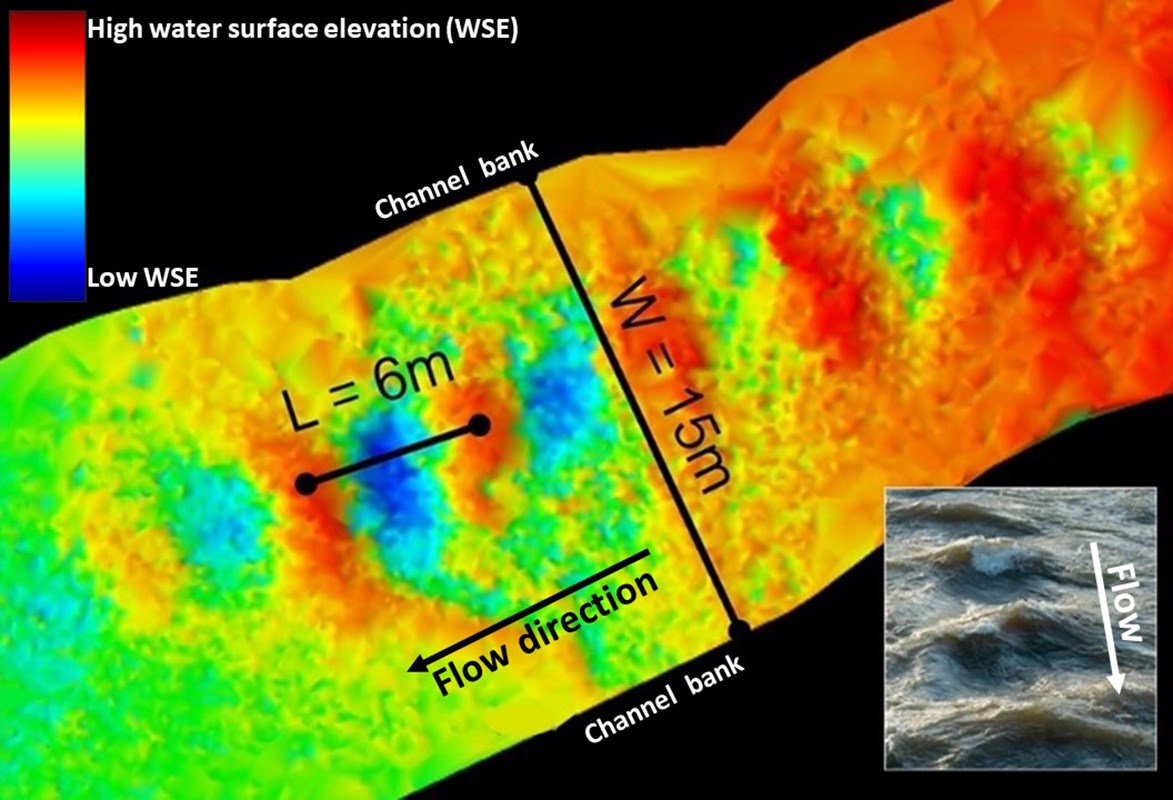
Rivers with relatively steep slopes or constricted channels typically have what scientists call “critical flow.” Under these conditions, the speed of a wave moving upstream is equal but opposite to the speed of the water flowing downstream. This makes the waves appear to stand still. Scientists call the resulting regularly spaced standing waves “undular hydraulic jumps” (UHJs). The whitewater rafting community calls them “wave trains.”
NPS / Nolan Wang
Legleiter and others. 2025. Remote Sensing of River Discharge Based on Critical Flow Theory. Geophysical Research Letters 52(9).
Based on critical flow theory, if a river has critical flow, you can calculate its discharge by measuring the wavelength of the UHJs and the width of the river channel. The researchers analyzed 82 Google Earth images of rivers with UHJs that met the conditions for critical flow. They measured the UHJ wavelength and width of the rivers in the images. Then they used those measurements to calculate river discharge. They found that river discharges derived from these images agreed closely with on-the-ground stream gage measurements.
Broader Applicability Than at First Glance
One limitation of this method is that the UHJs must be clearly visible in the images. This occurs most often in rivers on slopes greater than 0.01 (those that drop by more than a foot for every 100 feet along the channel). To assess the potential applicability of this method, the researchers evaluated a few river datasets. When they analyzed data from 8,453 active stream gages in the USGS National Water Information System, they found that 12 percent of the rivers had slopes greater than 0.01.
The average slope of the Colorado River through the Grand Canyon is as little as 0.0015. That’s 85 percent less steep than 0.01. But there are UHJs in steeper sections of the river.
The USGS National Hydrographic Dataset has measurements for over 2.6 million stream reaches (stream sections with similar conditions). The study authors found that over 40 percent of these had slopes greater than 0.01. Some rivers with overall slopes less than 0.01 may also have UHJs. The average slope of the Colorado River through the Grand Canyon is as little as 0.0015. That’s 85 percent less steep than 0.01. But there are UHJs in steeper sections of the river, where slopes are 0.02 to 0.03.
Cost Effective and Less Risky
Rivers where critical flow occurs often aren’t included in stream gage networks. The authors argue that this method could help fill those knowledge gaps. They also make the case that this method is cost effective and reduces risks to staff and equipment. It uses publicly available images and requires no additional data collection. The tools for measuring UHJ wavelength and channel width on Google Earth images can be found in free software. And it doesn’t require investing in special gear or traveling to remote locations. You can save that for your next epic whitewater rafting trip.
About the authors
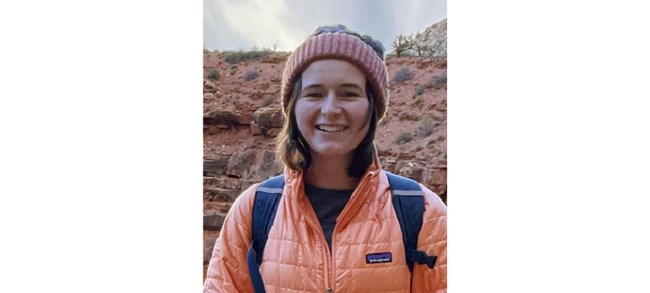
Brooke Bauman is a communications specialist with the National Park Service, Natural Resource Stewardship and Science, Water Resources Division. Photo courtesy of Brooke Bauman.
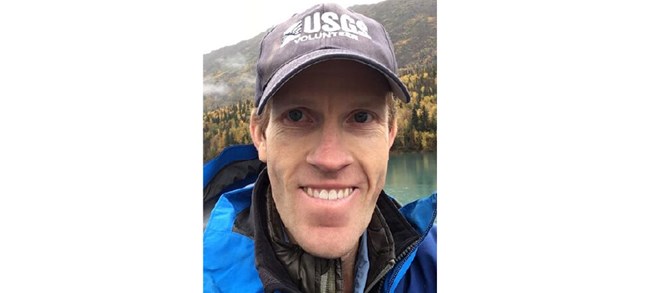
Carl Legleiter is a research hydrologist with the U.S. Geological Survey, Observing Systems Division. Photo courtesy of Carl Legleiter.
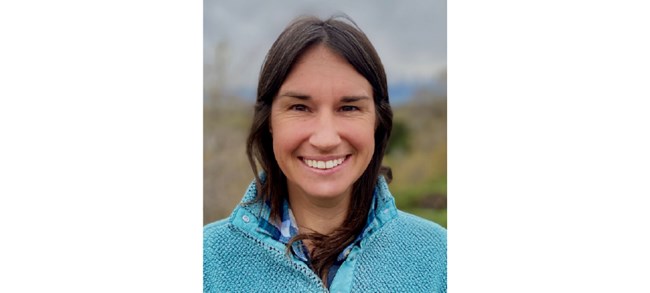
Christy Leonard is a hydrologist with the National Park Service, Natural Resource Stewardship and Science, Water Resources Division. Photo courtesy of Christy Leonard.
Cite this article
Bauman, Brooke, Carl Legleiter, and Christy Leonard. 2025. “New Research: Images of Rapids Can Help Measure River Flow.” Park Science 39 (2). August 29, 2025. https://www.nps.gov/articles/000/psv39n2_new-research-images-of-rapids-can-help-measure-river-flow.htm
