Last updated: September 16, 2025
Article
New Tool for Timely Reporting on Landscape Change

NPS/J. Joganic
It’s a classic line from a thousand movies. Something unusual appears, perhaps on radar, a computer monitor, or a camera, and the person whose job it is to monitor that screen turns to their supervisor and says something like, “uh, I think you should take a look at this.” It’s usually a turning point in the film.
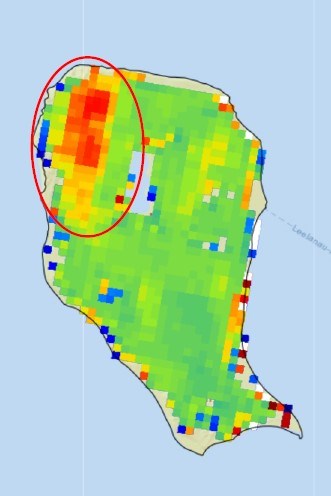
A similar situation happened when our program manager for landscape dynamics monitoring demonstrated a new tool to park managers and revealed the extent and severity of a forest blowdown event at Sleeping Bear Dunes. He did not utter that classic line, but he could have and the reaction would have been the same as in the movies. It could be a turning point in our monitoring program.
High Level Views
We began monitoring landscape dynamics in and around Great Lakes Network parks in 2010. We do this by using a composite collection of cloud-free satellite imagery acquired by Landsat satellites over a period of 40 years to identify disturbance events. Staff confirm if disturbances indicated by the computer analysis have actually occurred, then they summarize and report on landscape changes in and around a given park during that time period.
This type of monitoring allows us to analyze very large areas of land across the nine network parks—an average of 648,444 acres, with more than one million acres each at Isle Royale and Voyageurs—and to compare the data with historical trends. But the images used for analysis are collected during the summer and are composited into one cloud-free image for analysis, which means there is only one data point per year. There is also lag time, such that reports come out three years after the most recent disturbances have already occurred. This is a limitation of this type of time series analysis, but the long-term monitoring from the past 35 years is a very valuable dataset allowing a historical view of disturbance rates inside and outside parks.

NPS imagery
Time Is Not Always On Our Side
We realize park staff often need information about what’s happening in their parks in near-real-time. Such information is helpful for planning purposes and to grasp the magnitude of a situation. To this end, the network is investigating a monitoring approach to augment the long-term monitoring protocol, which would attempt to find changes on the landscape in near-real-time. This is made possible by a group of satellites known as Sentinel-2 that collect images at a finer resolution (an area as small as 10 square meters/108 square feet compared to Landsat’s 30 sq m/323 sq ft) and are available in a shorter time. This may allow us to analyze and report changes in near-real-time. This new capability became apparent during this summer’s demonstration for park managers.

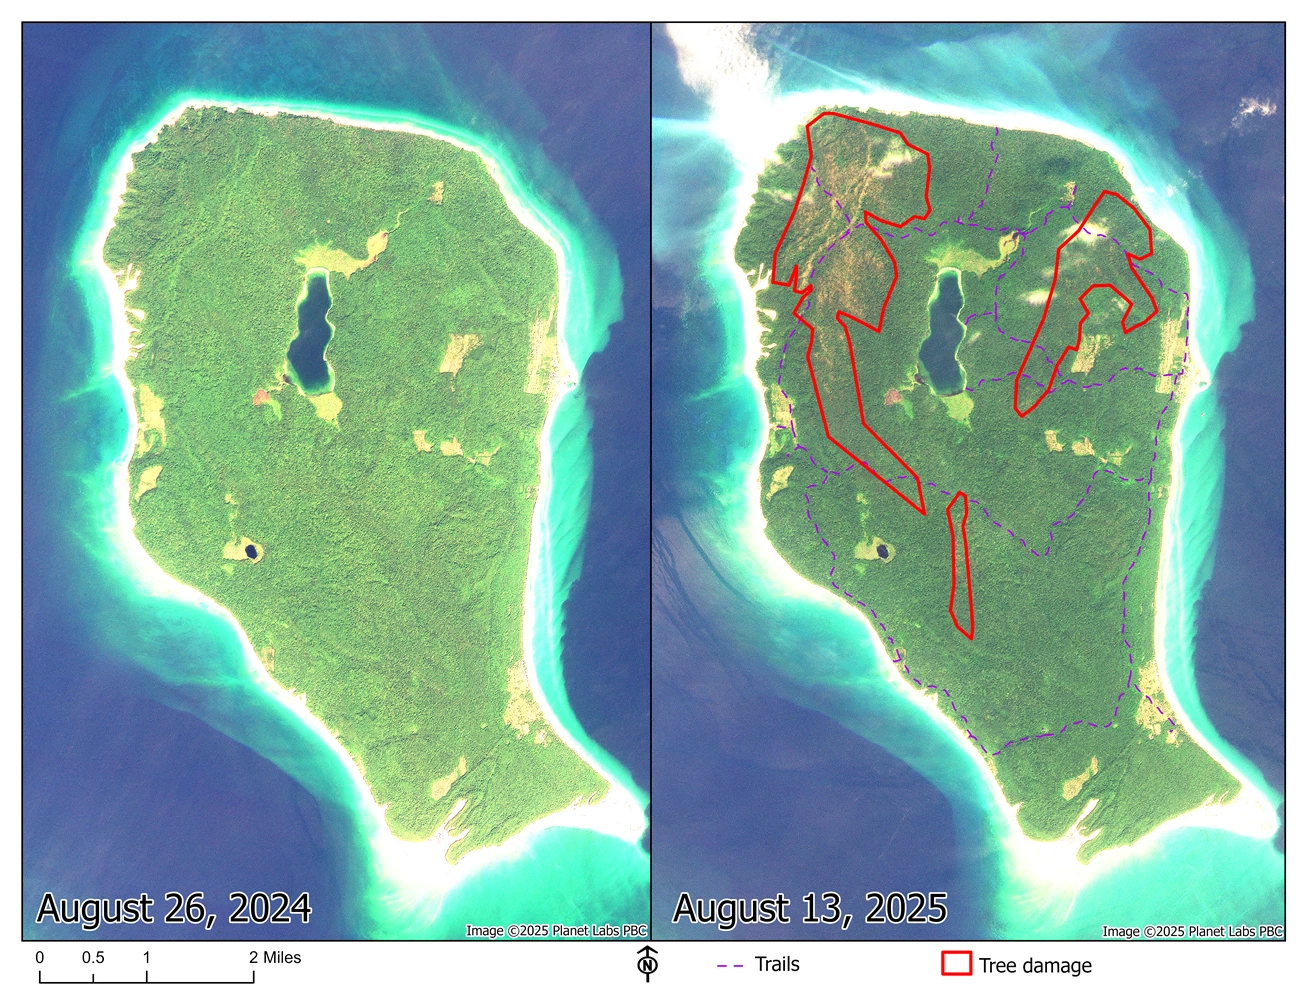
Base image provided by Planet Labs PBC
A New Tool Looks Promising
We do not know if the downed trees are the result of winds over Lake Michigan some time in the last year or the ice storms that gripped most of Michigan in late March of 2025. What we do know is that the availability of Sentinel-2 imagery less than one month after the photo was taken allowed us to identify, delineate, and share something we would have waited a year to see on Landsat imagery. Having this new tool available to our monitoring program means we can help parks in new ways.
