Last updated: March 13, 2024
Article
Let Me Count the Ways: How Citizen Scientists Helped a Park Measure Visitor Impacts
Wildly popular Rocky Mountain National Park wanted to assess the extent of resource damage from all that love. It needed the help of some ardent supporters.
By Paige Lambert, Scott Esser, Koren Nydick, and Varun Kirk Acharya

Image credit: NPS
National parks are sworn to protect and preserve meaningful natural and cultural settings. They’re also designed to allow people to enjoy those settings.
But achieving both can be a challenge, especially at highly visited parks like Rocky Mountain National Park. In the last decade, managers have watched the park’s annual visitation climb from about 3 million visitors in 2012 to 4.3 million in 2022, with peak visitation reaching nearly 4.7 million in 2019. This rapid growth puts a heavy strain on park resources and diminishes visitors’ experiences. To help understand the extent of the problem, park scientists developed a citizen science program to measure visitor impacts. The results were surprising and useful.
Human Waste, Informal Trails, and a Changed Landscape
Ninety-five percent of Rocky Mountain National Park is congressionally designated wilderness, preserved, in part, for its pristine natural qualities. Visitor impacts are of utmost concern here. As overall visitation has increased, so has the number of people in the park’s wilderness areas. Coming across used toilet paper and improperly buried human waste has become more and more common. Networks of informal “social” trails have appeared, made when hikers leave the main trail to seek new viewpoints, natural features, or a faster route. Bare ground has spread as people look for secluded places to eat their lunch or take in the scenery near lakeshores, waterfalls, and other points of interest.

Image credit: NPS / Rachel Williams
These impacts compromise human health and safety, come with a host of ecological concerns, and spoil the experience. Human waste contributes antibiotic-resistant bacteria and genes into soils and waters, even in remote areas. Human urine introduces hormones, pharmaceuticals, nutrients, and caffeine to sensitive bodies of water. Social trails can have lasting impacts on alpine vegetation, causing damage or complete loss. Social trails can also fragment wildlife habitat, harming the animals that use it. Areas of bare ground allow invasive plants to take hold and cause soil to erode into adjacent lakes, rivers, and streams, lowering water quality.
Large-Scale Needs Lead to Recruiting Volunteers
All of these effects highlighted the need for large-scale monitoring of visitor impacts throughout the park. This would help park staff make data-informed decisions on how to plan for and manage visitors. “Visitor impact data is key at all stages of the visitor use planning process,” explained John Hannon, who leads the park’s visitor use planning team. “During the initial stages, it helps you determine the size, scope, extent, and duration of impacts on the landscape.”
The scale of this project meant that employees couldn’t do it alone, so the park designed the monitoring protocol to include work by citizen scientists.
The scale of this project meant that employees couldn’t do it alone, so the park designed the monitoring protocol to include work by citizen scientists. This allowed the park to mobilize the expertise, time, and enthusiasm of members of the public to collect useable data. Monitoring visitor impacts also meant having conversations with community members about Leave No Trace practices and how visitor use management can protect park resources while maximizing access. People took these conversations back to their communities to share the importance of recreating responsibly.

Image credit: NPS
Piloting the Way
In 2020, the National Park Service’s Future Park Leaders (now Scientists in Parks) program funded a fellowship position to help develop and test a new method for collecting baseline data on visitor impacts. The intent was to focus on easily measurable impacts related to trail use. This pilot project would map impacts, document the number of trail users, and be easy enough for community members to learn and use without a professional background in science. It would record the location, number, and severity of impacts, and gather data to determine whether (and how) impacts were related to numbers of trail users.
Citizen scientists conducted five hour-long calibrations to ensure the equipment was estimating trail use numbers accurately.
Kirk Acharya, who received the fellowship, designed the new method, which can be shared and easily replicated at other parks. The method uses high-accuracy GPS units and hand-held electronic tablets loaded with GIS maps to collect data. Acharya and his team of citizen scientists recorded impacts such as human waste, trash, and illegal campfire rings as point data and categorized them by type. They mapped social trails as lines and congregation areas as polygons to capture their full spatial extent.
They classified the severity of social trails and congregation areas based on vegetation and soil impact using an adaptation of a previously published five-point scale. Automatic, infrared trail counters documented the timing and numbers of trail users in the survey area. This helped determine if there was a relationship between impacts and number of trail users. Citizen scientists conducted five hour-long calibrations to ensure the equipment was estimating trail use numbers accurately.

Image credit: NPS
Year 1: Surprising but Enlightening Results
The pilot year of data collection took place in 2020. That year, a small, dedicated group of citizen scientists volunteered for data collection. Connie, a long-time volunteer with the park’s Volunteers-in-Parks program, was part of the inaugural citizen science team. “I was experiencing firsthand the impact that increasing amounts of people were having on wildlife and the environment,” she explained. “When I learned about the [pilot] project, I was excited to be able to contribute."

Image credit: NPS
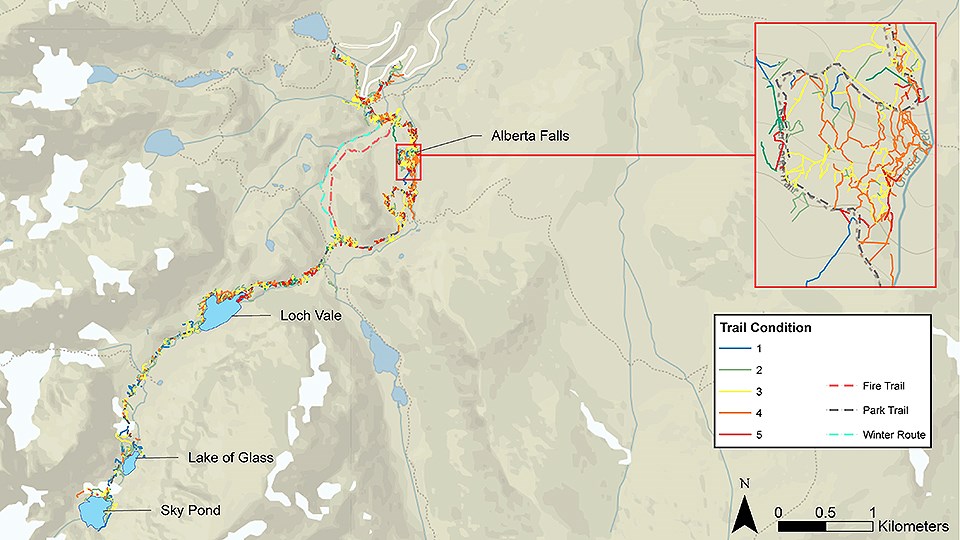
The team collected data along a heavily used trail corridor in Glacier Gorge, a popular wilderness area. In July, an estimated 45,000 visitors entered the trail corridor, and roughly 7,000 traveled to the alpine lake where the trail ends. During the pilot year, citizen scientists and park staff worked together to map 301 occurrences of exposed or improperly buried human waste. They mapped a total of about 19 miles of social trails, nearly twice the total for official trails in the study area.
The average condition for these social trails was Class 3 according to the five-point scale, which meant they mostly lacked ground vegetation but had some surface organic matter like leaves and twigs. Participants also identified over 20,000 square feet of visitor-created congregation areas. These had an average condition of Class 4, with no vegetation cover, widespread bare mineral soil, and exposed tree roots. “I was alarmed at the amount of human waste and trash left everywhere,” Connie said, reflecting upon that first year. “I also was surprised at the amount and length of social trails and how easy it is for them to become established.”
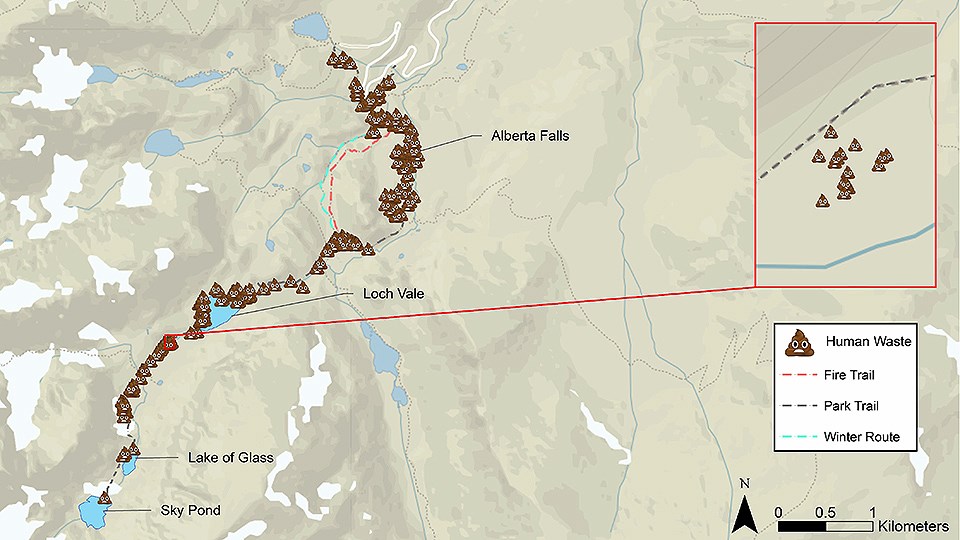
Left image
A map of improperly buried human waste documented in the Glacier Gorge trail corridor in 2020. Slide the arrows all the way to the right or left to see the full maps.
Credit: NPS
Right image
A map of all informal, visitor-created trails in the Glacier Gorge trail corridor in 2020. Each numbered color represents trail condition, with 1 (blue) for the least damaged and 5 (red) for the most damaged.
Credit: NPS
Years 2-3: Testing Across Park Settings
After a successful first year of data collection, it was important to test this method in a variety of settings across the park. In the first year—the pilot year—the park had tested the method in a heavily used wilderness trail corridor with dense forests and limited infrastructure like toilets and trash receptacles. In the second year, 2021, it tested the method along a less used wilderness trail in Wild Basin, where an estimated 30,000 visitors entered the trail corridor in July. This setting has a forested ecosystem with limited infrastructure. The third year, 2022, the park tested the method along a paved roadway in the alpine tundra, a fragile ecosystem without trees. Many trails along this road are short and paved. Visitor services, toilets, and other infrastructure are more readily available along this scenic route.

Image credit: NPS
The park successfully documented visitor impacts at each site. In total, citizen scientists and park staff documented more than 400 points of human waste, 30 miles of social trails, and 82,000 square feet of congregation areas across all three study locations. This showed that the methodology worked across different park settings. We found each type of visitor impact in all three study locations. But the amount and severity of each impact type varied across sites. This is likely a reflection of the different types of visitation, infrastructure, recreation, trail length, and ecosystems at each site.
We found fewer human waste points on the tundra compared to the two wilderness trail study sites.
For example, we found fewer human waste points on the tundra compared to the two wilderness trail study sites. This may be because infrastructure is more available to visitors taking short hikes and driving the paved road through the tundra. By contrast, in the wilderness trail study sites, backcountry toilets are limited. Or it may be because the openness of the tundra, which has no trees, does not allow for privacy. Social trails on the fragile alpine tundra had more severe vegetation impacts than the two wilderness trail study sites. This is likely due to the vulnerability of this landscape, where sensitive plants can take hundreds of years to heal. The differences between these settings illustrates the need for diverse management actions to address visitor impacts. These actions will need to be multi-faceted to address visitation levels, behavior, Leave No Trace education, and proper recreation etiquette to meet management goals.
| What We Measured | Locations | ||
|---|---|---|---|
| Highly Used Wilderness Trail (2020) | Less Used Wilderness Trail (2021) | Alpine Tundra Paved Road (2022) | |
| Number of human waste points | 301 | 110 | 18 |
| Length of official trail (miles) | 8.4 | 7.9 | 7.5 |
| Total length of informal trails (miles) | 19 | 4.5 | 9.9 |
| Average informal trail condition (1-5) | 3.15 | 3.06 | 3.08 |
| Standard deviation | 1.09 | 0.96 | 1.19 |
| Number of congregation area polygons | 86 | 159 | 44 |
| Average area of congregation polygons (square feet) | 358 | 129 | 958 |
| Average congregation area condition (1-5) | 4.1 | 3.74 | 3.65 |
| Standard deviation | 1.08 | 0.80 | 0.86 |
An Important Dataset with Many Applications
The goal of this project was to document visitor impacts and site-specific visitor use levels. But the data collected continue to be useful. University partners conducting research in the park have used these data in their work. The studies on human waste, human urine, vegetation loss, and habitat fragmentation mentioned earlier are a few examples. These data also play an important part in managing Rocky Mountain National Park’s visitation and facilities. The park has used trail counter data to inform its pilot timed-entry permit system, trail maintenance, and funding requests.
The maps cause strong reactions from people, who are amazed at “the amount of waste that is along our trails” and concerned “about the impacts on water quality.”
These data also provide another way for park managers to engage and educate members of the public on visitation-related impacts. Maps of human waste points vividly demonstrate the urgency of reducing visitor impacts in wilderness. Visitor use planning lead John Hannon said the human waste maps have been “one of the most impactful” during public presentations on the park’s long-range visitor use plan. The maps cause strong reactions from people, who are amazed at “the amount of waste that is along our trails” and concerned “about the impacts on water quality.” Hannon thinks the maps are “a valuable tool in communicating the visitation impact” because “they have a direct and immediate connection and impact on the viewer.”
Hannon added that the data have been “helpful in determining desired conditions, zoning, and…many aspects” of the park’s long-range plan. He said the dataset will allow park planners “to track the success of the plan and make appropriate changes and tweaks to meet [its] overall goals.” He also said, “While all stages of the data are important, long-term monitoring is the key element that makes our final plan successful.”
Far-Reaching Benefits
Rocky Mountain National Park monitors visitor impacts with the help of well-trained citizen scientists. The data they collect are invaluable for making good research and management decisions. Engaging citizen scientists in collecting data encourages stewardship. And it gives park visitors and community members opportunities to work with parks to further mutual science, research, and management goals. So far, 24 citizen scientists have participated in data collection and discussions around visitor use monitoring and management. In total, these citizen scientists contributed nearly 500 volunteer hours.
Rocky Mountain National Park’s visitor impact monitoring program is a model that other park units can use. With it, they too can develop a teachable and rigorous monitoring protocol, with far-reaching benefits. Parks interested in implementing their own program are encouraged to contact the authors.
About the authors

Paige Lambert is the science communicator at the Continental Divide Research Learning Center in Rocky Mountain National Park. Image credit: NPS

Scott Esser is the director of the Continental Divide Research Learning Center in Rocky Mountain National Park. Image credit: NPS

Koren Nydick is the Resource Stewardship Division manager at Rocky Mountain National Park. Image credit: NPS

Varun Kirk Acharya is the plant biologist at Sleeping Bear Dunes National Lakeshore. Image credit: NPS
Tags
- rocky mountain national park
- park science magazine
- park science journal
- ps v37 n1
- features
- wilderness
- recreation
- visitors
- human waste
- social trails
- leave no trace
- citizen science
- paige lambert
- scott esser
- koren nydick
- varun kirk acharya
- women in science
- stories by women authors
- stories by women scientists