Last updated: January 3, 2023
Article
Helping Islands Stay on a “Budget”
National island parks in the Gulf of Mexico are hemorrhaging sand at an increasing rate. Here's how we slow the bleeding.

Image credit: NPS / Jeff Bracewell
From a moored sailboat, a Jimmy Buffett tune carries across the Gulf of Mexico on a gentle sea breeze. Shorebirds are playing tag with the lapping waters, picking up tiny, shelled animals.
Everything seems idyllic on this day on the Emerald Coast of Florida. As I walk over the shells and fragments (the “wrack” line) left behind on the beach by the previous high tide, I take measurements to map the shoreline. This will help Gulf Islands National Seashore understand and mitigate the impacts of rising sea levels and increasingly destructive storms on its beaches and coastlines. Here on the front lines of some of climate change’s worst global impacts, the information I’m collecting is crucial to preserving this beach and its native animals and plants.

Image credit: NPS / Philip Iverson, Scientist in Parks intern, Gulf Islands National Seashore
Islands on a Budget
The sandy deposits that create beaches and dunes—the physical structure for terrestrial life at the seashore—depend on a sediment “budget.” Just as money flows in and out of a checking account, sand comes and goes in coastal landscapes, following dominant currents flowing along the shore, changes in water level, or prevailing winds. These forces cause the islands of Gulf Islands National Seashore to continuously shift north and west. Wind and water take sand from the south side of the islands and deposit it on the north, and currents move sand from east to west. Since their inception, the islands have always been on the move.
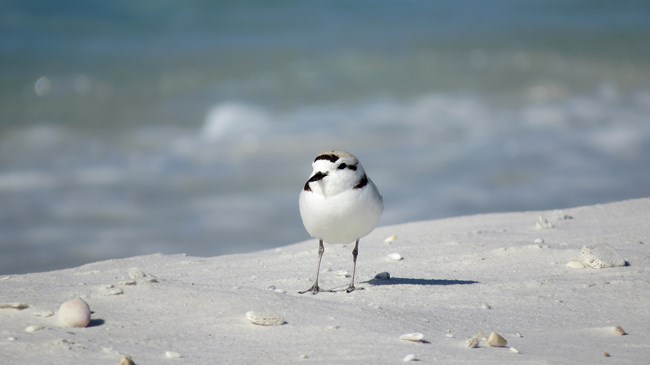
Image credit: Florida Fish and Wildlife Research Institute / Emily Hunter
Many plants and animals have adapted to and are dependent on those thin strips of shifting land. Over 300 bird species visit the national seashore. One speedy little shorebird that particularly captivates the attention of park staff and visitors is the snowy plover. Weighing just a little over an ounce, it nests on the beach to spot approaching predators, making it well suited to this wide open landscape.
Also present in this coastal landscape are perennially charismatic sea turtles. Three sea turtle species nest on the park’s beaches: loggerhead, green and Kemp’s ridley. Park biologists began a systematic nest survey at the Florida units of the park in 1994. Since then, they have found an average of around forty nests each year. One of these nighttime nesters might encounter a tiny rodent near the toe of a dune: the federally endangered Perdido Key beach mouse. This little animal goes about its nighttime feeding activities, distributing and depositing seeds. Unknowingly aiding vegetation communities that help anchor the restless sand, it is both using and supporting this habitat.
Park managers also use and support this habitat, doing their best to balance the health and existence of a fragile ecosystem with people’s desire to live near and use the beach for relaxation and enjoyment. According to official National Park Service visitor use records, out of over 400 National Park units, Gulf Islands National Seashore was the ninth most visited park in 2021, with over five million visitors. Although visitors love the seashore, their presence can compromise its health. Actions like driving vehicles on the beach or clearing sand from roads alter the sand’s natural movement.
To understand what is happening to the park’s coastlines, park managers need an “account statement” for the islands’ sediment budget.
But other, even harsher impacts originate far from park entrance gates. Dams, jetties, and shipping channels alter sediment distribution patterns, trapping or removing beach-building sand and restricting how much reaches the islands. Frequent beachgoers may casually observe sand where there was once open water or note that the shoreline is closer to the road than it used to be. But for effective decision-making, we need to take a more rigorous approach, which means measuring landscape features accurately, reproducibly, and methodically over time. In other words, to understand what is happening to the park’s coastlines, park managers need an “account statement” for the islands’ sediment budget.
How to Map a Beach’s Budget
The National Park Service’s Inventory and Monitoring Program designs and implements projects that track an ecosystem’s "vital signs"—indicators of its health. These are things like coastline geomorphology, which looks at the shape of dunes and other physical features and how they get that way. The program divides this work among 32 networks that monitor vital signs on national park units in loosely defined ecoregions. The Gulf Coast network works in an ecoregion that fans inland from the northern and western Gulf of Mexico and includes two seashore parks: Padre Island National Seashore and Gulf Islands. The Gulf Coast network monitors coastal geomorphology at these seashore parks as one of their vital signs.
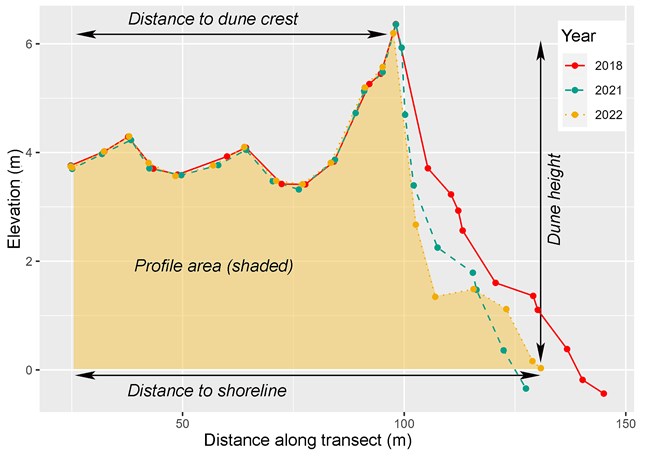
Image credit: NPS / Jeff Bracewell
In 2017, the Gulf Coast network laid out a system of equally spaced, cross-shore transects along the shoreline of Gulf Islands National Seashore. Researchers record latitude, longitude, and elevation along the transects. They take measurements along the beach and dunes where the slope changes. From these data, they use computer software to generate profile graphs that show things like dune height, dune distance from an established point, and the amount of sand making up the dune. Park scientists compare these measurements over time to determine what has changed. The network also records the geographic position of the shoreline, using similar methods.
I was recording the shoreline’s position as I walked along the wrack line left by the last high tide. When I got back to the office, I plotted the mapped shoreline position over time on a graph, calculating the rate of shoreline advance or retreat. With several years’ worth of these kinds of data, we can make predictions about where the shoreline will be in the future. Seashore parks in the northern Atlantic, such as Gateway National Recreation Area, started using these methods for monitoring coastal habitats over a decade ago. The Gulf Coast network adopted these time-tested procedures to collaborate and compare results with other networks on a much larger geographic scale.
Nine Feet of Shoreline Lost Annually Since 2001
The dataset that the Gulf Coast network assembled shows that the shoreline is retreating rapidly in portions of both of its seashore parks, notably in areas adjacent to shipping channels. Between 2018 and 2022, the shorelines at the Perdido Key and Fort Pickens Units of Gulf Islands retreated at a rate of about 16.5 feet per year. The United States Geological Survey reports a longer-term retreat rate of almost two and a half feet per year for this area between 1965 and 2001.
I merged the Gulf Coast network’s recent shoreline data with the Geological Survey’s longer-term data. The combined dataset showed that the shoreline retreated almost nine feet per year between 2001 and 2022, indicating an increasing rate of erosion. Sure enough, the Gulf Islands dune profiles I plotted also showed that the islands are retreating.
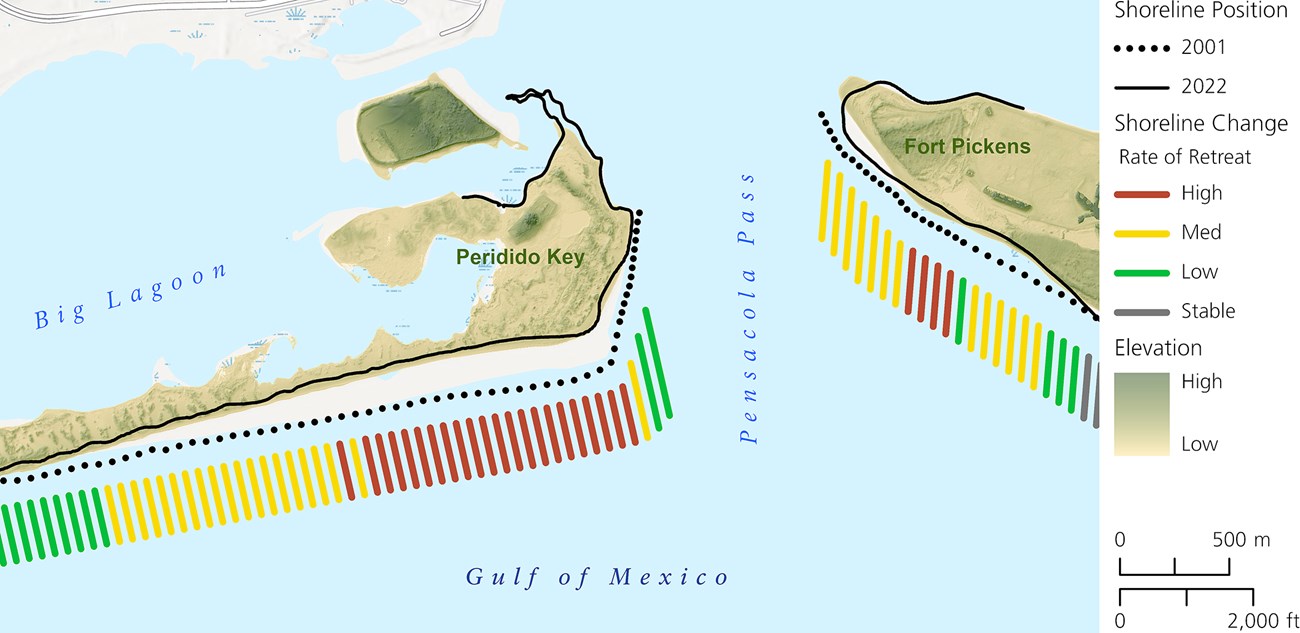
Image credit: NPS / Jeff Bracewell
The advanced rate of shoreline retreat I detected for 2018 to 2022 is partly due to impacts from the 2020 Atlantic hurricane season, the most active season ever recorded. Seven hurricanes affected the northern Gulf of Mexico that year. But Hurricane Sally was particularly damaging, breaching Perdido Key in several places and undermining the structural integrity of park roads.
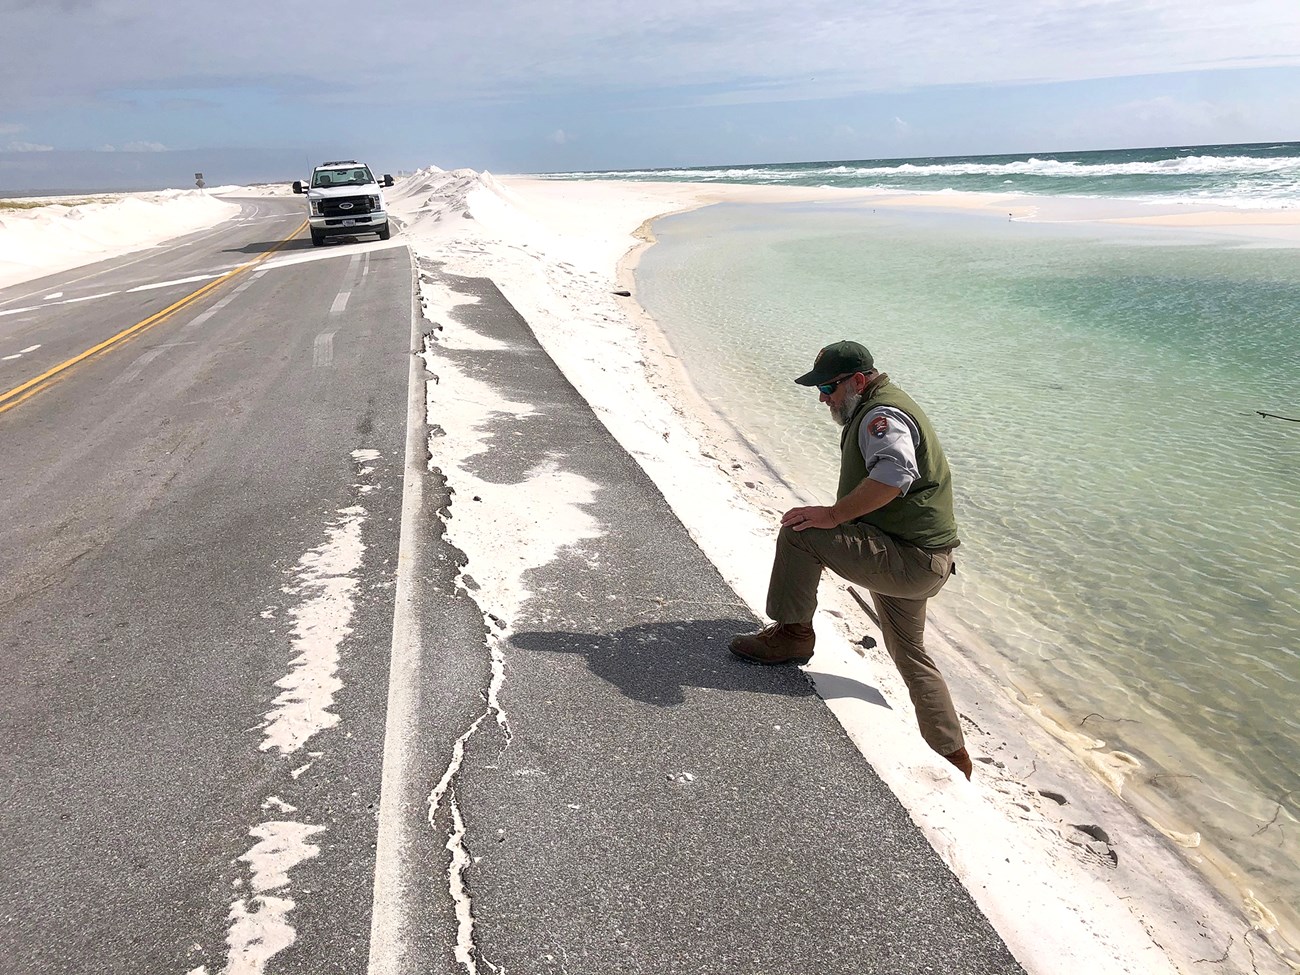
Image credit: NPS / Jennifer Manis
Scientists think that warming oceans will cause future Atlantic Ocean hurricanes to produce even more rain and stronger winds. Projected rises in sea level mean more coastal inundation during tropical storms. There is less scientific agreement about the future frequency of hurricanes in the Atlantic Ocean Basin, including the Gulf of Mexico. But any combination of increased storm intensity or frequency will challenge the resiliency of coastal parks.
Small Sea Level Increases Can Have Huge Impacts
Like a sandcastle leveled by a rising tide, inundation brings waves farther inland, eroding dunes. Tiny increases in water levels add up. Sea level is rising at Pensacola by about one tenth of an inch each year. Rates are nearly twice as high at nearby Panama Beach, Florida, and Dauphin Island, Alabama. The tidal range (difference between high tide and low tide water levels) measured at the NOAA Panama Beach tide station is one and a quarter feet. Given an annual rate of sea level rise of almost two tenths of an inch, my analysis shows that in about 78 years, Panama Beach’s high tide water level of today will be its low tide water level.
“From a management perspective, NPS has shifted in recent years to focus more on…nature and nature-based feature solutions.”
The disruption of natural sediment transport starves coastal seascapes of sand even while they are under increased threats from storms and inundation. What can seashore parks do to preserve and protect these beaches, their cultural heritage, and their resident animals and plants? One of the most common solutions is to manually place dredged sand back into the sediment “account.” National Park Service marine ecologist Monique LaFrance says, “From a management perspective, NPS has shifted in recent years to focus more on…nature and nature-based feature solutions…over more traditional hardened structures such as seawalls and jetties.”
What she means by this is the National Park Service prefers to add sand to beaches. Such softer solutions can “avoid the unintended consequences…hardened structures can have,” says LaFrance, like interrupting longshore sediment transport, which leads some areas to lose sand while others gain it.
Simulating a Natural Process Is Hard but Rewarding
Both Padre Island and Gulf Islands national seashores have recently used beach nourishment to return trapped sand to their coastal environments. The hope is this will restore and enhance their resiliency against rising waters and more frequent storms. Operators use dredge boats to siphon sand from shipping channels and place it along the shore, where it would have arrived naturally if there were no impediments. Active shipping channels require routine dredging so that ships do not run aground. Nearby sand-starved beaches could benefit from the deposition of that dredged material.
But restoring sand to beaches strategically is much more complex than just dumping it offshore or inland. It requires close coordination between the park and local governments, nonprofit organizations, and private contractors. And it isn’t cheap. It often takes years to satisfy state and federal requirements, design projects that work with natural processes, and mobilize specialized equipment. The costs can quickly run to millions of dollars.
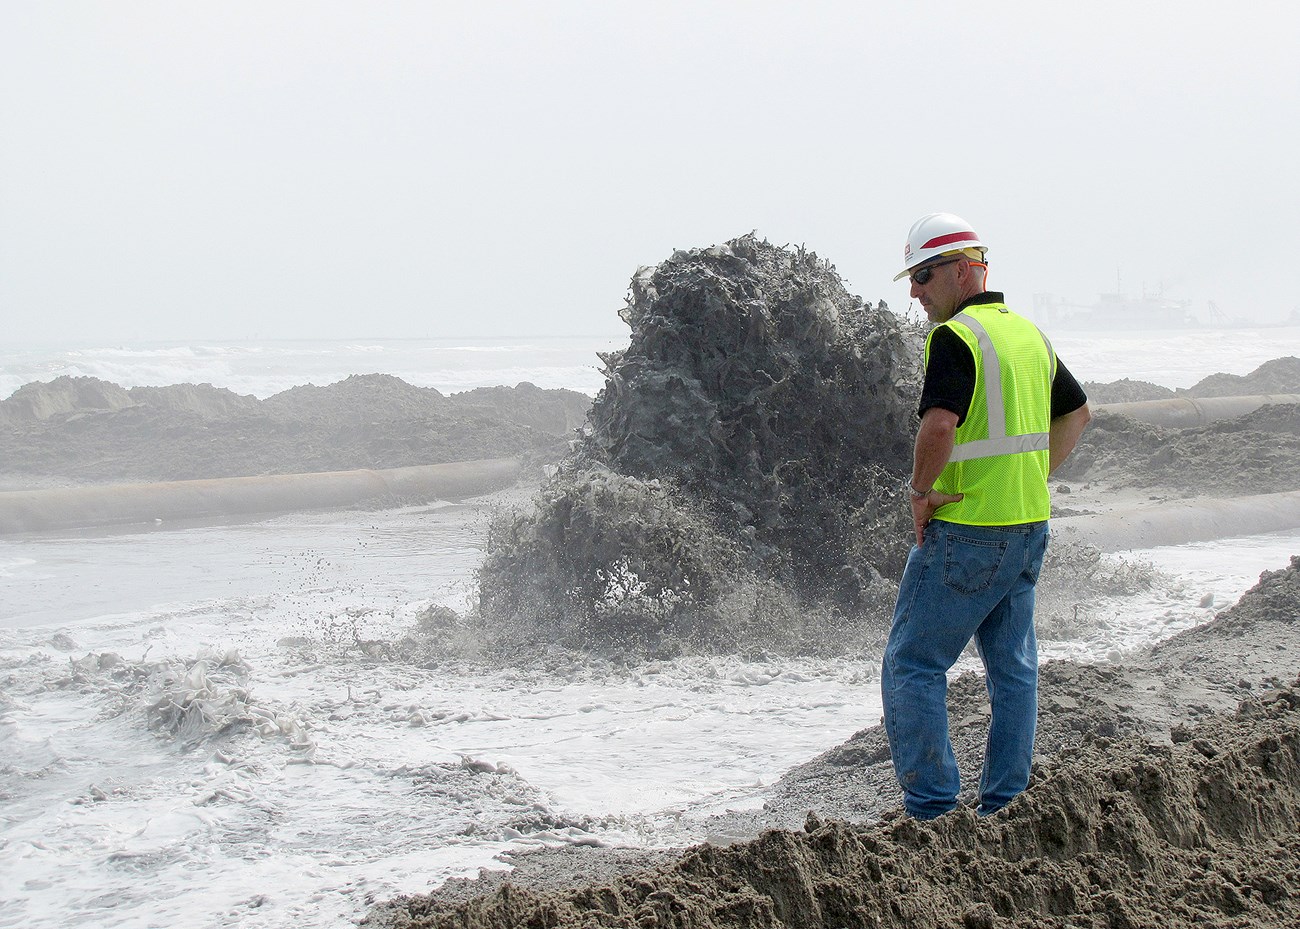
Image credit: U.S. Army Corps of Engineers
The results of a completed project are gratifying though. Recent Gulf Coast network monitoring data for Padre Island showed that the seashore’s southernmost beach extended seaward up to 554 feet between spring 2019 and spring 2021 after beach nourishment. That’s an area equal to about twenty-two soccer fields! Last year at Gulf Islands, a nourishment project added about 181,000 cubic yards of sand near the eastern end of Perdido Key. This project focused on an area breached by Hurricane Sally. These projects not only restored important natural habitats but also improved visitor access. Each successful nourishment project builds connections and reveals efficiencies that improve the likelihood of completing future such projects.
A Temporary Solution to Offset A Harsh Reality
Long-term monitoring captures more than just the immediate impacts of restoration. Bruce Leutscher is the team lead for Science and Resource Stewardship at Gulf Islands National Seashore. “Continuous monitoring following restoration actions such as the recent placement of sediment at Perdido Key will be highly beneficial,” says Leutscher. He explains this will help managers understand “how well the action functions long term” and will “assist in planning for future placements.” Long-term monitoring allows managers to weigh restoration costs against their effectiveness.
Padre Island Science and Resource Management lead Shelly Todd says that long-term monitoring has “implications for everything from recreational uses of the beach to sea turtle nesting to effective barrier island function.” She says it’s also critical for interpreting results and educating visitors “to help folks understand how man-made structures can impact normal sediment distribution, sea level rise, and myriad related issues."
It’s hard to alter human behavior or stop the onset of catastrophic climate change, but those of us on the front lines—the coastal areas—know how crucial it is to try.
Coastal parks are dynamic and surprising, and it’s hard to know what to expect. Today I saw rays “flying” through the water, a migrating songbird taking a quick respite, ghost crabs skittering into their holes, and a bald eagle stealing a fish from an Osprey. Tomorrow I might see none of those things. Coastal processes are also surprising but a little more predictable. We can tell roughly where the beach is going based on monitoring records and try to help it out through beach nourishment.
It’s hard to alter human behavior or stop the onset of catastrophic climate change, but those of us on the front lines—the coastal areas—know how crucial it is to try. Restoration projects like beach nourishment, though temporary, can protect coastal habitats, cultural sites, animals, and plants while we work on more difficult, permanent solutions.

About the author
Jeff Bracewell is a geographic information system (GIS) specialist with the Gulf Coast Inventory and Monitoring Network. He enjoys spending time with friends and family exploring public lands, especially where pine savannahs or beachcombing are involved. Image credit: NPS
