Last updated: April 30, 2025
Article
Climate and Water Monitoring at Chiricahua National Monument: Water Year 2022
NPS
Overview
Together, climate and hydrology shape ecosystems and the services they provide, particularly in arid and semi-arid ecosystems. Understanding changes in climate, groundwater, and surface water is key to assessing the condition of park natural resources—and often, cultural resources.
At Chiricahua National Monument (Figure 1), Sonoran Desert Network scientists study how ecosystems may be changing by taking measurements of key resources, or “vital signs,” year after year—much as a doctor keeps track of a patient’s vital signs. This long-term ecological monitoring provides early warning of potential problems, allowing managers to mitigate them before they become worse. At Chiricahua National Monument, we monitor climate, groundwater, and springs, among other vital signs.
Surface-water and groundwater conditions are closely related to climate conditions. Because they are better understood together, we report on climate in conjunction with water resources. Reporting is by water year (WY), which begins in October of the previous calendar year and goes through September of the water year (e.g., WY2022 runs from October 2021 through September 2022).
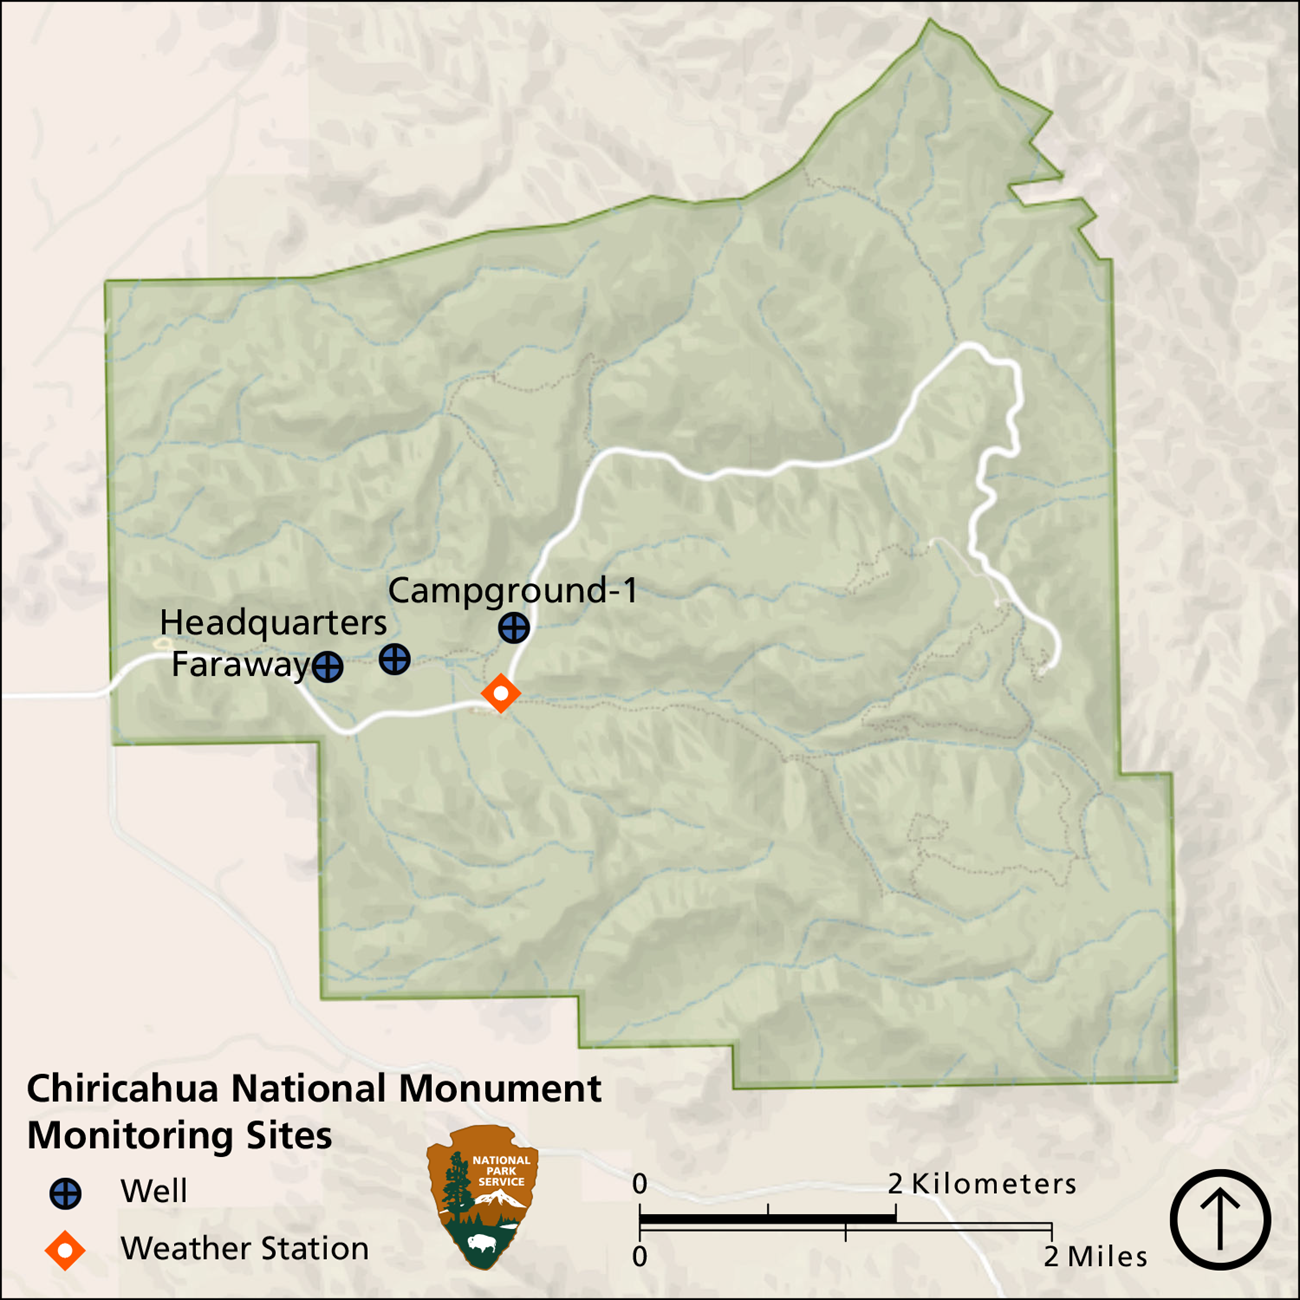
This article reports the results of climate and water monitoring at Chiricahua National Monument (Figure 1) in WY2022.
NPS
NPS
Climate and Weather
There is often confusion over the terms “weather” and “climate.” In short, weather describes instantaneous meteorological conditions (e.g., it’s currently raining or snowing, it’s a hot or frigid day). Climate reflects patterns of weather at a given place over longer periods of time (seasons to years). Climate is the primary driver of ecological processes on earth. Climate and weather information provide context for understanding the status or condition of other park resources.
Methods
A Remote Automated Weather Station (RAWS), Chiricahua Natl Mon Headquarters 021409, has been operational at Chiricahua National Monument since 1995 (Figure 1). This station provides a reliable climate dataset used for analyses in this report. Data from this station are accessible through Climate Analyzer.
Results for Water Year 2022
Precipitation
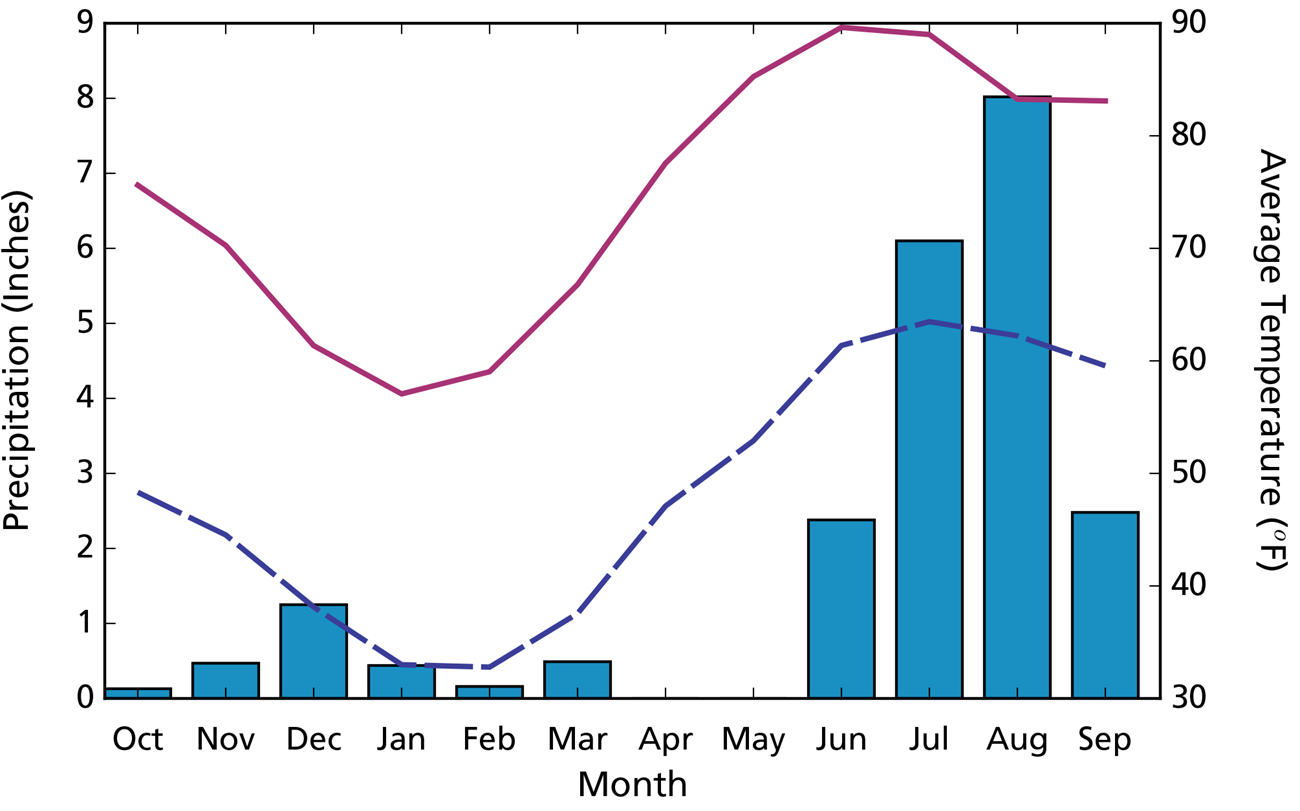
Annual precipitation at Chiricahua National Monument in WY2022 was 21.92″ (55.7 cm; Figure 2), which was 5.61″ (14.3 cm) more than the 1995–2020 annual average. This surplus occurred primarily during the summer monsoon season; total rainfall for June–September was 18.98″ (48.2 cm), 8.55″ (21.7 cm) more than the 1995–2020 average. Rainfall in December was near average. All other months received no rainfall or ≤ 62% of average. Extreme daily rainfall events (≥ 1″; 2.54 cm) occurred on 5 days, which is higher than the average annual frequency of 2.9 days. Extreme rainfall events occurred on 22 July 2022 (1.21″; 3.1 cm), 28 July 2022 (1.49″; 3.8 cm), 09 August 2022 (1.10″; 2.8 cm), 20 August 2022 (2.23″; 5.7 cm), and 22 September 2022 (1.06″; 2.7 cm).
Air Temperature
The mean annual maximum temperature at Chiricahua National Monument in WY2022 was 74.9°F (23.8°C), 0.6°F (0.3°C) above the 1995–2020 average. The average annual minimum temperature in WY2022 was 48.5°F (9.2°C), 0.8°F (0.4°C) above the 1995–2020 average. Mean monthly maximum and minimum temperatures in WY2022 differed by as much as to 4.8°F (2.7°C; see December as an example) relative to the 1995–2020 monthly averages (Figure 2). Extremely hot temperatures (≥ 94°F; 34.4°C) occurred on 21 days in WY2022, similar to the average frequency of 22.8 days. Extremely cold temperatures (≤ 28°F; -2.2°C) occurred on 17 days, less than the average frequency of 22.6 days.
NPS
Drought
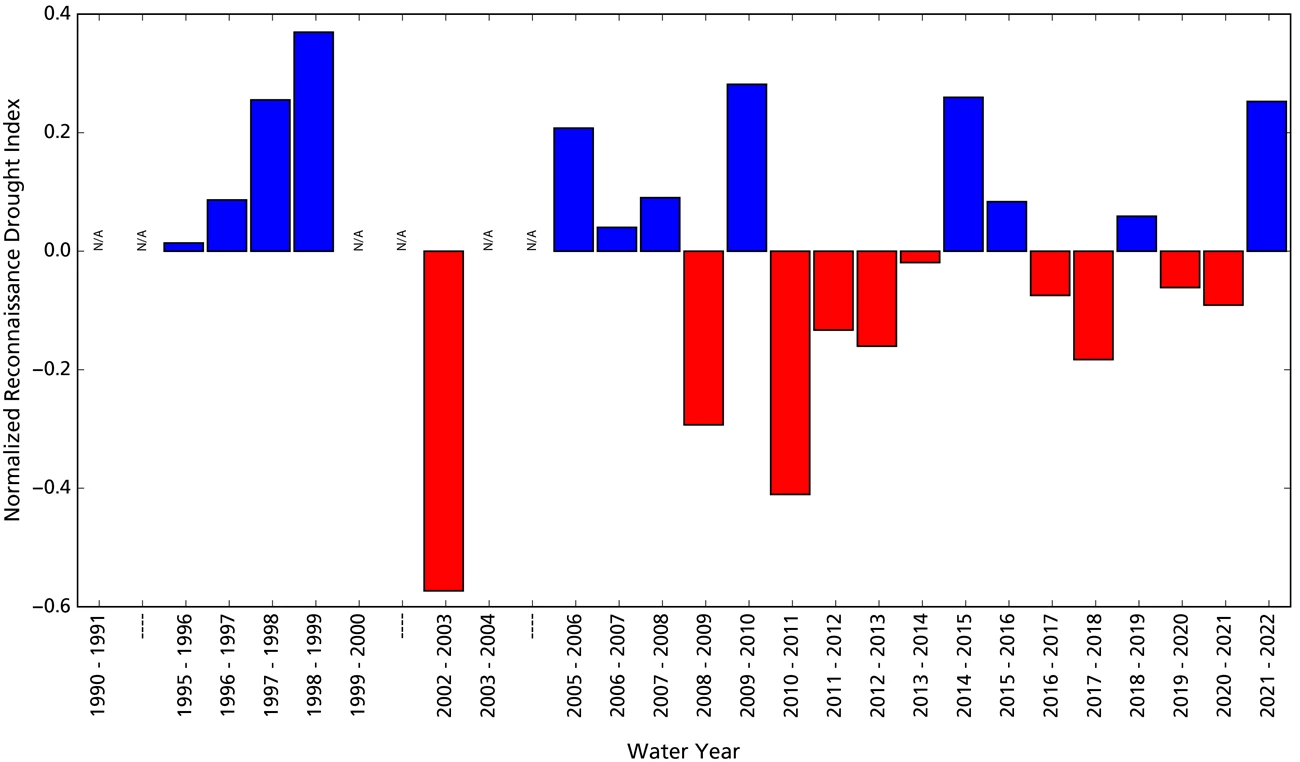
Reconnaissance drought index (Tsakiris and Vangelis 2005) provides a measure of drought severity and extent relative to the long-term climate. It is based on the ratio of average precipitation to average potential evapotranspiration (the amount of water loss that would occur from evaporation and plant transpiration if the water supply was unlimited) over short periods of time (seasons to years). The reconnaissance drought index for Chiricahua National Monument indicates that WY2022—after two consecutive years of drought—was wetter than the 1991–2020 average, from the perspective of both precipitation and potential evapotranspiration (Figure 3).
Reference: Tsakiris G., and H. Vangelis. 2005. Establishing a drought index incorporating evapotranspiration. European Water 9: 3–11.
NPS
Groundwater
Groundwater is one of the most critical natural resources of the American Southwest, providing drinking water, irrigating crops, and sustaining rivers, streams, and springs throughout the region.
Methods
Groundwater at Chiricahua National Monument is monitored using three wells (Figure 1). The Campground-1 and Headquarters wells are monitored monthly by monument staff. Monitoring at Campground-1 well was suspended in December 2020 and restarted in June 2022 when the new well house was completed. Average water levels for that well are not representative of the entire year. The Faraway Ranch well was monitored by monument staff until 2016 when the Arizona Department of Water Resources (ADWR) began continuous monitoring. ADWR data are available at the Arizona Department of Water Resources Well Registry.
Results for Water Year 2022
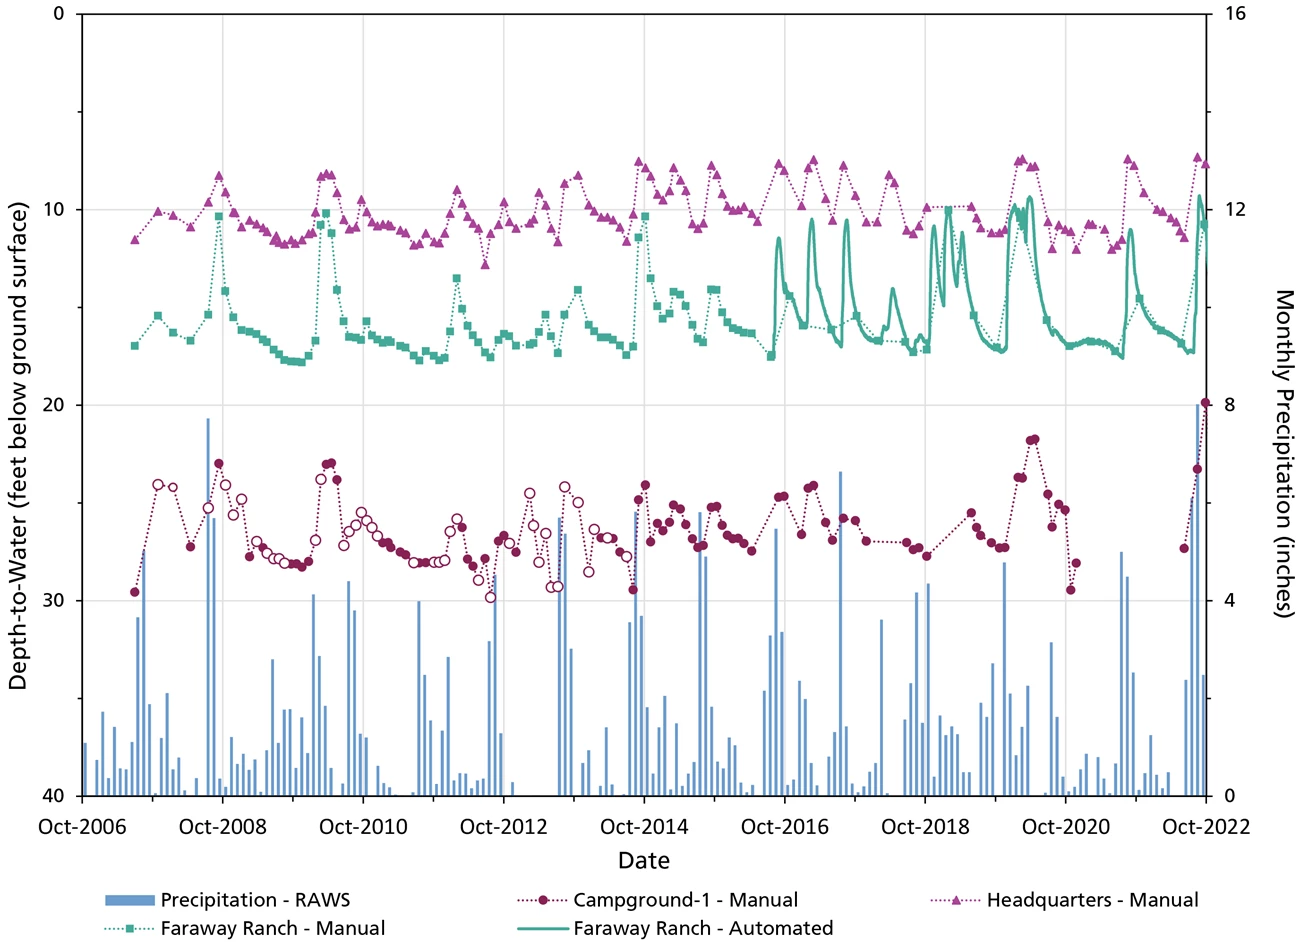
Average water levels in all three wells were higher than in the previous year (Table 1). All three wells recorded their highest water levels of the monitoring records in August or September 2022 in response to higher-than-average precipitation during the monsoon season. On 16 August, Headquarters well water level was 7.33 ft (2.23 m) below ground surface (bgs). Faraway Ranch well water level was 9.26 ft (2.82 m) bgs on 26 August. Campground-1 well was 19.87 ft (6.06 m) bgs on 27 September. Overall, water levels in the three wells have been stable, with seasonal variability caused by runoff events in Bonita Creek. Water levels at the three wells have only varied 5.51–9.96 ft (1.68–3.04 m) over the monitoring period (Figure 4). Many measurements made at Campground-1 may not represent static conditions due to pumping at a nearby well.
Table 1. Groundwater monitoring results for Chiricahua National Monument, water year (WY) 2022 (amsl = above mean sea level; bgs = below ground surface, n/a = not applicable).
| Name | State Well Number | Wellhead Elevation (ft amsl) |
Average Depth to Water (ft bgs) |
Average Water Level Elevation (ft amsl) |
Change in Elevation from WY2021 (± ft) |
|---|---|---|---|---|---|
| Campground-1 | 629082 | 5,340.00 | 23.50 | 5317.00 | 5.27 |
| Headquarters | 629081 | 5,256.00 | 9.75 | 5246.25 | 0.86 |
| Faraway Ranch | 629083 | 5,216.13 | 15.32 | 5200.17 | 0.91 |
NPS
Springs
Background
Springs, seeps, and tinajas (small pools in a rock basin or impoundments in bedrock) are small, relatively rare biodiversity hotspots in arid lands. They are the primary connection between groundwater and surface water and are important water sources for plants and animals. For springs, the most important questions we ask are about persistence (How long was there water in the spring?) and water quantity (How much water was in the spring?).
Methods
Sonoran Desert Network springs monitoring is organized into four modules, described below.
Site Characterization
This module, which includes recording GPS locations and drawing a site diagram, provides context for interpreting change in the other modules. We also describe the spring type (e.g., helocrene, limnocrene, rheocrene, or tinaja) and its associated vegetation. Helocrene springs emerge as low-gradient wetlands, limnocrene springs emerge as pools, and rheocrene springs emerge as flowing streams. This module is completed once every five years or after significant events.
Site Condition
We estimate natural and anthropogenic disturbances and the level of stress on vegetation and soils on a scale of 1–4, where 1 = undisturbed, 2 = slightly disturbed, 3 = moderately disturbed, and 4 = highly disturbed. Types of natural disturbances can include flooding, drying, fire, wildlife impacts, windthrow of trees and shrubs, beaver activity, and insect infestations. Anthropogenic disturbances can include roads, off-highway vehicle trails, hiking trails, livestock and feral-animal impacts, removal of invasive non-native plants, flow modification, and evidence of human use of the spring. We take repeat photographs showing the spring and its landscape context. We note the presence of certain obligate wetland plants (plants that almost always occur only in wetlands), facultative wetland plants (plants that usually occur in wetlands, but also occur in other habitats), and non-native bullfrogs and crayfish, and we record the density of invasive, non-native plants.
Water Quantity
We measure the persistence of surface water, amount of spring discharge, and wetted extent (area that contained water). To estimate persistence, we analyze the variance of temperature measurements taken by logging thermometers placed at or near the orifice (spring opening). Because water mediates variation in diurnal temperatures, data from a submerged sensor will show less daily variation than data from an exposed open-air sensor; this tells us when the spring was wet or dry. Surface discharge is measured with a timed sample of water volume. Wetted extent is a systematic measurement of the physical length (up to 100 m), width, and depth of surface water. It is assessed using a technique for either standing water (e.g., limnocrene and helocrene springs) or flowing water (e.g., rheocrene springs).
Water Quality
We measure core water quality parameters and water chemistry. Core parameters include water temperature, pH, specific conductivity (a measure of dissolved compounds and contaminants), dissolved oxygen (how much oxygen is present in the water), and total dissolved solids (an indicator of potentially undesirable compounds). Discrete samples of these parameters are collected with a multiparameter meter. If the meter failed calibration check(s), we indicate that condition when presenting data. Water chemistry is assessed by collecting surface water sample(s) and estimating the concentration of major ions with a photometer in the field. These parameters are collected at one or more sampling locations within a spring. Data are presented only for the primary sampling location. Each perennial spring is somewhat unique, and there are not water quality standards specific to most perennial springs in Arizona. Where conditions exceed water quality standards for other surface waters (rivers, streams, lakes, and reservoirs), we note it, but the reader is advised that these standards were not developed for perennial springs. Our ongoing data collection at each spring will improve our understanding of the natural range in water quality and water chemistry parameters for a given site.
eDNA
An inventory of rare and invasive species and pathogens in perennial springs was implemented in WY2022 using environmental DNA (eDNA) techniques. Samples were preserved in ethanol prior to DNA extraction and analysis by the Goldberg Lab at Washington State University.
Target Organisms for eDNA Project:
-
The non-native invasive American bullfrog (Rana catesbeiana), which is suspected but not confirmed to currently occur within the park (Powell et al. 2008).
-
The pathogen chytrid fungus (Batrachochytrium dendrobatidis), a major threat to amphibians globally that is currently expanding in the American Southwest but has not been previously detected in Chiricahua National Monument.
-
Ranaviruses, pathogens that can infect amphibians and produce 90–100% mortality in tadpoles and adults and can persist in affected wetlands. Ranaviruses have not been previously detected at Chiricahua National Monument.
-
The native amphibian Chiricahua leopard frog (Rana chiricahuensis), a federally designated threatened species with a historical range that included the park (Powell et al. 2008). Designated critical habitat is located east of the park.
-
The native amphibian lowland leopard frog (Rana yavapaiensis), a species of conservation concern that occurs in the region but has not been observed within the park (Powell et al. 2008).
-
The native aquatic northern Mexican garter snake (Thamnophis eques megalops), a federally designated threatened species that has previously been observed within the park (Powell et al. 2008). Designated critical habitat is found south of the Chiricahua Mountains.
-
The native jaguar (Panthera onca), a federally designated endangered species that was historically found within Chiricahua National Monument. The park lies within the designated critical habitat for jaguar recovery.
Reference: Powell, B.F., Schmidt, C.A., Halvorson, W.L., and Anning, Pamela., 2008. Vascular plant and vertebrate inventory of Chiricahua National Monument. U.S. Geological Survey Open-File Report 2008-1023: 104.
Scroll down or click on a spring below to view monitoring results.
Garfield SpringNewton Cave Seep
Shake Spring
Silver Spur Spring
NPS
Recent Findings at Garfield Spring
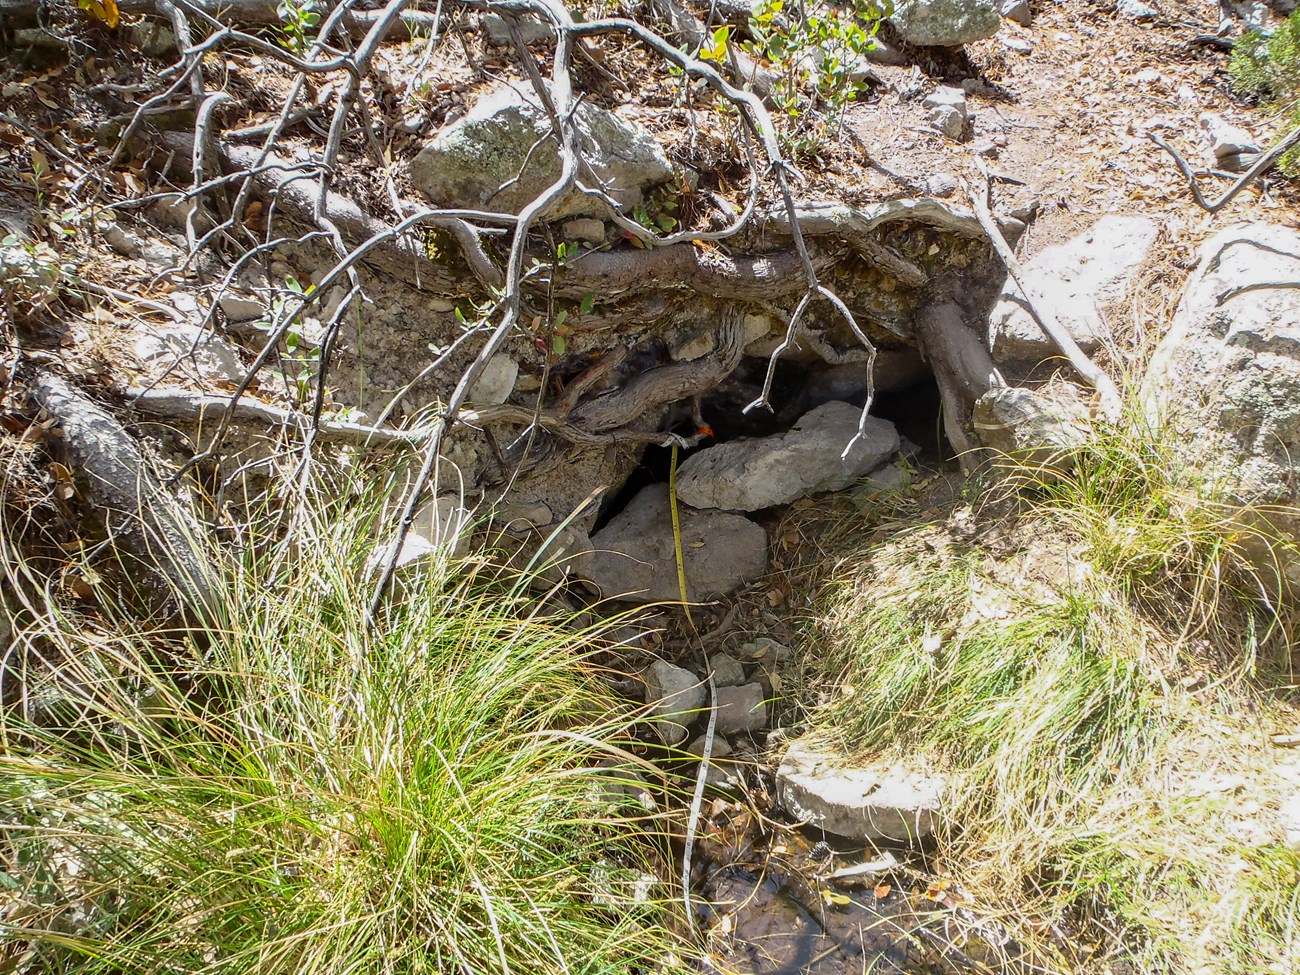
Garfield Spring is a rheocrene spring (emerges as a flowing stream) that originates as a small, 1 m x 2 m rocky pool beneath an overhang stabilized by roots (Figure 5). The pool feeds a narrow (about 20 cm) and shallow (about 10 cm) travertine (type of limestone) channel, at times running underground. Native bunchgrasses and mosses line the edge of the channel, which is also partially shaded by small oak trees. When described on 12 April 2022, the channel was wetted (meaning it contained water) but without visible flow. Descriptions and other characteristics of springs are updated every five years.
Site Condition
As in past years, we noted slight disturbance from the impact of hiking trails in WY2022; there is a well-used social trail that leads directly to the spring. Also similar to past years, use by wildlife was rated as “slightly disturbed” due to digging in the spring orifice, tracks, trampling, scat, and evidence of browsing found around the site. We observed, for the first time, downed trees and accumulations of scattered branches suggesting windthrow from powerful weather events in WY2022. All other natural and human-caused disturbance types were rated as “undisturbed.”
We did not observe crayfish or bullfrogs (non-native, invasive, aquatic animals), and did not detect any non-native plants at Garfield Spring. We did detect native sedges (Carex sp. and Cyperaceae sp.), obligate wetland plants that occurred around the pool and springbrook as in past years.
Four water samples were collected and filtered (0.45 µm mesh) from the orifice, springbrook, and terminal pool at Garfield Spring on 12 April 2022 to analyze eDNA. None of our target organisms were detected. Data collection for this eDNA inventory continues at this site, and additional information will be provided in a future, more detailed report.
Water Quantity
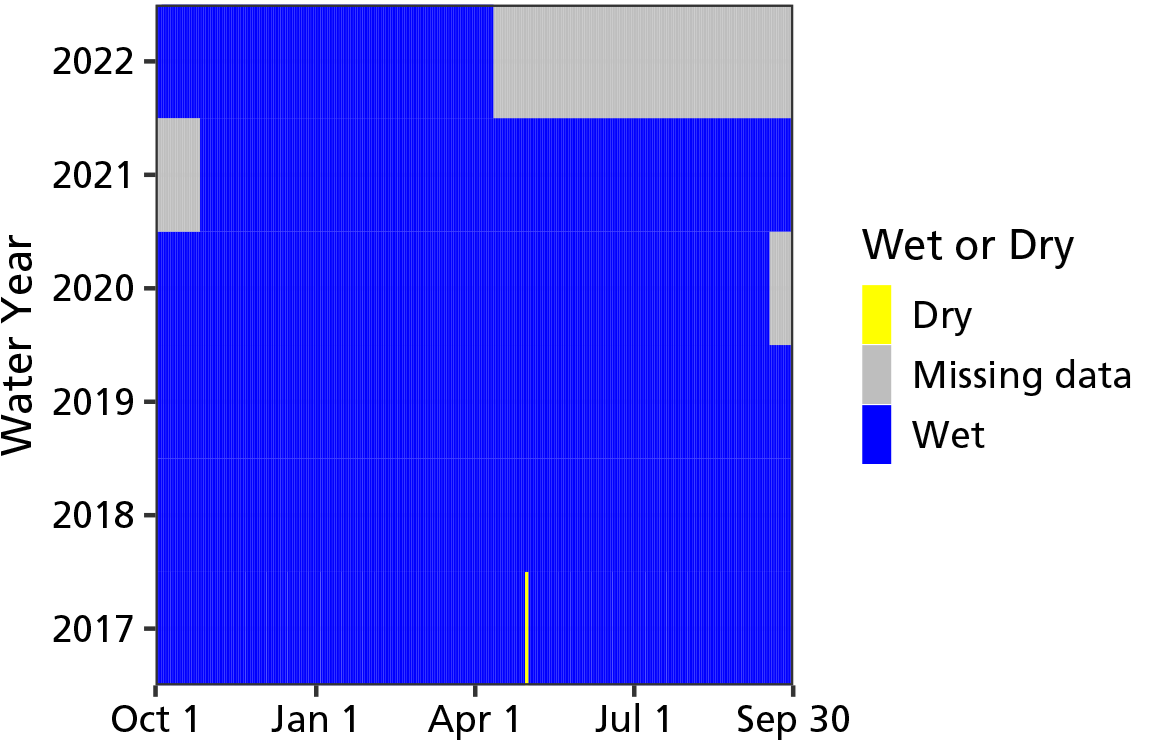
The WY2022 visit occurred on 12 April 2022, and the spring contained water when visited. Temperature sensors indicated that Garfield was wetted (contained water) for all 194 days (100% of days) measured up to the WY2022 visit (Figure 6). In prior water years, the spring was wetted 99.5–100% of the days measured.
NPS
Discharge was estimated at 0.2 ± 0.0 L (0.05 ± 0.0 gal) per minute in WY2022. This was on the lower end of the range observed in past years (Table 2).
Wetted extent at Garfield Spring was evaluated using a method for flowing water. Within the range observed in past years, the WY2022 total brook length was 31 m (102 ft), and width and depth averaged 31 cm (12.2 in), and 0.7 cm (0.3 in), respectively (Table 3).
Water Quality
Core water quality (Table 4) and water chemistry (Table 5) data were collected at the primary sampling location. The values were generally within the range recorded in prior years (accounting for the precision of our instruments), apart from alkalinity, which was slightly lower than previously observed (Table 5).
Garfield Spring Data Tables
Sampling Location |
WY2022 Value (range of prior values) | Prior Years Measured (# of measurements) |
|---|---|---|
| 002 | 0.2 ± 0 (0.3–0.6) | 2017–2021 (4) |
| Measurement | WY2022 Value (range of prior values) |
Prior Years Measured (# of measurements) |
|---|---|---|
| Width (cm) | 31 ± 25.9 (28.1–47.9) | 2017–2021 (4) |
| Depth (cm) | 0.7 ± 0.7 (0.3–0.8) | 2017–2021 (4) |
| Length (m) | 31 (24.9–37.5) | 2017–2021 (4) |
| Sampling Location | Measurement Location (width, depth) |
Parameter | WY2022 Value (range of prior values) |
Prior Years Measured (# of measurements) |
|---|---|---|---|---|
| 001 | Center | Dissolved oxygen (mg/L) | 3.7 (2.73–5.51) |
2017–2021 (4) |
| 001 | Center | pH | 6.82 (6.96–7.88) |
2017–2021 (4) |
| 001 | Center | Specific conductivity (µS/cm) | 183.9 (182.2–188.1) |
2017–2021 (4) |
| 001 | Center | Temperature (°C) | 13 (11.9–14.3) |
2017–2021 (5) |
| 001 | Center | Total dissolved solids (mg/L) | 120 (118–122.2) |
2017–2021 (4) |
| Sampling Location | Measurement Location (width, depth) |
Parameter | WY2022 Value (range of prior values) |
Prior Years Measured (# of measurements) |
|---|---|---|---|---|
| 001 | Center | Alkalinity (CaCO3) |
45 (60–80) | 2017–2021 (4) |
| 001 | Center | Calcium (Ca) |
16 (16–18) | 2017–2021 (4) |
| 001 | Center | Chloride (Cl) |
2 (3–10) | 2017–2021 (4) |
| 001 | Center | Magnesium (Mg) |
7 (6–11) | 2017–2021 (4) |
| 001 | Center | Potassium (K) |
2.4 (1.4–2.2) | 2017–2021 (4) |
| 001 | Center | Sulphate (SO4) |
2 (0–4) | 2017–2021 (4) |
NPS
Recent Findings at Newton Cave Seep
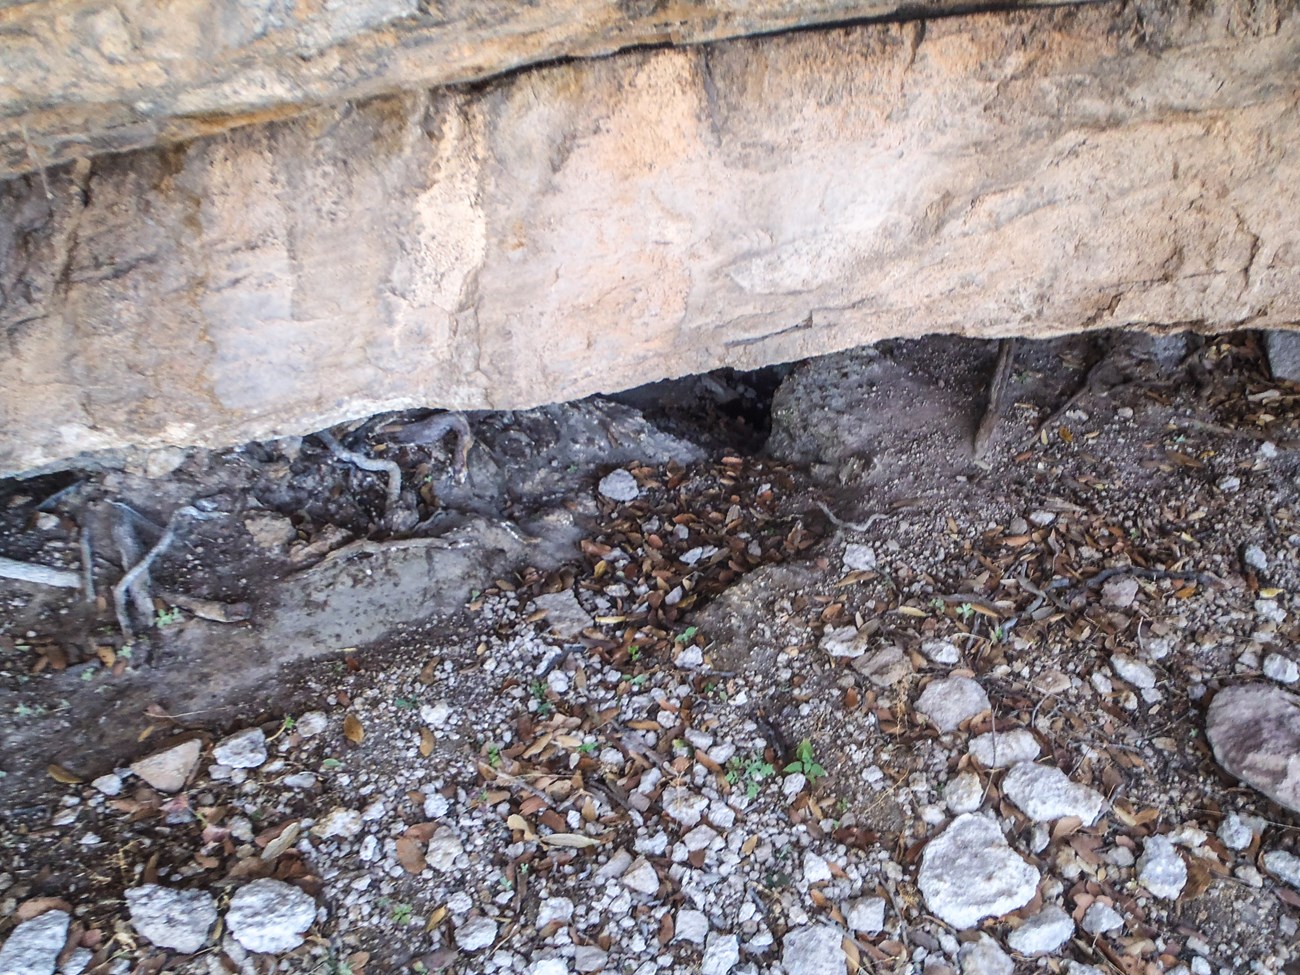
Newton Cave Seep is an exposure spring (groundwater exposed at surface but doesn’t flow) located beneath an overhanging cliff face (Figure 7). The orifice is a small (about 1 m²) depression that contains wet soil in some years. As in most previous years, Newton Cave Seep was dry when visited and characterized on 11 April 2022. Due to this persistent lack of surface water, WY2022 was the last year Newton Cave Seep will be sampled.
Site Condition
As in most past years, we noted moderate disturbance of Newton Cave Seep due to drying. In particular, nearby vegetation exhibited signs of drought stress (wilted or dropped leaves).
Consistent with previous visits, we did not observe crayfish or bullfrogs (non-native, invasive, aquatic animals), and did not find any non-native plants. Additionally, no obligate and facultative wetland plants were detected at Newton Cave Seep in WY2022.We did not sample for eDNA at this site because the spring was dry.
Water Quantity
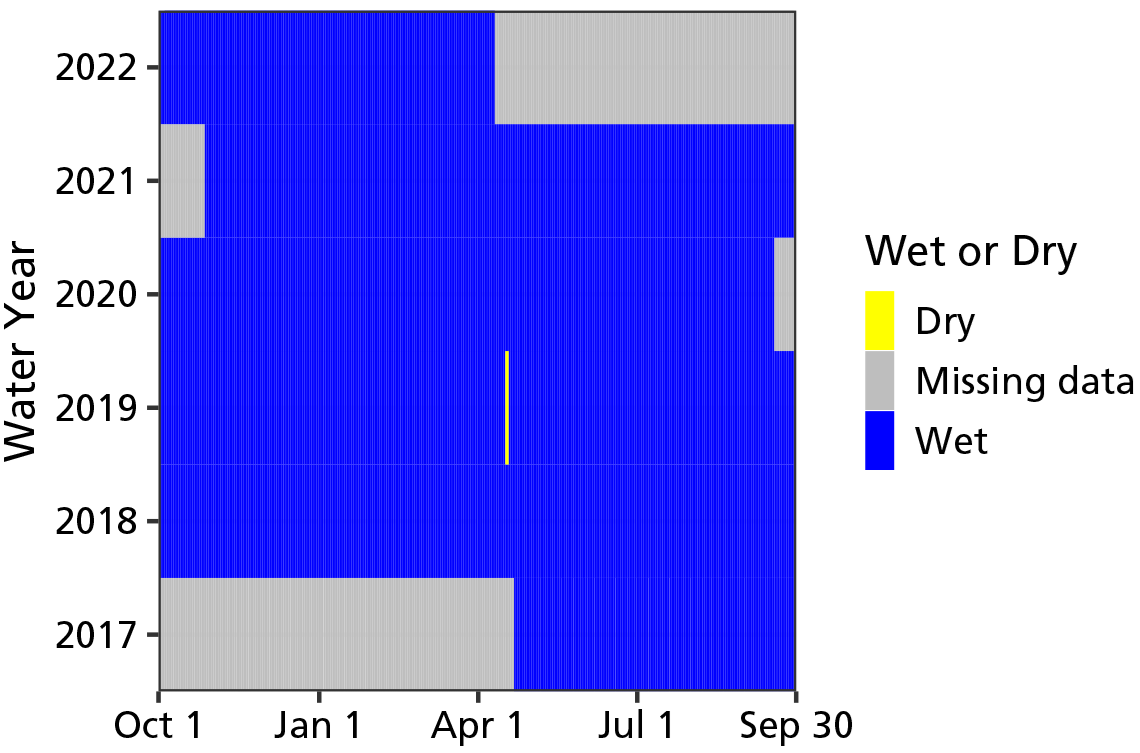
The WY2022 visit occurred on 11 April 2022, and the spring was dry at the surface. Temperature sensors indicated that Newton Cave Seep was wetted (contained water) for all 193 days (100% of days) measured up to the WY2022 visit (Figure 8). In prior water years, the spring was wetted 99.5–100% of the days measured. However, “wetted” in this context equates to saturated soils; as in nearly all the previous sampling periods, the soil remained wet—a “seep”—without any surface water.
As in past years, there was no measurable discharge at Newton Cave Seep in WY2022.
NPS
Water Quality
As in past years, core water quality and water chemistry data could not be collected as there was no surface water in Newton Cave Seep.
NPS
Recent Findings at Shake Spring
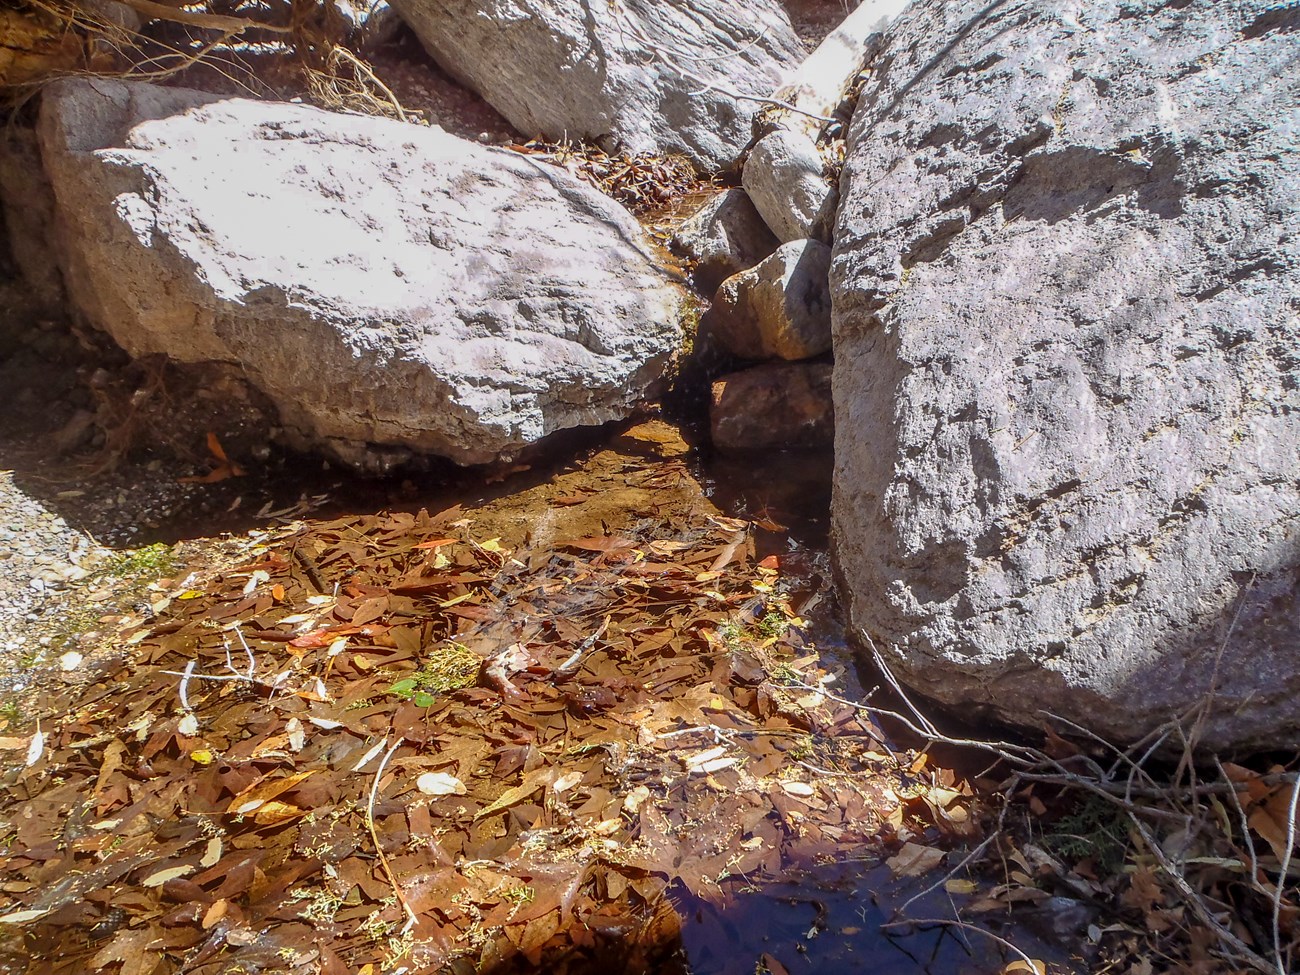
Shake Spring is a rheocrene spring (emerges as a flowing stream) that surfaces from at least two orifices within the main drainage of North Bonita Canyon. When visited and characterized on 14 April 2022, these orifices supported a long (about 70 m) springbrook with negligible surface flow. A nearby inactive springbox and rusted piping attests to the prior use of Shake Spring as the domestic water supply for Chiricahua National Monument. Descriptions and other characteristics of springs are updated every five years.
Site Condition
We noted a number of human and natural disturbances at Shake Spring, as in past years. The presence of a wrecked concrete dam, inoperative springbox, and rusted piping still highly influence local hydrology—lingering effects of the past use of Shake Spring as the monument’s domestic water source. Other persistent disturbances include the moderate disturbance of the nearby Bonita Canyon Road and associated vehicle pullouts adjacent to the spring, slight disturbance from social trails leading to the spring from this road, and additional slight disturbance from burned and dead trees along the springbrook that are likely the result of the 2011 Horseshoe 2 Fire. As in past years, we rated “slight disturbance” to Shake Spring from flooding (loss of water temperature sensor, scour and wrack along the channel). Like Garfield Spring, we observed moderate disturbance at Shake Spring for the first time from windthrown trees jumbled in and around the springbrook. There were no other natural or human-caused disturbances noted at Shake Spring in WY2022.
As in past years, we did not observe crayfish or bullfrogs (non-native, invasive, aquatic animals). We did observe a few (< 6) common mullein (Verbascum thapsus) plants along the springbrook similar to previous years. Common mullein is an invasive non-native biennial often found along drainages and other waterways in the American Southwest.
We did observe several obligate/facultative wetland plant genera that were also recorded in previous years: the forbs horsetail (Equisetum sp.) and monkeyflower (Mimulus sp.), sedges (Carex sp. and Cyperaceae sp.), and the riparian tree Arizona sycamore (Platanus wrightii).
Four water samples were collected and filtered (0.45 µm mesh) from the orifice, springbrook, and terminal pool at Shake Spring on 12 April 2022 for eDNA. None of our target organisms were detected. Data collection for this eDNA inventory continues at this site, and additional information will be provided in a future, more detailed report.
Water Quantity
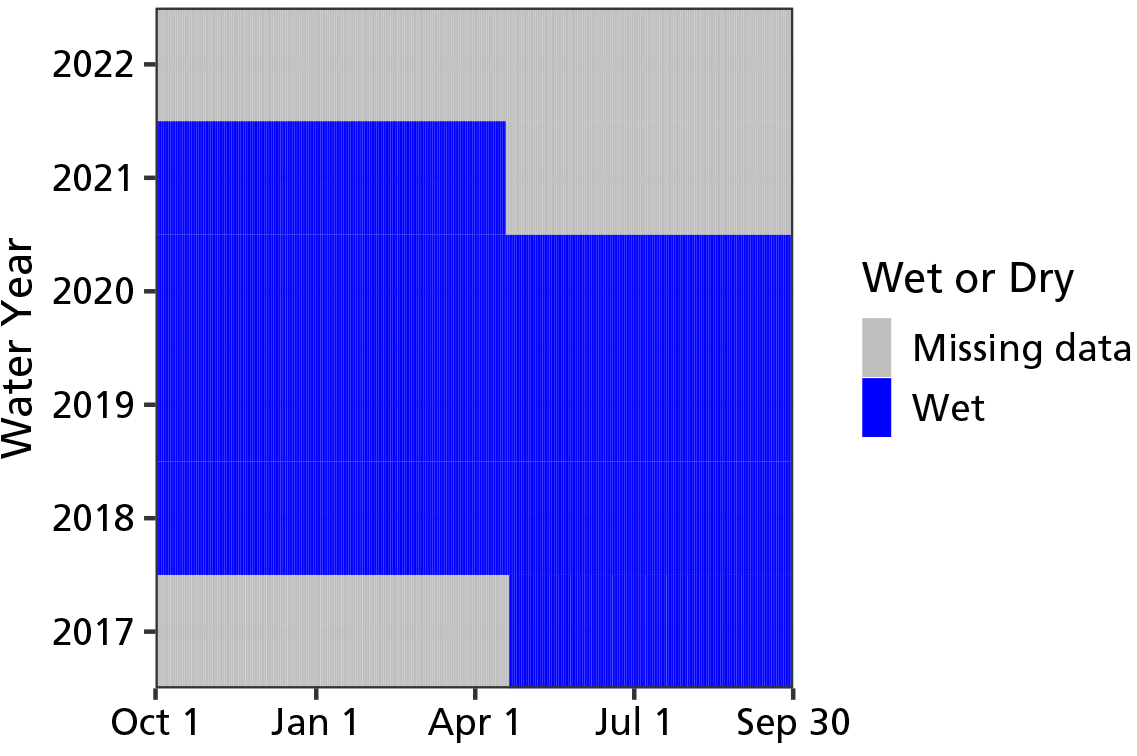
The WY2022 visit occurred on 14 April 2022, and the spring was wetted (contained water). The water temperature sensor was missing, likely lost during a large flow event during WY2022. In prior water years, the spring was wetted 100% of the days measured (Figure 10).
NPS
Unlike previous years (Table 6), discharge was not measured in WY2022 as there was no surface flow.
Wetted extent at Shake Spring was evaluated using a method for flowing water in WY2022. The total brook length was 97 m (318 ft)—slightly longer than previously observed. Width and depth averaged 74.8 cm (29.5 in), and 8.9 cm (3.5 in), respectively—comparable with observations in past years at Shake Spring (Table 7).
Water Quality
Core water quality (Table 8) and water chemistry (Table 9) data were collected at the primary sampling location of Shake Spring in WY2022. Dissolved oxygen, specific conductivity, total dissolved solids, alkalinity, and calcium were slightly higher, and temperature was about 2.5°C cooler than recorded values in previous years (Tables 8–9). All other water quality and water chemistry parameters were within the ranges observed previously.
Shake Spring Data Tables
| Sampling Location | WY2022 Value (range of prior values) | Prior Years Measured (# of measurements) |
|---|---|---|
| 001 | c.n.s. (5.7–12.8) | 2017–2021 (4) |
| Measurement | WY2022 Value (range of prior values) |
Prior Years Measured (# of measurements) |
|---|---|---|
| Width (cm) | 74.8 ± 47 (56.1–95) | 2017–2021 (4) |
| Depth (cm) | 8.9 ± 8.7 (2.5–8.5) | 2017–2021 (4) |
| Length (m) | 97.2 (30.9–92.8) | 2017–2021 (4) |
| Sampling Location | Measurement Location (width, depth) |
Parameter | WY2022 Value (range of prior values) |
Prior Years Measured (# of measurements) |
|---|---|---|---|---|
| 001 | Center | Dissolved oxygen (mg/L) | 6.73 (5.98–6.49) |
2017–2021 (4) |
| 001 | Center | pH | 7.41 (7.12–7.56) |
2017–2021 (4) |
| 001 | Center | Specific conductivity (µS/cm) | 372.7 (353.7–366.3) |
2017–2021 (4) |
| 001 | Center | Temperature (°C) | 10.6 (13–14.8) |
2017–2021 (5) |
| 001 | Center | Total dissolved solids (mg/L) | 242 (230.1–237.9) |
2017–2021 (4) |
| Sampling Location | Measurement Location (width, depth) |
Parameter | WY2022 Value (range of prior values) |
Prior Years Measured (# of measurements) |
|---|---|---|---|---|
| 001 | Center | Alkalinity (CaCO3) |
185 (135–170) | 2017–2021 (4) |
| 001 | Center | Calcium (Ca) |
56 (42–50) | 2017–2021 (4) |
| 001 | Center | Chloride (Cl) |
5 (5–56) | 2017–2021 (4) |
| 001 | Center | Magnesium (Mg) |
3 (1–13) | 2017–2021 (4) |
| 001 | Center | Potassium (K) |
1.5 (0.8–1.6) | 2017–2021 (4) |
| 001 | Center | Sulphate (SO4) |
5 (2–32) | 2017–2021 (4) |
NPS
Recent Findings at Silver Spur Spring
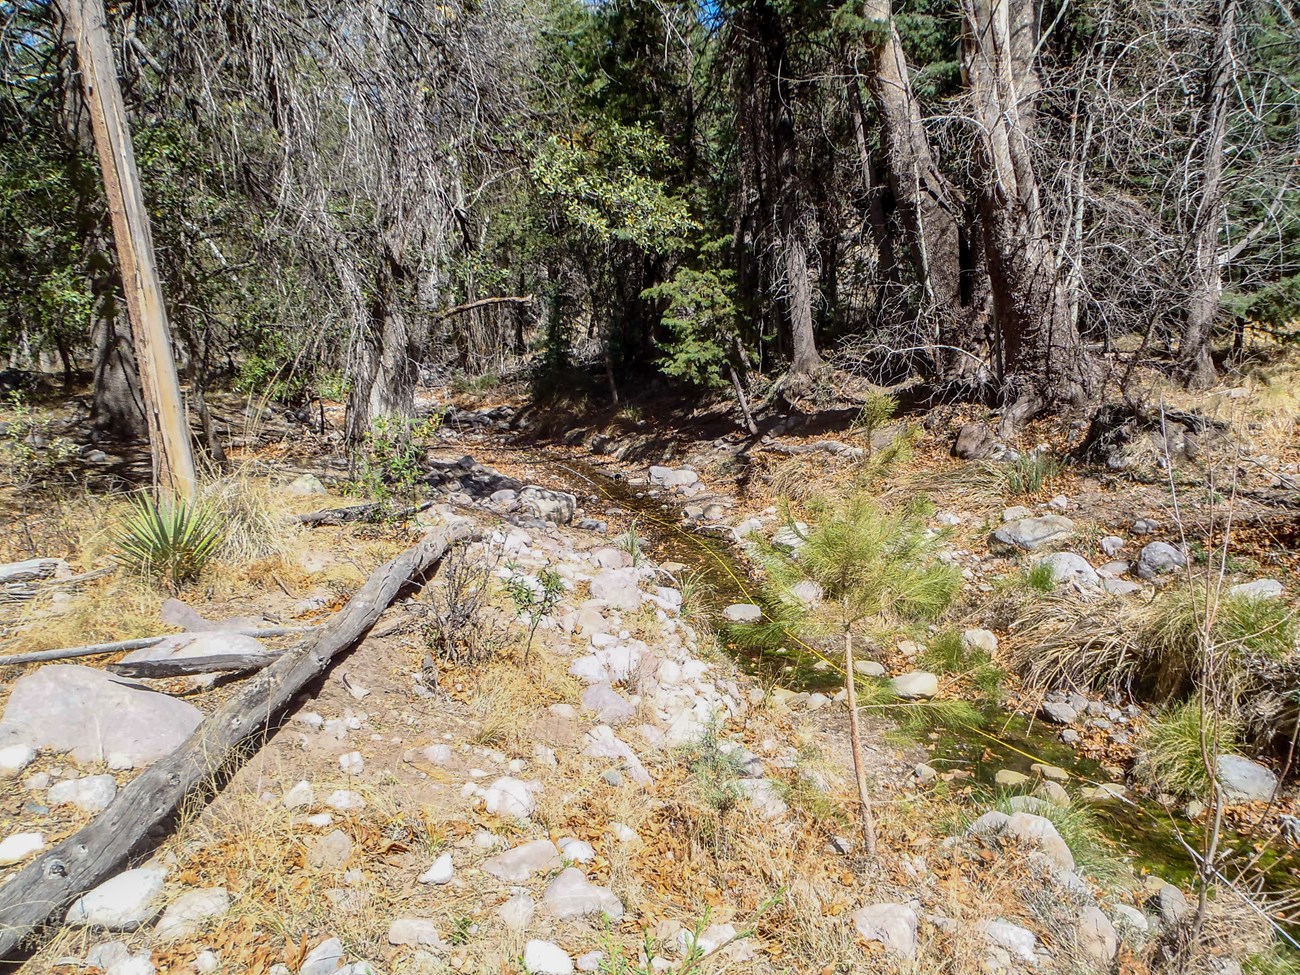
Silver Spur Spring is a rheocrene spring (emerges as a flowing stream) in lower Bonita Canyon (Figure 11). It is comprised of at least two orifices that support a mix of surface and subsurface flow within the main drainage. The WY2022 visit and site characterization occurred on 12 April 2022. Descriptions and other characteristics of springs are updated every five years.
Site Condition
We noted slight disturbance of Silver Spur Spring from wildlife use (digging and numerous tracks and other sign) and fire (scorched trees in and around the springbrook from the 2011 Horseshoe 2 Fire) as in past years. Similar to Garfield and Shake springs, windthrown trees were observed for the first time at Silver Spur Spring in WY2022, which we rated as a “slight disturbance.”
Consistent with previous years, we did not observe crayfish or bullfrogs (non-native, invasive, aquatic animals) at Silver Spur Spring in WY2022. We did, however, detect a pair of non-native plants—the annual sowthistle (Sonchus sp.) and biennial common mullein (Verbascum thapsus)—for the first time in WY2022, with 1–5 individual plants present.
We observed several obligate/facultative wetland genera at Silver Spur Spring that were also recorded in previous years: sedge (Carex sp. and Cyperaceae sp.), flatsedge (Cyperus sp.), horsetail (Equisetum sp.), and Arizona sycamore (Platanus wrightii).
Four water samples were collected and filtered (0.45 µm mesh) from the orifice and springbrook at Silver Spur Spring on 12 April 2022 for eDNA analysis. None of our target organisms were detected. Data collection for this eDNA inventory continues at this site, and additional information will be provided in a future, more detailed report.
Water Quantity
The WY2022 visit occurred on 12 April 2022, and the spring contained surface water when sampled.
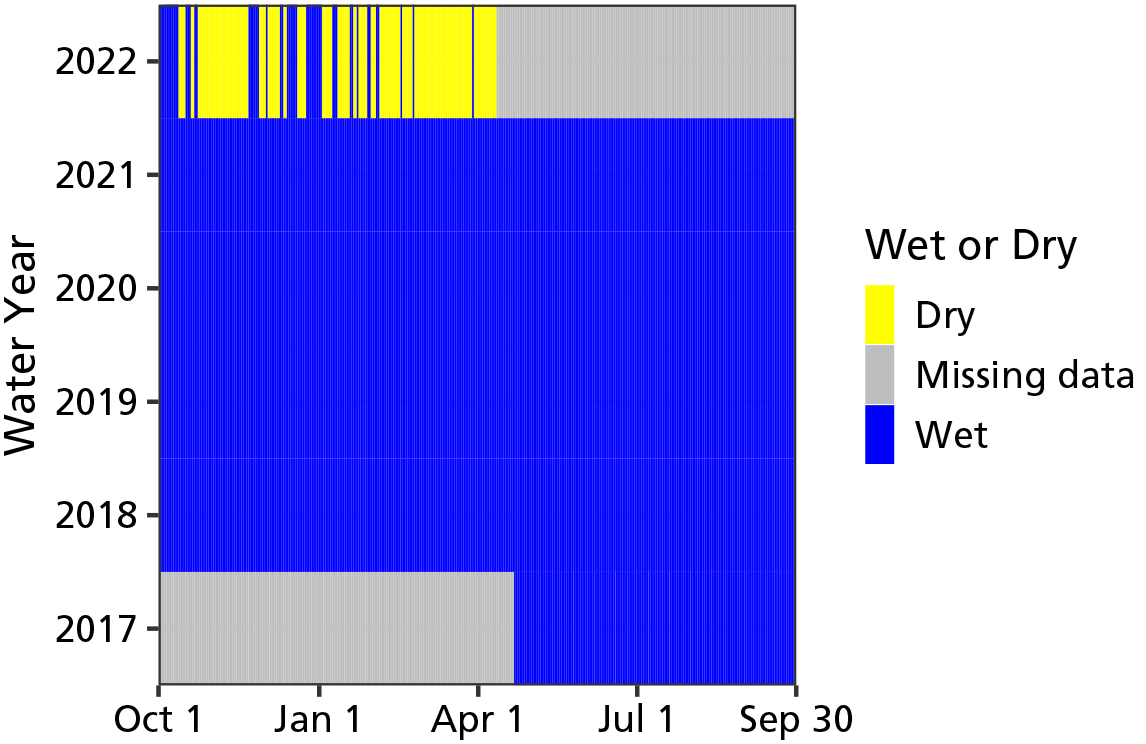
Temperature sensors indicated that Silver Spur Spring was wetted (contained water) for 54 of 194 days (27.8% of days) measured up to the WY2022 visit (Figure 12). In prior water years, the spring was wetted 100% of the days measured.
NPS
As in WY2019, discharge was not measured in WY2022 due to a lack of surface flow at Silver Spur Spring (Table 10).
Wetted extent was evaluated using a method for flowing water and was comparable to past years (Table 11). The total brook length was 71 m (233 ft). Width and depth averaged 100.3 cm (39.5 in), and 7.7 cm (3 in), respectively.
Water Quality
Core water quality and water chemistry data were collected at the primary sampling location in Silver Spur Spring in WY2022. The values were within the range recorded in prior years except for calcium (lower than in past years) and potassium (higher than in past years;Tables 12–13).
Silver Spur Spring Data Tables
| Sampling Location | WY2022 Value (range of prior values) |
Prior Years Measured (# of measurements) |
|---|---|---|
| 001 | c.n.s. (0–2.7) | 2018–2019 (2) |
| Measurement | WY2022 Value (range of prior values) |
Prior Years Measured (# of measurements) |
|---|---|---|
| Width (cm) | 100.3 ± 73.6 (111.7–126.2) | 2017–2021 (4) |
| Depth (cm) | 7.7 ± 0.9 (2.3–5.1) | 2017–2021 (4) |
| Length (m) | 71.3 (63.1–79.9) | 2017–2021 (4) |
| Sampling Location | Measurement Location (width, depth) |
Parameter | WY2022 Value (range of prior values) |
Prior Years Measured (# of measurements) |
|---|---|---|---|---|
| 001 | Center | Dissolved oxygen (mg/L) | 2.59 (1.7–7.88) |
2017–2021 (4) |
| 001 | Center | pH | 7 (6.84–7.33) |
2017–2021 (4) |
| 001 | Center | Specific conductivity (µS/cm) | 285.4 (284.7–299.3) |
2017–2021 (4) |
| 001 | Center | Temperature (°C) | 15.3 (15.4–19) |
2017–2021 (5) |
| 001 | Center | Total dissolved solids (mg/L) | 186 (185–195) |
2017–2021 (4) |
| Sampling Location | Measurement Location (width, depth) |
Parameter | WY2022 Value (range of prior values) |
Prior Years Measured (# of measurements) |
|---|---|---|---|---|
| 001 | Center | Alkalinity (CaCO3) |
75 (105–140) | 2017–2021 (4) |
| 001 | Center | Calcium (Ca) |
16 (24–30) | 2017–2021 (4) |
| 001 | Center | Chloride (Cl) |
8 (1–12) | 2017–2021 (4) |
| 001 | Center | Magnesium (Mg) |
9 (2–8) | 2017–2021 (4) |
| 001 | Center | Potassium (K) |
2 (0.6–1.3) | 2017–2021 (4) |
| 001 | Center | Sulphate (SO4) |
2 (1–29) | 2017–2021 (4) |
Report Citation
Authors: Kara Raymond, Andy Hubbard, Cheryl McIntyre
Raymond, K., A. Hubbard, and C. McIntyre. 2024. Climate and Water Monitoring at Chiricahua National Monument: Water Year 2022. Sonoran Desert Network, National Park Service, Tucson, Arizona.
