Last updated: October 24, 2024
Article
Climate and Water Monitoring at Chiricahua National Monument, Coronado National Memorial, and Fort Bowie National Historic Site: Water Year 2019

Overview
Climate and hydrology are major drivers of ecosystems. They dramatically shape ecosystem structure and function, particularly in arid and semi-arid ecosystems. Understanding changes in climate, groundwater, and water quality and quantity is central to assessing the condition of park biota.
At national parks in the Southeast Arizona group, scientists from the Sonoran Desert Network help park managers know what kind of change is happening by taking the same measurements of key resources year after year, much as a doctor keeps track of a patient’s vital signs. This long-term ecological monitoring provides early warning of potential problems, giving managers time to figure out how to mitigate them before they become worse. In the Southeast Arizona group, that monitoring includes climate, weather, groundwater, and springs, among other “vital signs.”
Water conditions are closely related to climate conditions. Because the two are better understood together, the Sonoran Desert Network reports on climate in conjunction with water resources. Reporting is done by water year (WY), which begins in October and ends the following September. This article provides an integrated look at climate, groundwater, and springs conditions at Chiricahua National Monument (NM), Coronado National Memorial (NMem), and Fort Bowie National Historic Site (NHS) during water year (WY) 2019 (October 2018–September 2019).

Climate and Weather
Background
There is often confusion over the terms “weather” and “climate.” In short, “weather” describes instantaneous meteorological conditions, such as whether it’s currently raining or snowing, or a hot or frigid day. “Climate” reflects patterns of weather at a given place over long periods of time (seasons to years). Climate is the primary driver of ecological processes on earth. Climate and weather information provide a basis for understanding what we see happening in other park vital signs.
An aridity index can be useful for contrasting the climate of national parks and help answer the question, “How dry is dry?” Used globally to classify climate zones, aridity indices are used to compare long-term average annual precipitation relative to the average annual potential evapotranspiration. The climate of Chiricahua NM and Coronado NMem is classified as semi-arid. Fort Bowie NHS is likely also semi-arid.
Methods
Weather is monitored at eight stations at high and low elevations across Chiricahua NM, Coronado NMem, and Fort Bowie NHS. They include two National Oceanic and Atmospheric Administration (NOAA) Cooperative Observer Program (COOP) stations, a Remote Automated Weather Station (RAWS), three Davis stations, and two U.S. Department of Agriculture (USDA) rain gages. Data from all eight stations were obtained from the Climate Analyzer.
Recent findings (Water Year 2019)
Overall annual precipitation at Chiricahua NM and Coronado NMem in WY2019 was approximately the same as the normals for 1981–2010. (The weather station at Fort Bowie NHS had missing values on 275 days, so data were not presented for that park.) Fall and winter rains were greater than normal. The monsoon season was generally weaker than normal, but storm events related to Hurricane Lorena led to increased late-season rain in September. The five-year moving mean of annual precipitation showed both park units were experiencing a minor multi-year precipitation deficit relative to the 30-year average.
Mean monthly maximum temperatures were generally cooler than normal at Chiricahua, whereas mean monthly minimum temperatures were warmer than normal. Temperatures at Coronado were more variable relative to normal. The reconnaissance drought index (RDI) indicated that Chiricahua NM was slightly wetter than normal. (The WY2019 RDI could not be calculated for Coronado NMem due to missing data.)


Groundwater
Background
Groundwater is one of the most critical natural resources of the American Southwest. It provides drinking water, irrigates crops, and sustains rivers, streams, and springs throughout the region. Groundwater is closely linked to long-term precipitation and surface waters, as ephemeral flows sink below ground to reappear months, years, or even centuries later as perennial and intermittent streams and springs. Groundwater also sustains vegetation and is the primary source of water for almost all humans in the southwestern U.S. Groundwater therefore interacts either directly or indirectly with all key ecosystem features of the arid Sonoran Desert ecoregion.
Methods
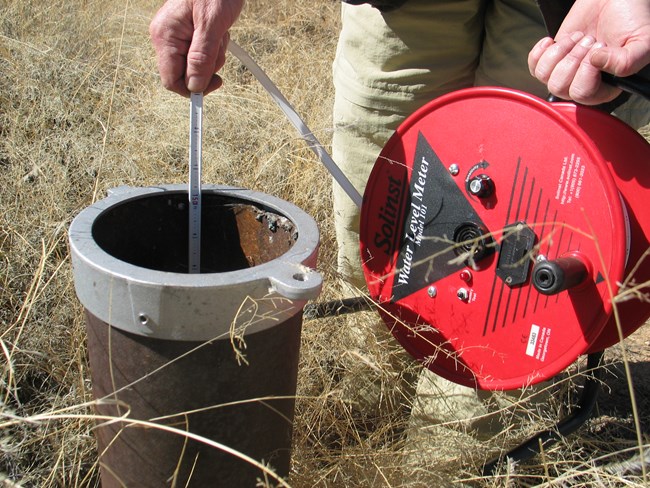
Groundwater is regularly monitored at 10 wells of the Southeast Arizona group: three at Chiricahua, six at Coronado, and one at Fort Bowie. A combination of automated and manual measurements are used.
Recent findings (Water Year 2019)
Mean groundwater levels in WY2019 increased at Fort Bowie NHS, and at two of three wells monitored at Chiricahua NM, compared to WY2018. Levels in the third well at Chiricahua slightly decreased. By contrast, water levels declined in five of six wells at Coronado NMem over the same period, with the sixth well showing a slight increase over WY2018.
Over the monitoring record (2007–present), groundwater levels at Chiricahua have been fairly stable, with seasonal variability likely caused by transpiration losses and recharge from runoff events in Bonita Creek. At Fort Bowie’s WSW-2, mean groundwater level was also relatively stable from 2004 to 2019, excluding temporary drops due to routine pumping. At Coronado, four of the six wells demonstrated increases (+0.30 to 11.65 ft) in water level compared to the earliest available measurements. Only WSW-2 and Baumkirchner #3 have shown net declines (-17.31 and -3.80 feet, respectively) at that park.
| Park | Well | Mean elevation (feet amsl), WY2019A | Mean depth-to-water (ft bgs)B | Difference in mean depth-to-water (+/- feet) from WY2018C | Net difference (+/- feet) in mean depth-to-water from earliest water-level measurement (Year)C | Minimum feet bgs depth-to-water for monitoring record (Year) | Maximum feet bgs depth-to-water for monitoring record (Year) |
|---|---|---|---|---|---|---|---|
| CHIR | Campground-1 | 5,313.86 | 26.64 | +0.28 | +2.93 (2007) | 22.96 (2010) | 29.83 (2012) |
| CHIR | Headquarters | 5,245.55 | 10.45 | -0.39 | +1.09 (2007) | 7.44 (2017) | 12.82 (2012) |
| CHIR | Faraway Ranch | 5,201.88 | 14.15 | +2.05 | +2.82 (2007) | 10.18 (2010) | 17.82 (2009) |
| CORO | WSW-2 | 5,243.46 | 211.28 | -4.69 | -17.31 (2008) | 193.97 (2008) | 321.69 (2010; pumping) |
| CORO | Headquarters | 5,239.86 | 32.35 | -5.43 | +11.65 (1959) | 1.29 (2007) | 44.54 (2004) |
| CORO | Baumkirchner #3 | 5,066.33 | 33.67 | -0.11 | -3.80 (1998) | 29.87 (1998) | 36.71 (2006) |
| CORO | X-2 | 4,881.54 | 148.01 | +0.27 | +0.30 (2002) | 146.31 (2004) | 149.83 (2010) |
| CORO | ACA-2 | 4,734.78 | 251.82 | -10.39 | -1.82 (1985) | 222.17 (2009) | 291.12 (2005) |
| CORO | Border | 4,316.54 | 623.46 | -0.02 | +1.44 (1975) | 621.85 (2014) | 624.90 (1975) |
| FOBO | WSW-2 | 4,545.35 | 56.40 | 0.58 | 3.17 (2004) | 50.92 (2006) | 92.31 (2007) |

Springs
Background
Springs, seeps, and tinajas are small, relatively rare biodiversity hotspots in arid lands. They are the primary connection between groundwater and surface water, and are important water sources for park plants and animals. For springs, the most important questions we ask are about persistence (How long was there water in the spring?), and water quantity (How much water was in the spring?).
Climate change is an emerging impact on springs in the American Southwest. Anticipated changes include increased air temperatures, evaporation rates, and drought intensity; more frequent and extreme rainfall and heat events; and potentially reduced precipitation in the winter and spring. These changes may cause springs to experience reduced flow or even go dry, which may disrupt ecological functions, reduce species diversity, and negatively impact visitor experience.
Methods
The Sonoran Desert Network monitors a suite of vital signs and parameters organized into four modules: site characterization, site condition, water quantity, and water quality. Data for the site-condition, water-quantity, and water-quality modules are collected annually, except for the persistence parameter (within the water-quantity module). Data on this parameter span the entire water year when possible. Data for the site-characterization module are collected every five years.
Recent findings (Water Year 2019)
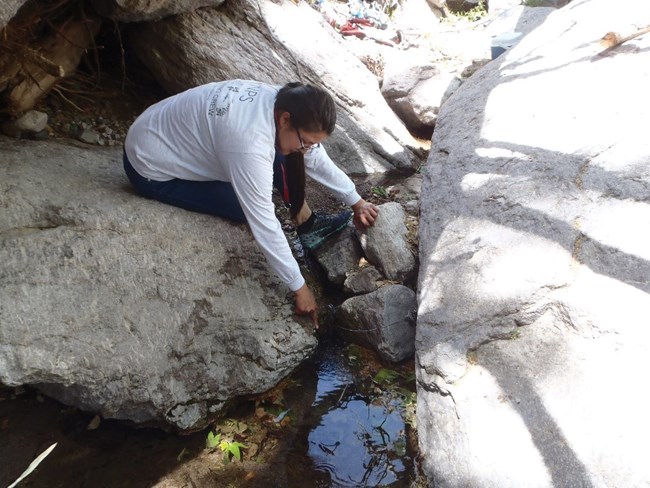
Springs were monitored at nine sites in WY2019 (four sites at Chiricahua NM; three at Coronado NMem, and two at Fort Bowie NHS). Most springs had relatively few indications of anthropogenic or natural disturbance. Anthropogenic disturbance included modifications to flow, such as dams, berms, or spring boxes. Examples of natural disturbance included game trails, scat, or evidence of flooding.
Crews observed 0–6 facultative/obligate wetland plant taxa and 0–3 invasive non-native species at each spring. Across the springs, crews observed six non-native plant species: common mullein (Verbascum thapsus), spiny sowthistle (Sonchus asper), common sowthistle (Sonchus oleraceus), Lehmann lovegrass (Eragrostis lehmanniana), rabbitsfoot grass (Polypogon monspeliensis), and red brome (Bromus rubens).
It is likely that that all nine springs had surface water for at least some part of WY2019, though temperature sensors failed at two sites (see figure below). The seven sites with continuous sensor data had water present for most of the year. Discharge was measured at eight sites and ranged from <1 L/minute to 16.5 L/minute. Baseline data on water quality and water chemistry were collected at all nine sites.

Information in this article was summarized from Status of Climate and Water Resources at Chiricahua National Monument, Coronado National Memorial, and Fort Bowie National Historic Site: Water Year 2019, by K. Raymond, L. Palacios, J. A. Hubbard, C. L. McIntyre, and E. L. Gwilliam (2022).
