Last updated: August 8, 2025
Article
Acadia Air Quality
What's in the Air?
Did you know that even in Acadia National Park, gasses and tiny particles pollute the air? These pollutants affect rain and snow, forests and streams, and plants, wildlife, and human health.
Whether you are visiting Acadia or viewing realtime webcam footage below, you may notice how much air quality can change day by day. What does this mean, why does it happen, and how does it affect us? It’s important to learn about air pollutants so that we can do something to make a difference.


NPS Photo
Ozone
What is ozone?
O₃ is the chemical symbol for ozone, an unstable and highly reactive form of oxygen.
Ozone occurs in two different layers of the atmosphere and can be good or bad depending on its location. Naturally occurring ozone in the upper atmosphere, the “good ozone”, is what we call “the ozone layer” which protects life on earth by absorbing the sun’s harmful ultraviolet rays.
In the lower atmosphere, ozone is an air pollutant. This “bad ozone” forms when nitrogen oxides from vehicles, power plants, and other sources combine with volatile organic compounds (VOCs) from gasoline, solvents, and vegetation in the presence of sunlight.

NPS Photo
What does Ozone do?
Ozone is an oxidizer.
Ozone burns plant and animal tissue. At ground level, where living things can be surrounded by it, ozone can harm people and ecosystems.

Ozone affects your lungs
Breathing ozone causes lung irritation; especially in sensitive groups of people like active adults and children, asthma sufferers, the elderly, and groups with respiratory conditions.
National Park Service air quality specialists notify visitors and employees about unhealthy ozone levels through public health advisories.


Ozone affects plants
Ozone causes more damage to plants than any other air pollutant. When plants “breathe” ozone, it reduces photosynthesis, plant growth, and reproduction. The type and severity of ozone injury depends on how long plants are exposed and how high the level is.
When plants are exposed to even moderate ozone concentrations for a long time they are more susceptible to injury from fungus, insects, and diseases, as well as environmental stressors like weather and climate change.

How do we measure it?
Scientists from the National Park Service and the Maine Department of Environmental Protection have been monitoring ozone in Acadia National Park since the early 1980s.
Recent data shows that ozone levels in the park are moderate and stable. However, park ozone levels can rise to unhealthy levels when winds bring in pollution from large urban industrial areas in states to the south and west.
More on measuring ozone


Acid Rain
What is acid rain?
Acid rain is part of a larger process called acid deposition. Sulfur and nitrogen emitted from industrial sources undergo chemical changes in the atmosphere and become acidic compounds that can be carried hundreds of miles by the wind.
Acid deposition occurs when these compounds eventually fall to earth. Depending on the weather, this can happen as wet deposition (rain, snow, cloud, fog) or dry deposition (dry particles, gases).

What does acid rain do?
Everything in nature is connected. Even small changes in acidity can impact sensitive environments. Research shows that acid deposition can lead to poor water quality, decline in animal habitat, and changes in soil chemistry and plant communities.
Thin soils, steep slopes, and lack of natural buffers make lakes and streams in Acadia National Park particularly sensitive to acid deposition.

How do we measure it?
Acadia National Park is one of the more than 200 sites nationwide that participates in the National Atmospheric Deposition Program (NADP).
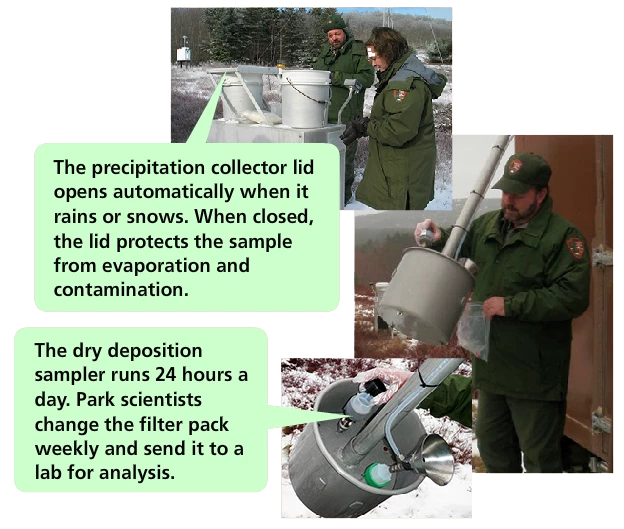
An automated precipitation collector measures wet deposition by sampling the rain and snow that falls on the park each week. Park air quality specialists send these samples to the NADP lab for analysis. The sample is tested for acidity and chemical composition. Results show the type and amount of pollutants in the precipitation and how much pollution is deposited on the landscape.
Park scientists also measure dry deposition. A filter pack captures dry pollutants from the air that continuously flows through the sampling equipment for an entire week! The filters are processed and analyzed by the CASTNet (Clean Air Status and Trends Network) program.
More on measuring nitrogen and sulfur

Mercury
What is Mercury?
Mercury is a naturally occurring element found in the air, water, and soil. You might think of mercury as a silvery, liquid metal in thermometers, but most of the mercury that affects Acadia National Park comes from burning fossil fuels in power plants and other industrial sources.
These sources release mercury into the atmosphere as tiny particles and gases which can travel long distances-- even across oceans!
It settles to the ground falling in rain and snow or landing as dust particles.
What does mercury do?
Bio-mag-nif-i-WHAT?
In the environment, mercury changes to a more toxic form called methylmercury. Methylmercury builds up in organisms, harming reproduction and neurological development.
Top-level predators like large fish, eagles, or even humans can have up to a million times more mercury than the lake or stream water in which they live or hunt. This is called biomagnification.
Eating fish is the main way that people get too much mercury. Maine, like many other states, issues fish consumption advisories in order to protect human health.

How do we measure it?
Acadia National Park was one of the original sites in the Mercury Deposition Network (MDN) when it began in 1996. The MDN measures mercury concentrations in any rain and snow that falls on the park each week. Mercury levels in Acadia National Park can be compared to levels in over 100 MDN sites across the country.
More on measuring mercury
Researchers also study the effects of mercury on park ecosystems to find out how much of this toxic substance is in the wildlife of Acadia National Park, including fish, birds, amphibians, and dragonfly larvae.
Since 2009, a nationwide citizen scientist program called the Dragonfly Mercury Project has allowed volunteers of all ages and backgrounds collect dragonfly larva to be tested for mercury analysis. Read more about the Dragonfly Mercury Project.

Particles
What is particle pollution?
Particle pollution is a mix of microscopic solid and liquid particles. Also known as particulate matter, these pollutants come from car and truck exhaust, industrial emissions such as coal fired power plants, dust, smoke, and lots of other sources. Fine particle pollution can occur year-round and is the main ingredient of haze.
Particle pollution is put in one of two categories depending on their size. Fine particles (PM2.5) are less than 2.5 microns, so small that they can only be seen with a microscope. Coarse particles (PM10) are larger, between 2.5 and 10 microns, less than the diameter of a human hair. A person breathes about 20,000 liters of air each day. The more polluted the air is, the more we breathe particles into our lungs!

U.S. EPA
Oh say can you see?
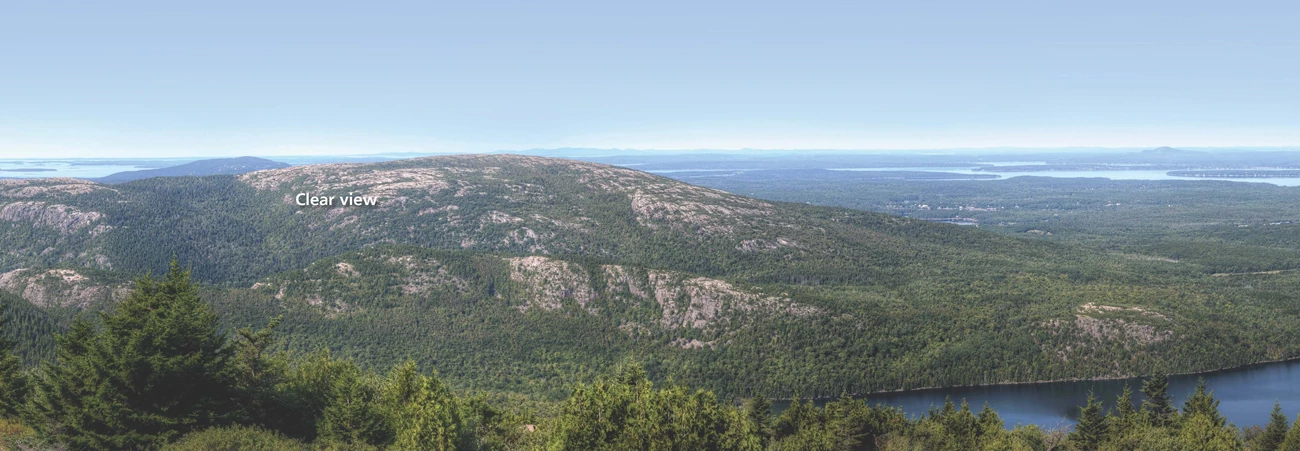
Many visitors come to Acadia National Park to enjoy the spectacular views. Unfortunately, these views can be obscured by natural fog and clouds, or by human-caused haze, which can impact both how far we can see and the clarity of the colors, forms, and textures of a scenic vista. Haze is composed mostly of particles suspended in the air that absorb and scatter sunlight. These particles expand when they absorb water making it even harder to see on humid days.
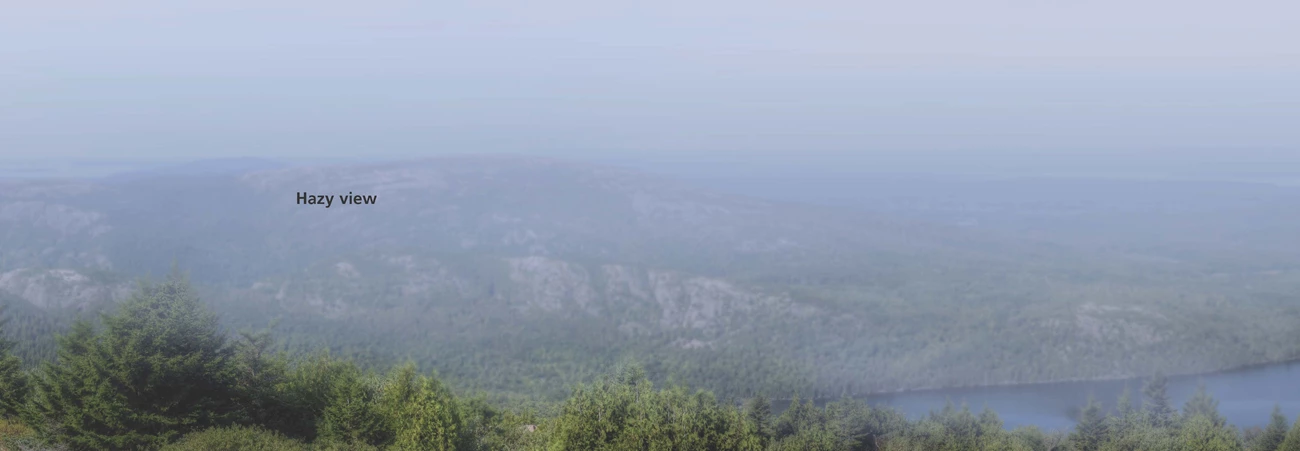
Left image
Hazy View
Credit: NPS Photo
Right image
Clear View
Credit: NPS Photo

Particle pollution affects health
The size of particles is directly linked to their potential to cause health problems. Very small particles pose the greatest problems because they can get embedded deep into lungs and some may even get into the bloodstream. This can affect both lung and heart functions.

How do we measure it?
Acadia National Park monitors visibility conditions and the fine particles that affect those conditions and human health as part of the IMPROVE (Interagency Monitoring of Protected Visual Environments) program.
A particle sampler traps both large and small particles on specialized filters. Samples are analyzed to tell us what types and what concentrations of particles are in the air.
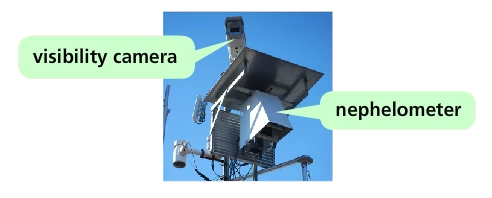
The nephelometer (nef-ul-Àh-me-ter) measures the amount of light scattered by particles in the air. This scattering degrades visibility.
A web camera takes a picture every 15 minutes, recording how well you can see and keeping a record of conditions.
More on measuring visibility
View realtime webcam footage
View life data
Where does it come from?
Acadia National Park is downwind from large urban and industrial areas in states to the south and west. Polluted air is carried hundreds of miles by wind currents into the heart of the park. Higher levels of pollution usually occur when winds are from the southwest while cleaner air is seen when winds are from the north.
The park's steep slopes and high peaks can trap polluted air allowing it to accumulate for days at a time before it is blown away. The highest pollution days usually occur between June and August.
To learn more about how pollution at Acadia has changed throughout the years, visit Acadia's Air Quality Conditions & Trends.
Access further information on air quality research at Acadia's Air Profile.

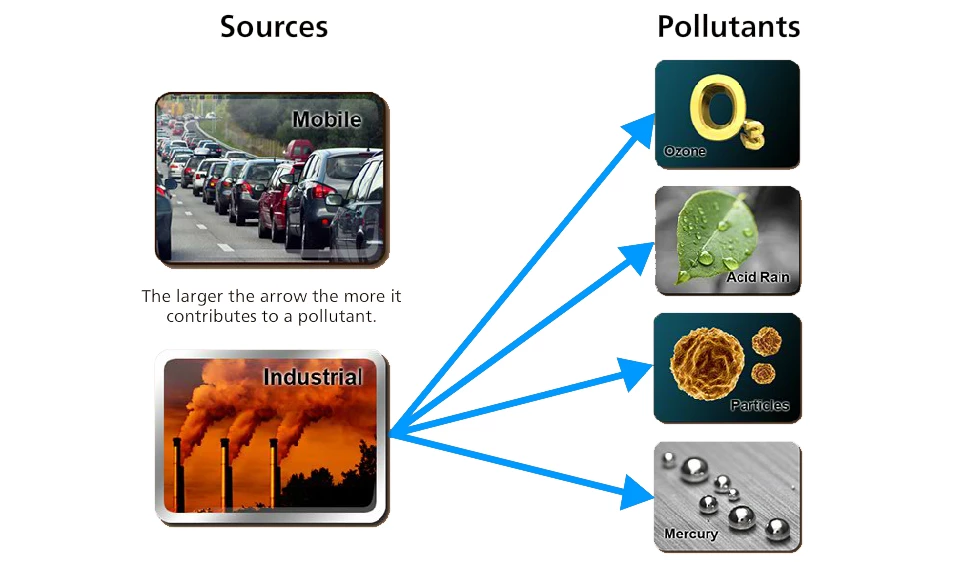
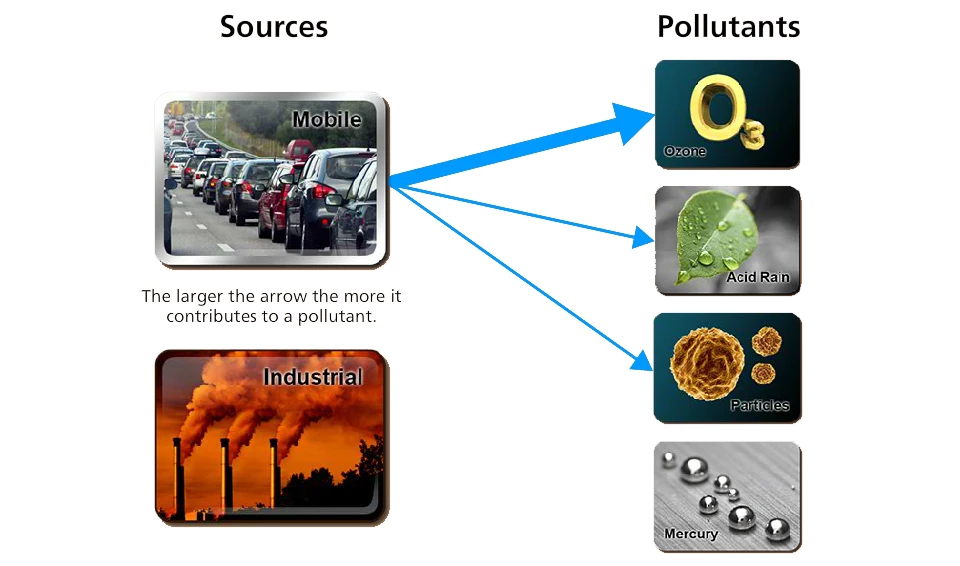
At Acadia National Park, multiple sources of pollution contribute to the problem. Natural processes can affect air quality, including wildfires that produce smoke and carbon monoxide. Cattle and other animals emit methane as part of their digestive process, and even trees emit VOCs (volatile organic compounds).
Most of the pollutants that affect Acadia’s resources come from human sources that burn fossil fuels such as coal, oil, and natural gas. Industrial facilities, cars, trucks, ships, planes, and construction equipment all depend on the burning of fossil fuel. Although their emissions vary by region, power plants rank among the worst polluters, particularly in the eastern half of the country.
What can I do?
You CAN make a difference!
Because Acadia National Park is not completely isolated from the outside world, there is plenty you can do to help protect park resources from pollution during your visit to the park AND when you are at home.
Do you want to be a part of science in national parks? Are you curious about insects, air pollution, or what lives underwater? If so, get involved in the Dragonfly Mercury Project!
The Dragonfly Mercury Project (DMP) is a nationwide study that works with citizen scientists and community volunteers to collect dragonfly larvae for mercury analysis. Mercury is a global pollutant that, in large amounts, can be toxic to humans and wildlife. The data from this field study help scientists and resource managers better understand and fight mercury contamination. Since 2009, over 6,000 volunteers have helped collect dragonfly larvae at more than 140 parks and other protected areas across the U.S. The DMP is now the nation's largest assessment of mercury contamination and environmental risk.
Learning doesn't have to stop here. Access more information below:
- Acadia's Park Air Profile - In-depth sourced information about Acadia's air quality.
- Air Quality Conditions & Trends at Acadia - Research pollutants and changes in air quality throughout the years.
- Air Quality in the Parks - Acadia isn't the only park whose air quality is being monitored. Learn about how parks across the nation are working towards cleaner air.
While visiting the park, use the provided receptacles to discard your trash and recycle plastics, aluminum, and glass. From 2001 to 2005, the park recycled an average of more than 18 tons per year!
While visiting the park, join the millions of visitors who have already reduced pollution by riding the free Island Explorer shuttle. These buses are powered by clean-burning propane that produces fewer greenhouse gases and smog-causing pollutants!
Water, especially hot water, conservation saves energy and money. Make smart water use choices, like not letting the water run while brushing your teeth, running the dishwasher only when full, and taking shorter showers.
Energy production from fossil fuels also produces air pollution. Conserve energy by turning off lights and electrical appliances when not in use and use more energy efficient products.
Reduce, Reuse, Recycle - it cuts energy use and saves money.
Support alternative energy, including wind and solar power. This will help reduce pollution created by energy production from fossil fuels.
Purchase mercury-free and other toxin-free products. Minimize use of household chemicals. Find safe and appropriate ways to dispose of the toxic products you already own.
Auto exhaust contributes to ozone pollution. Keep vehicles and engines properly maintained. Limit idling in traffic and turn your engine off when you can. Combine errands, and bike, walk, carpool, or use public transportation.