Part of a series of articles titled 2021 Preservation Planning Grants Highlights.
Article
2021 Preservation Planning Grant Year in Review

NPS Photo/Hannah Thomas
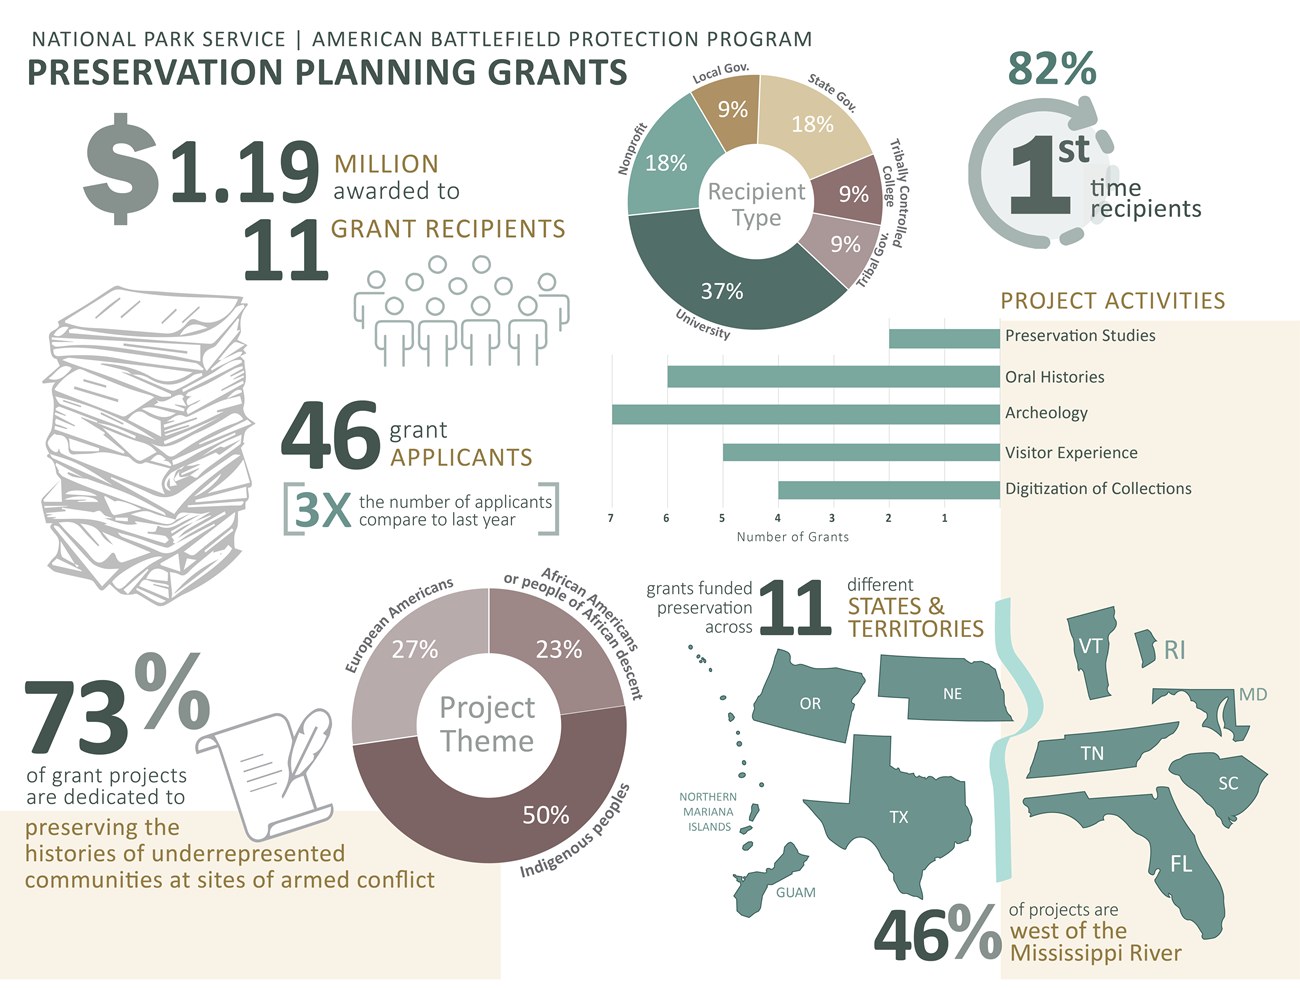
In 2021, ABPP awarded $1.19 million in Preservation Planning Grants (PPG) to 11 nonprofits. PPGs are an open invitation to state and local governments, tribes, and nonprofit organizations to compete for funds for a wide variety of projects at sites of conflict across US states and territories. Last year we hosted webinars and office hours to get the word out and received 46 applicants — doubling the rate of the previous two years. The overwhelming majority of the awards went to first-time recipients (82%) for projects preserving and interpreting histories of underserved communities (73%). Projects spanned activities from preservation studies, to oral histories, archeological work, visitor experience projects and digitization of historic collections.
Armed conflict is interwoven throughout American history, has shaped the territory and landscapes of the United States, and continues to shape our shared experiences and collective memories. It’s no small irony that sites of conflict can bring us together. With all our efforts, our goal remains to sustain the stories and living landscapes that weave together our collective well-being and resilience.
NPS ABPP Preservation Planning Grants (PPG) stats from 2021. ABPP awarded $1.19 million to 11 grant recipients. 82% of them were first time recipients. There were 46 grant applicants, three times the number of applicants compared to the last year.
Donut graphs shows recipients: “37% were universities; 18% nonprofits; 18% state governments; Local governments, Tribally controlled colleges, and Tribal governments were each 9% of recipients.”
Bar graph shows project activities: “2 preservation studies, 6 oral histories, 7 archeology projects, 5 visitor experience projects, 4 digitization projects.”
Donut graph shows project themes: "50% projects focused on indigenous peoples, 24% on European Americans + 23% on African Americans or people of African descent.”
Graphic of state outlines floating on either side of Mississippi River illustrates that “46% of projects were west of Mississippi River.” To right of river: Vermont, Rhode Island, Maryland, Tennessee, South Carolina, Florida. To left: Oregon, Guam, Nebraska, Texas, Northern Mariana Islands.
Last updated: June 10, 2022
