Part of a series of articles titled Weather & Climate.
Article
2020 Weather in Review: Sagamore Hill National Historic Site

NPS/Baranowski
Weather and climate play significant roles in driving both physical and ecological processes. For example, the active processes that shape the North Atlantic coastline are largely the result of meteorological events such as wind-driven waves. For research and long-term ecological monitoring, weather and climate data provide the potential for correlations to be made with observed physical and ecological pattern data.
This resource brief provides a summary of both historic and current (2020) weather data for Sagamore Hill National Historic Site (SAHI), New York (NY). Information in this brief represents county-scale weather data averaged from the county surrounding the park, Nassau County, NY. Because tide levels and wind can be significant for coastal parks, the annual water level and wind data are included. Individual weather station data may vary from what is reported here. Data are available from the National Climate Data Center.
Temperature
Overall, 2020 was the 3rd warmest year on record with an average temperature of 55.9 °F — 3.6 degrees above average (Figure 1). Spring fell within “near normal” temperatures, while summer, autumn, and winter seasons fell within “much above normal” temperatures. 2020 had the 2nd warmest winter on record. The warmest month was July with an average of 79 degrees — 4.7 °F above the monthly average (Table 1).

| Month (2020) | Average temperature (°F) | Departure from long-term average temperature (°F) |
| January | 38.2 | +7.3 |
| February | 38.9 | +7.5 |
| March | 46.2 | +7.0 |
| April | 48.2 | -0.9 |
| May | 58.2 | -1.2 |
| June | 71.8 | +3.1 |
| July | 79.0 | +4.7 |
| August | 76.1 | +3.3 |
| September | 67.8 | +1.6 |
| October | 57.5 | +2.0 |
| November | 50.8 | +5.9 |
| December | 38.4 | +3.4 |
| Annual | 55.9 | +3.6 |
Precipitation
Overall, 2020 was the 78th wettest year on record with a total of 42.08 inches of precipitation and fell within a “near normal” level (Figure 2, Table 2). Seasonally, winter and spring fell within “below normal” levels, while autumn and summer reached “above normal” levels. Eight months had below average precipitation amounts. October had the greatest amount of precipitation in 2020 at 4.88 inches, while May had the lowest amount at 1.45 inches — 2.35 inches below average.
| Month (2020) | Total precipitation (in) | Departure from long-term average precipitation (in) |
|---|---|---|
| January | 1.83 | -1.60 |
| February | 2.97 | -0.29 |
| March | 3.82 | -0.31 |
| April | 3.80 | -0.04 |
| May | 1.45 | -2.35 |
| June | 2.43 | -1.19 |
| July | 5.10 | +1.12 |
| August | 3.30 | -0.86 |
| September | 4.05 | +0.37 |
| October | 4.88 | +1.27 |
| November | 4.69 | +1.12 |
| December | 3.76 | -0.04 |
| Annual | 42.08 | -2.76 |
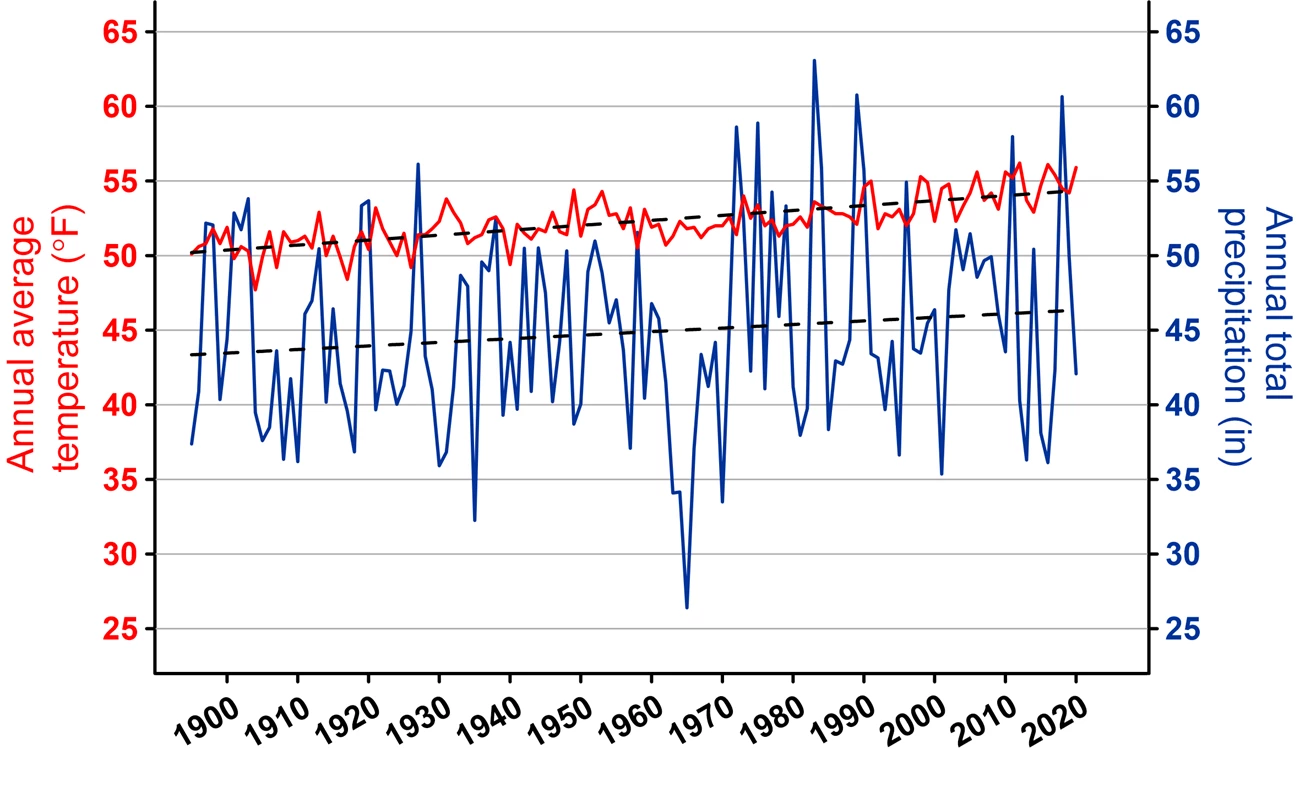
Temperature and Precipitation Trends (1895–2020)
Temperature and precipitation data are gathered from the U.S. Climate Divisional Database, which stores data from January 1895 to the present, and can be accessed via the National Oceanic and Atmospheric Administration’s (NOAA) National Centers for Environmental Information (NCEI) website (Figure 3). Users can choose different geographic scales (i.e., global, national, statewide), different temporal scales, and display them in various types of graphical formats. Temperature and precipitation data presented in this brief are for Nassau County, NY.
Wind
Wind data (wind speed and direction ) is collected from the NOAA National Water Level Observation Network (NWLON) station 8516945, Kings Point, NY. Each direction is divided up into categories called bins that are color coated to represent the frequency of a certain wind speed. The length of the bin represents the number of times wind comes from a given direction as well as the speed of the wind. The longer the length of the bin, the more frequent the given speed was recorded (Figure 4).

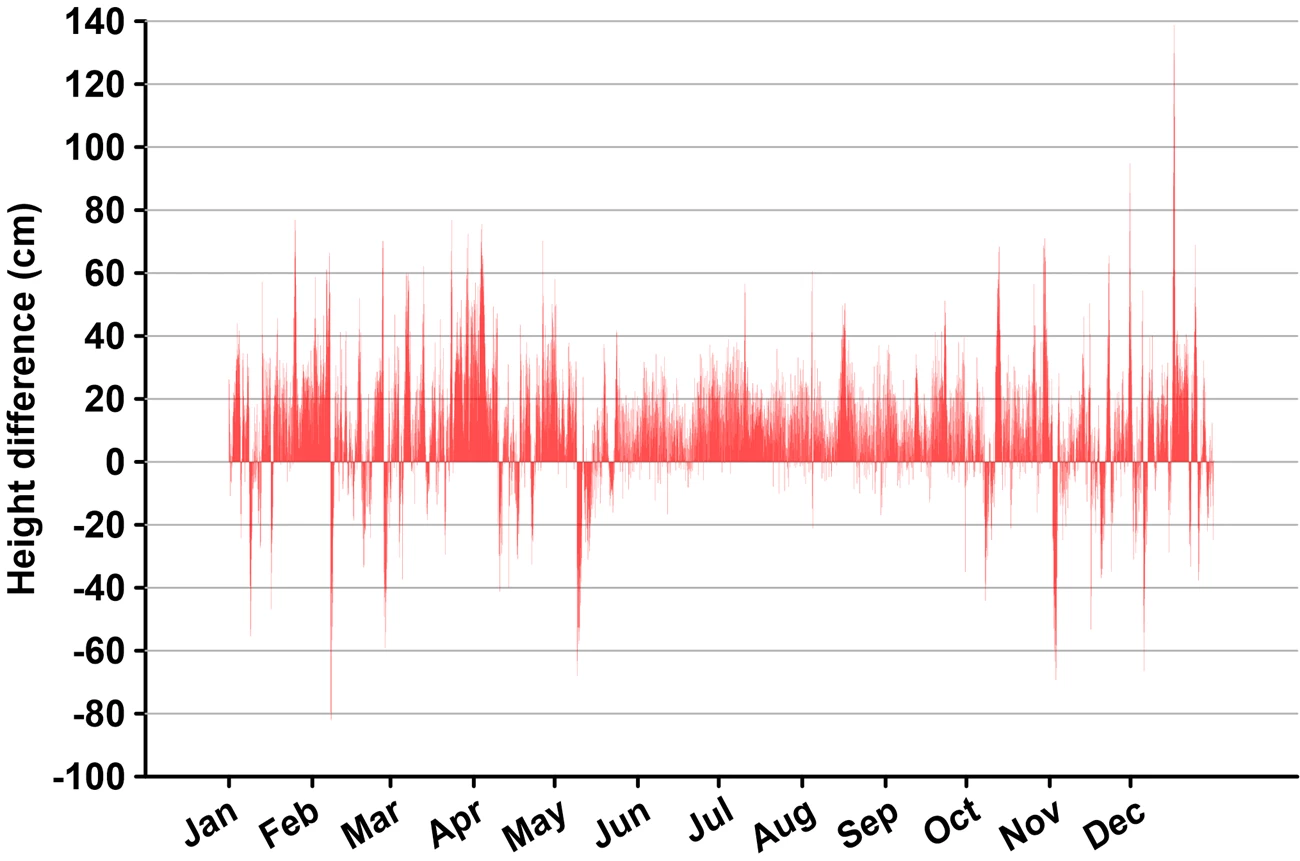
Tide Levels
Water level data is also collected from the NOAA NWLON station 8516945 on the sheltered northwest side of Long Island, NY. Located at Kings Point, this station has records dating back to 1998.
The data is graphed to show the difference in the predicted tide level verses what was observed (Figure 5). The offsets in height reflect the effect from storm surge on the normal, astronomically driven tide level.
Last updated: March 24, 2021