Last updated: April 1, 2020
Lesson Plan
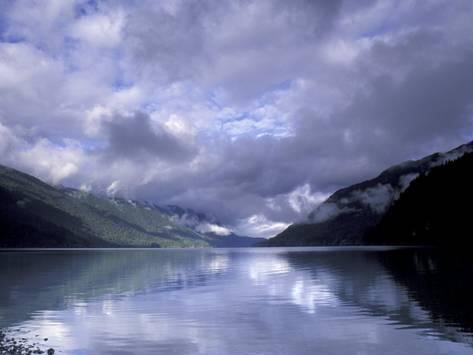
Where Would You Rather Be? Comparing weather conditions in Olympic National Park’s Lake Crescent to those in your community.

- Grade Level:
- Upper Elementary: Third Grade through Fifth Grade
- Subject:
- Math,Science
- Lesson Duration:
- 90 Minutes
- Common Core Standards:
- 3.MD.4
- State Standards:
- NGSS: 3-ESS2-1 Represent data in tables and graphical displays to describe typical weather conditions expected during a particular season.
- Thinking Skills:
- Analyzing: Break down a concept or idea into parts and show the relationships among the parts. Creating: Bring together parts (elements, compounds) of knowledge to form a whole and build relationships for NEW situations.
Essential Question
How does the weather where you live compare to that of the Olympic National Park?
Objective
To understand how to collect data on weather patterns in different places and determine comparisons or contrasts.
Background
“Weather”…online article from Scholastic, https://www.scholastic.com/teachers/articles/teaching-content/weather/ (accessed 8/102017)
“What is the difference between weather and climate”… online article from NOAA, https://oceanservice.noaa.gov/facts/weather_climate.html (accessed 8/102017)
For an accurate comparison of weather conditions, it is suggested that your students observe and record data on local and Lake Crescent weather conditions at the same time each day of the lesson. Additionally, look at local weather conditions from the same area every time.
Preparation
Lesson can either go for 10 straight school days, or once a week for 10 weeks.
Materials:
For younger grades (3rd/4th) - large poster sized graph paper for graphs and for data tables.
For older grades (4th/5th - individual letter-sized graph paper and weather condition date tables (attached to this lesson plan).
Computer(s) with internet access.
Websites:
NPS Lake Crescent Weather Cam,
https://www.nps.gov/subjects/air/webcams.htm?site=olym
For local weather in your community, a simple Google search for: Weather "Your City", will pull up a quick glimpse at the weather, including temperature, precipitation and wind.
Materials
Download Weather Conditions Tables and Charts
Lesson Hook/Preview
What's the Weather Like Today | Weather Song for Kids | The Kiboomers (2:02 min long),
A Weather Song- fun to sing before each weather condition data collection time.
The Weather Song
(sung to tune “Clementine”)
What’s the weather?
What’s the weather?
What’s the weather like today?
Tell us (child’s name)
What’s the weather?
What’s the weather like today?
Is it sunny?
(hold hands above head in a circle)
Is it cloudy?
(cover eyes with hands)
Is it rainy out today?
(flutter fingers downward)
Is it snowy?
(wrap arms around the body and shiver)
Is it windy?
(“blow children over with a swoop of your arms)
What’s the weather like today?
I also encourage you to get your students outside to experience the weather…in all conditions! Their appreciation and deep understanding will grow!
Procedure
Step 1: Introduce the idea of weather… have students share their ideas of “what is weather” in whatever format suits your classroom (discussion, turn and talk, writing, etc.) (Articles on “Weather” and “Difference between Weather and Climate” will support teacher knowledge.
Step 2: Play one of the two recommended YouTube videos on weather. Allow students to share their new/modified ideas about weather.
Step 3: Share the data table and talk through the different data measurements to collect (date, temperature, precipitation, wind and cloud cover). A discussion of units of measurement may help, too.
Step 4: Collect data on your local weather..by looking/going outside and through information available with a Google search. Talk through how to determine cloud cover…using a percentage range with 100% being sky fully covered by clouds.
Step 5: Go online to the Lake Crescent weather cam through the NPS website and collect data on current weather conditions.
Step 6: As a class or independently, begin graphing the data as a BAR GRAPH.
Step 7: Continue collecting weather condition data and graphing- either every day for 10 days or once a week for 10 weeks.
Step 8: At the end of the project, you could have students write a short (1-2 paragraph) report comparing the weather conditions of the two sites, or lead a class discussion comparing and contrasting weather conditions.
Vocabulary
- Data- facts about something that can be used in calculating, reasoning, or planning.
- Table- a way to organize data using rows and columns
- Percentage- a part of a whole expressed in hundredths
- Precipitation- a deposit on the earth of hail, mist, rain, sleet, or snow; also : the quantity of water deposited
- Compare- estimate, measure, or note the similarity or dissimilarity between.
- Weather Conditions- the atmospheric conditions that comprise the state of the atmosphere in terms of temperature and wind and clouds and precipitation
- Units of measurement- Fahrenheit (oF), Miles per Hour (mph)
Assessment Materials
Informal assessment of student understandingHaving students work in groups of 2-4 to collect data on local and Lake Crescent weather to share with class. Informally assess their understanding based upon their ability to correctly identify the different pieces of data needed and their ability to do so in a relatively accurate manner.
This lesson is intended as a whole group project with a different group of students collecting data each time. However, it is just as easily accomplished as a whole group activity each time, or independently
Supports for Struggling Learners
Have a group of 2-4 students collect weather data each time…for local and Lake Crescent sites. Pair students stronger in these concepts with those who are struggling so that they may support and encourage each other.
Enrichment Activities
Consider the extension question… what natural factors help in the formation of weather conditions in your community (mountains, bodies of water, etc.)? What natural factors lead to the formation of weather conditions in Olympic National Park?
Consider encouraging students to use online research to create a report or presentation to share with the class.
