Warming temperatures likely to alter visitation across the National Park System
Climate change will affect not only natural and cultural resources within national parks, but also visitation patterns. Where, when, and how many people visit parks is likely to change with continued warming. For example, visitors may avoid extremely warm months in low-latitude parks and the visitation season may extend across additional weeks to months at northern parks. Whether park visitors track climate change and shift their behavior will depend on multiple environmental and socioeconomic factors. However, understanding potential change in visitation based on historical trends and future patterns of temperature change is a crucial first step for park managers and local communities to anticipate, plan for, and proactively influence future visitation.
The National Park Service published research on the temperature-visitation relationship in 340 units of the U.S. national park system, from Guam, Hawai‘i, and Alaska to the contiguous 48 states and islands in the Caribbean. Researchers evaluated the historical relationship between long-term average monthly air temperature and visitation (1979-2013), and then modeled potential future visitation (2041-2060) based on two warming-climate scenarios and two visitation-growth scenarios.
The National Park Service published research on the temperature-visitation relationship in 340 units of the U.S. national park system, from Guam, Hawai‘i, and Alaska to the contiguous 48 states and islands in the Caribbean. Researchers evaluated the historical relationship between long-term average monthly air temperature and visitation (1979-2013), and then modeled potential future visitation (2041-2060) based on two warming-climate scenarios and two visitation-growth scenarios.
Open the panel below to download individual briefs for each park in this project, or continue reading for study highlights.
Source: NPS DataStore Collection 5503. To search for additional information, visit the NPS DataStore.
Study highlights
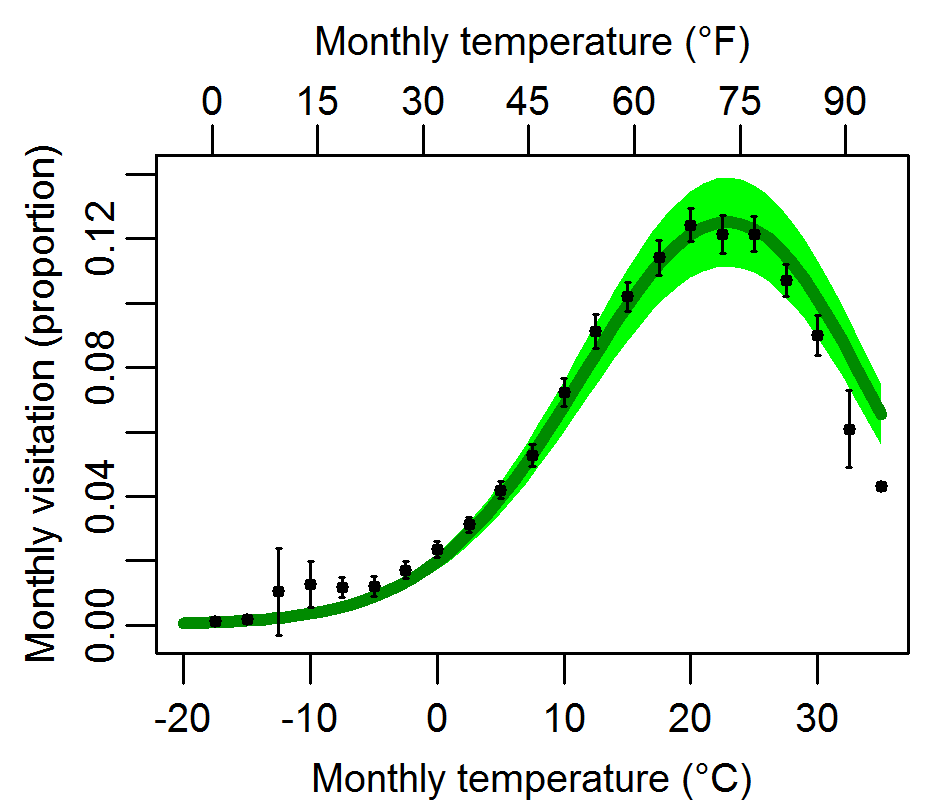
- Long-term historical monthly visitation across the National Park System is strongly tied to mean air temperatures
-
- 95% of parks show a significant relationship between visitation and air temperature
- 69% of the variation in visitation across the system is associated with air temperature
- Visitation increases with warming temperatures, but only up to a point; visitation declines as monthly average temperatures exceed roughly 80 °F
- Similar to other species, human visitors to parks are likely to alter their behavior in response to climate change
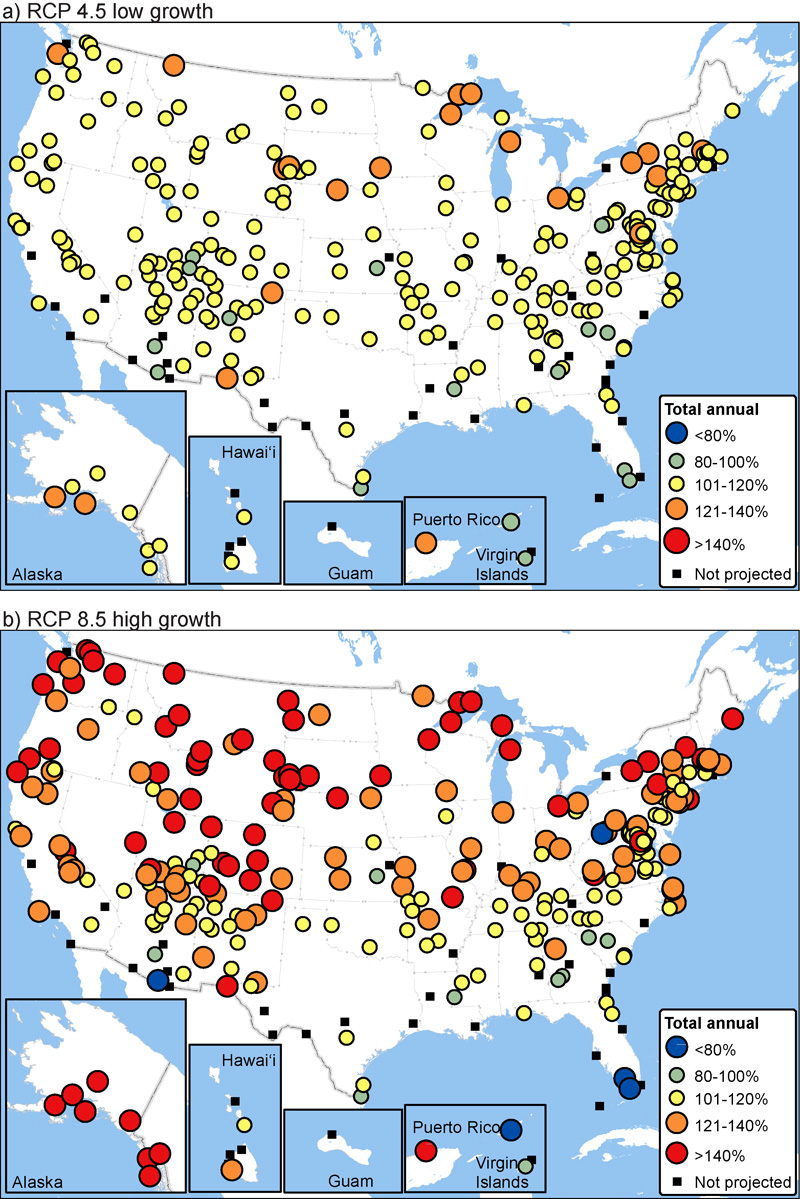
- Based on the historical relationship of air temperature and visitor use, the National Park System and most individual parks show increases in potential future (2041-2060) visitation with warming temperatures
-
- 8-23% increase in total annual visits across the park system
- 2-4 week expansion of the visitation season, on average, at individual parks
- Some parks with already very warm months are projected to see decreases in potential visitation and/or shifts in the timing of visitation to cooler months
- The coming decades are likely to see changes in climate and changes in visitor use patterns and preferences. Parks and surrounding communities will need to adapt to both the challenges and opportunities posed by changing visitation.
Additional resources
- Download the the project overview in a two-page PDF handout
- Read the original original journal article in PLOS One
Last updated: January 13, 2025