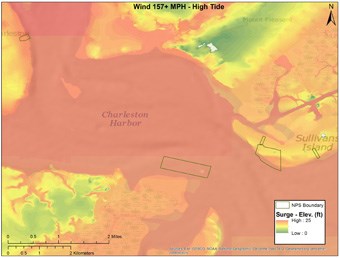
As part of an ongoing project between the National Park Service and the University of Colorado, a series of maps have been created to identify how 118 coastal parks will be impacted by changes in storm surge and sea level. These maps were created to illustrate how much of a park will be flooded if it was struck by a hurricane. The maps were generated using a sea, lake, and overland surge from hurricanes (SLOSH) model created by NOAA. Each map varies depending on the wind speed and the tide height during a storm. A dark green line in each map represents the park boundary within the area of study. The areas colored in green to red indicate the potential height of a storm surge. Areas in gray are the areas that are unlikely to be flooded by a storm surge.
View the Flickr gallery of storm surge maps.
Last updated: October 11, 2016
