This page summarizes model-based projections of changes in climate suitability by mid-century for birds across 274 natural resource national parks under two climate change scenarios (for more information regarding how climate suitability is characterized, see Langham et al. 2015). Results throughout this page focus primarily on the high-emissions pathway (RCP8.5) because it is the scenario most consistent with current greenhouse gas emissions rates; however, comparisons are made to results for the low-emissions pathway (RCP2.6) as a contrasting, best-case scenario for emissions reductions (see Methods).
This study focuses exclusively on changing climatic conditions for birds over time. But projected changes in climate suitability are not definitive predictions of future species ranges or abundances. Numerous other factors affect where species occur, including habitat quality, food abundance, species adaptability, and the availability of microclimates (see Caveats). Therefore, managers should consider changes in climate suitability alongside these other important influences.
Use the panels below to download project briefs for each park and learn more about this study.
Here you can download individual PDF briefs for each national park unit covered by this study.
Source: NPS DataStore Collection 8066. To search for additional information, visit the NPS DataStore.
Our analysis was based on a consistent set of North American data and encompassed 277 national parks in the continental U.S. that fall under the NPS Inventory and Monitoring Program’s natural resource park designation. A total of 274 national park management units remained after grouping together those parks that are typically managed as a single unit (i.e., Sequoia and Kings Canyon National Parks, and three park units that collectively constitute the Roosevelt-Vanderbilt National Historic Site). The studied parks spanned 25º to 68ºN latitude and 68º to 164ºW longitude, and represented seven NPS geographic regions, with the number of parks in each region reported in parentheses: Alaska (16), Pacific West (39), Intermountain (82), Midwest (36), Southeast (44), National Capital (18), and Northeast (39).
To understand how climate change may affect birds in national parks, we used a statistical model to compare current climate conditions to projected conditions for each species within each park. Projections of future climate suitability for each species were based on species distribution models for North American birds (Distler et al. 2015). Models of summer and winter distributions were trained on observations from the North American Breeding Bird Survey and Audubon Christmas Bird Count using 17 temperature and precipitation variables as predictors. These baseline (2000-2010) models were then used to project future climate suitability to 2041-2070 (hereafter, mid-century) under two greenhouse gas emissions trajectories. The high-emissions trajectory (RCP8.5) represents a future in which little action is taken to reduce global emissions of greenhouse gases. The low-emissions trajectory (RCP2.6) is a best-case scenario of aggressive efforts to reduce emissions. These emissions trajectories are globally standardized and established by the Intergovernmental Panel on Climate Change for projecting future climate change.
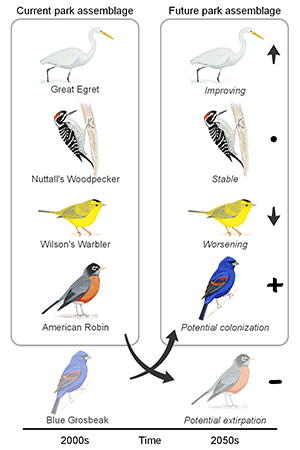
Climate suitability for each species was averaged over the area of each park for the present and mid-century. We fit a linear regression with climate suitability values (dependent variable) as a function of time. Based on the change in suitability over time, we classified climate suitability trends for 513 species across the parks as improving, worsening, stable, potential colonization, and potential extirpation (Figure 1). The latter two classes also incorporate whether a species’ modeled suitability crosses a minimum suitability threshold.
A species list for the present and future time periods was then generated for each park, assuming that climate conditions becoming suitable or unsuitable translate to realized colonization or extirpation. We treated parks as the unit of analysis, in some cases grouping parks into regions or analyzing trends by latitude. To quantify potential species turnover, we calculated the Bray-Curtis dissimilarity index within each park, season, and emissions trajectory. To understand how potential colonization and extirpation in individual parks compare with other parks in the system, we classified parks into relative trend groups based on the ratio of potential colonizations to extirpations in summer under RCP8.5 (Hole et al. 2011).
This project overview page mirrors model outputs from Wu et al. (2018) and provides system-wide comparison and conclusions. Briefs for individual park units, however, report trends based on additional park-level species occurrence filtering (using both NPS Inventory & Monitoring Program data and eBird observation data [2016]), and thus may differ.
Overall, parks may become increasingly important to birds in light of projected climate change because potential colonizations are projected to exceed potential extirpations in parks in both seasons. Analysis of 513 species (360 species in summer and 396 in winter) across the 274 parks finds that potential colonizations exceed potential extirpations in over 60% of parks under both emissions trajectories and seasons. In summer, climate is projected to become suitable for an average of 23 species (per park) not found in the park today, potentially resulting in local colonization. In contrast, suitable climate will cease to occur for 17 species per park in summer, potentially resulting in local extirpation. In winter, climate is projected to become suitable for an average of 42 species per park and will cease to occur for 10 species per park.
In both seasons, the contribution of introduced species (i.e., species not native to North America) to potential colonizations is relatively small (<3% of all species), perhaps because most introduced birds, being highly mobile, have realized their niche and/or are no longer expanding their range.
Parks are more likely to support additional species in winter than in summer. If all potential colonizations and extirpations were realized, the average park would have 29% more species in winter and 6% more species in summer. Although not directly evaluated in this study, more positive trends in winter may be a result of winter cold being more of a limiting physiological factor on species distributions than summer heat. Milder winters mean national parks are more likely to see an increase in species richness under a changing climate in winter than in summer.
Some of the potential winter colonizations are species currently found in parks only in summer that may increasingly find suitable climatic conditions in those parks year-round. Under the high-emissions trajectory, an average of seven additional species per park (8% of current summer species) might become present year-round. The species that might become year-round residents in the largest number of national parks are the Common Yellowthroat, Great Egret, and White-eyed Vireo.
Most bird species in parks are expected to experience change in climate suitability. Across parks, an average of 76% of species assessed showed a change in climate suitability (i.e., improving or worsening suitability, or potential colonization or extirpation).
The cumulative impact of potential colonizations and extirpations, if realized, would be a 23% change, on average, in a park’s bird assemblage between today and mid-century. This finding is based on an index of potential species turnover (i.e., the proportions of potential extirpations and potential colonizations by 2050, relative to today) calculated for each park.
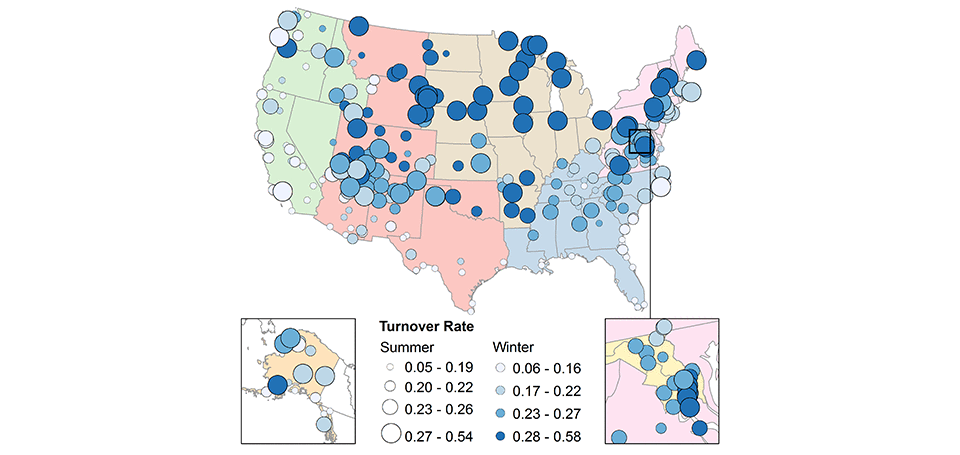
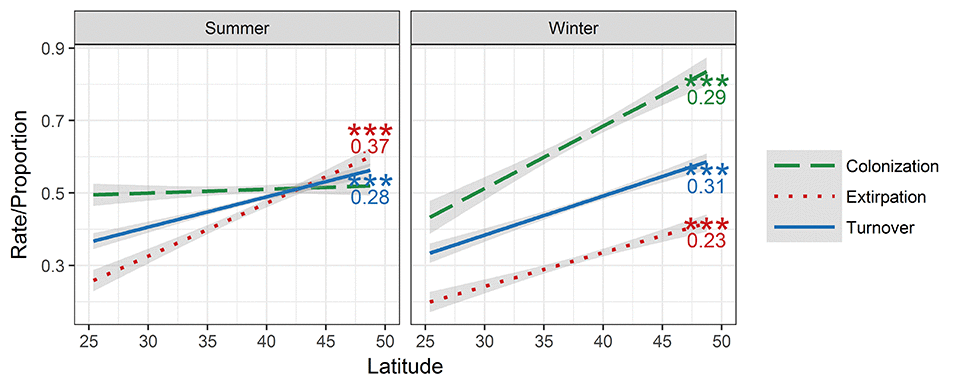
Potential change in bird communities is greatest in the Midwest and Northeast regions (Figure 2). The Midwest is also subject to substantial land use change, making these protected areas particularly important for birds and natural habitats. In the contiguous United States, parks at higher latitudes can expect to see higher rates of potential colonization, extirpation, and turnover (Figure 3).
Rates of change in bird assemblages in parks are less drastic with reduced emissions. Projected changes in potential colonization, extirpation, and species turnover are around 1.5 times higher under the high-emissions trajectory, although the same spatial patterns remain. Under the high-emissions trajectory in summer, 25% of parks have a quarter or more of currently occurring species in danger of extirpation, while only 8% do under the low-emissions trajectory.

Figure 2. Projected species turnover from the early 2000s to mid-century across seven NPS geographic regions and 274 U.S. national parks. Bray-Curtis turnover rates under the high-emissions trajectory are calculated under the assumption that all potential extirpations and colonizations are realized, with 0 being no change and 1 being complete turnover. Circle sizes represent rates in summer, and colors represent rates in winter. Breaks in classes are based on quartiles. Alaska is shown in the inset on the left and the National Capital region is shown in the inset on the right).

Figure 3. Relationships of the proportion of potential colonizations, extirpations, and turnover rate to latitude between the present and mid-century under RCP8.5 in summer and winter. Significance of the regression fit is denoted by *** where P < 0.001, and r2 values are shown next to each curve where significant.
In both seasons, the contribution of introduced species (i.e., species not native to North America) to potential colonizations is relatively small (<3% of all species), perhaps because most introduced birds, being highly mobile, have realized their niche and/or are no longer expanding their range.
Parks are more likely to support additional species in winter than in summer. If all potential colonizations and extirpations were realized, the average park would have 29% more species in winter and 6% more species in summer. Although not directly evaluated in this study, more positive trends in winter may be a result of winter cold being more of a limiting physiological factor on species distributions than summer heat. Milder winters mean national parks are more likely to see an increase in species richness under a changing climate in winter than in summer.
Some of the potential winter colonizations are species currently found in parks only in summer that may increasingly find suitable climatic conditions in those parks year-round. Under the high-emissions trajectory, an average of seven additional species per park (8% of current summer species) might become present year-round. The species that might become year-round residents in the largest number of national parks are the Common Yellowthroat, Great Egret, and White-eyed Vireo.
Most bird species in parks are expected to experience change in climate suitability. Across parks, an average of 76% of species assessed showed a change in climate suitability (i.e., improving or worsening suitability, or potential colonization or extirpation).
The cumulative impact of potential colonizations and extirpations, if realized, would be a 23% change, on average, in a park’s bird assemblage between today and mid-century. This finding is based on an index of potential species turnover (i.e., the proportions of potential extirpations and potential colonizations by 2050, relative to today) calculated for each park.
Potential change in bird communities is greatest in the Midwest and Northeast regions (Figure 2). The Midwest is also subject to substantial land use change, making these protected areas particularly important for birds and natural habitats. In the contiguous United States, parks at higher latitudes can expect to see higher rates of potential colonization, extirpation, and turnover (Figure 3).
Rates of change in bird assemblages in parks are less drastic with reduced emissions. Projected changes in potential colonization, extirpation, and species turnover are around 1.5 times higher under the high-emissions trajectory, although the same spatial patterns remain. Under the high-emissions trajectory in summer, 25% of parks have a quarter or more of currently occurring species in danger of extirpation, while only 8% do under the low-emissions trajectory.

Figure 2. Projected species turnover from the early 2000s to mid-century across seven NPS geographic regions and 274 U.S. national parks. Bray-Curtis turnover rates under the high-emissions trajectory are calculated under the assumption that all potential extirpations and colonizations are realized, with 0 being no change and 1 being complete turnover. Circle sizes represent rates in summer, and colors represent rates in winter. Breaks in classes are based on quartiles. Alaska is shown in the inset on the left and the National Capital region is shown in the inset on the right).

Figure 3. Relationships of the proportion of potential colonizations, extirpations, and turnover rate to latitude between the present and mid-century under RCP8.5 in summer and winter. Significance of the regression fit is denoted by *** where P < 0.001, and r2 values are shown next to each curve where significant.
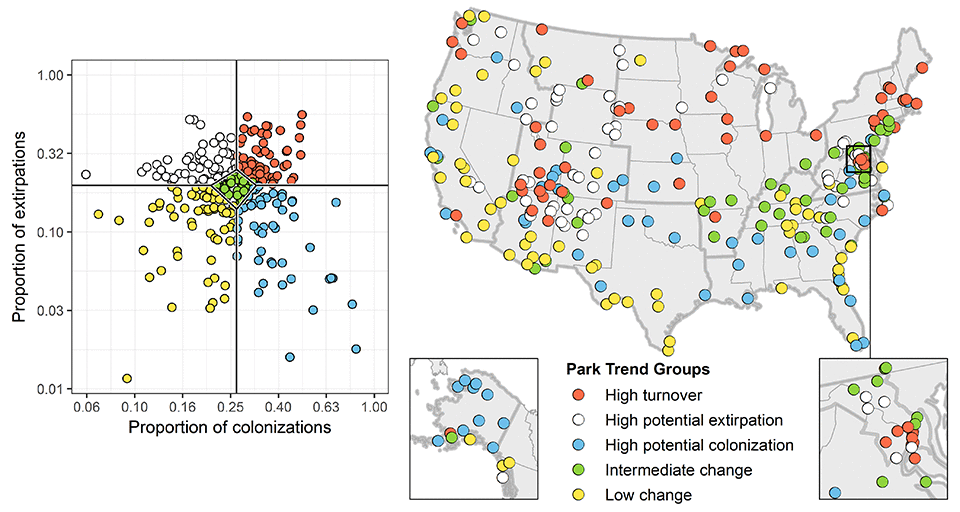
Parks differ in potential colonization and extirpation rates, and therefore different climate change adaptation strategies may apply. Understanding projected trends across parks can inform the management of individual park units for the benefit of the larger National Park System. Parks were classified into trend groups based on their proportions of potential colonizations and extirpations under the high-emissions trajectory in summer (Figure 4).
Parks that fall in the low and intermediate change groups can best support landscape-scale bird conservation by emphasizing habitat restoration, maintaining natural disturbance regimes, and reducing other stressors. Parks within one of the three high change groups (high turnover, high potential colonization, or high potential extirpation) can do so by focusing on actions that increase species' ability to respond to environmental change, such as increasing the amount of potential habitat, working with cooperating agencies and landowners to improve habitat connectivity for birds across boundaries, managing the disturbance regime (e.g., fire), and possibly more intensive management actions (e.g., intensive nest site management, translocations). Monitoring to identify changes in bird communities will inform selection of appropriate management responses.
Safeguarding the existing investment in conservation represented by the park system will require a forward-looking approach to natural resource management that explicitly recognizes the prospect of climate-driven ecological change beyond historical ranges of variability. Effective conservation in the face of climate change will also require landscape-level thinking (including consultation with regulatory bodies such as the U.S. Fish and Wildlife Service in cases of federally protected species). Such thinking would apply various approaches—resist, accommodate, or actively direct ecological change toward specific new desired conditions—and allow species to persist or track climate.
Figure 4. Classification of parks into trend groups based on the proportion of potential colonizations and extirpations. Each circle represents a park. Solid vertical and horizontal lines in the plot mark the median proportion of colonizations and extirpations across parks under the high-emissions trajectory in summer, used to classify parks into all trend groups except intermediate change. The boundaries of the intermediate change group, represented by the diamond in the center of the plot, are delimited by the upper and lower quartiles of each axis.
Parks that fall in the low and intermediate change groups can best support landscape-scale bird conservation by emphasizing habitat restoration, maintaining natural disturbance regimes, and reducing other stressors. Parks within one of the three high change groups (high turnover, high potential colonization, or high potential extirpation) can do so by focusing on actions that increase species' ability to respond to environmental change, such as increasing the amount of potential habitat, working with cooperating agencies and landowners to improve habitat connectivity for birds across boundaries, managing the disturbance regime (e.g., fire), and possibly more intensive management actions (e.g., intensive nest site management, translocations). Monitoring to identify changes in bird communities will inform selection of appropriate management responses.
Safeguarding the existing investment in conservation represented by the park system will require a forward-looking approach to natural resource management that explicitly recognizes the prospect of climate-driven ecological change beyond historical ranges of variability. Effective conservation in the face of climate change will also require landscape-level thinking (including consultation with regulatory bodies such as the U.S. Fish and Wildlife Service in cases of federally protected species). Such thinking would apply various approaches—resist, accommodate, or actively direct ecological change toward specific new desired conditions—and allow species to persist or track climate.

Figure 4. Classification of parks into trend groups based on the proportion of potential colonizations and extirpations. Each circle represents a park. Solid vertical and horizontal lines in the plot mark the median proportion of colonizations and extirpations across parks under the high-emissions trajectory in summer, used to classify parks into all trend groups except intermediate change. The boundaries of the intermediate change group, represented by the diamond in the center of the plot, are delimited by the upper and lower quartiles of each axis.
The species distribution models included in this study are based solely on climate variables (i.e., a combination of annual and seasonal measures of temperature and precipitation), which means there are limits on their interpretation. Significant changes in climate suitability, as measured here, will not always result in a species response, and all projections should be interpreted as potential trends. Multiple other factors mediate responses to climate change, including habitat availability, ecological processes that affect demography, biotic interactions that inhibit and facilitate species' colonization or extirpation, dispersal capacity, species' evolutionary adaptive capacity, and phenotypic plasticity (e.g., behavioral adjustments). Ultimately, models can tell us where to focus our concern and which species are most likely to be affected, but monitoring is the only way to validate these projections and should inform any on-the-ground conservation action.
Additional resources
- Download this page's information in a printable PDF handout.
- View the project homepage on the Audubon Society website.
- Read the original journal article in PLOS ONE.
Related articles
Last updated: January 13, 2025
