Image courtesy of Dr. Robert Brodman and the iSWOOP Project.
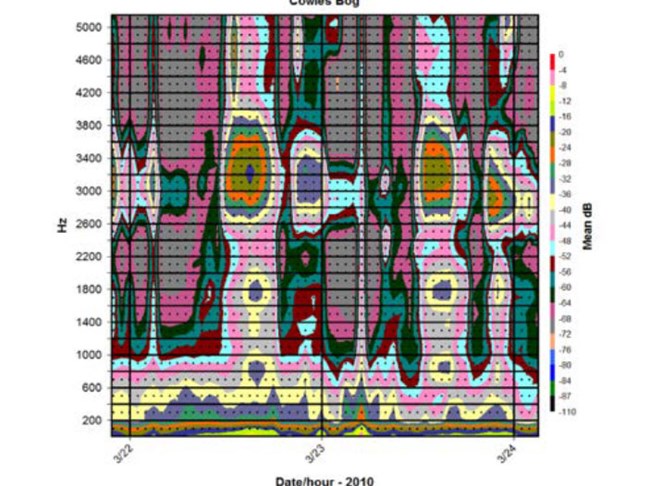
Dr. Bob and his collaborators in the Terrestrial Wetland Global Change Research Network are interested in monitoring the sounds of amphibians to see how they change over time. The recorded sounds are analyzed with special software and an image of the sound is produced. The image here is from Cowles Bog at Indiana Dunes National Lakeshore, and represents two days of sounds. The x-axis shows time, with each dash representing an hour. The y-axis shows frequency or pitch, measured in Hertz, with the highest frequency at the upper end of the axis. Color represents the intensity of the sounds. Each frog species has a unique voice print.
The blue blots surrounded by a yellow doughnut shape are wood frog calls (low Hz, 600-1900). The chorus frogs and spring peepers are higher frequency sounds and were also louder on these days. They show up here as orange rings around green at about 3600 Hz.
Scientists can recognize the visual signature of the organisms on the images. By comparing images from different times, they can identify changes. For example, by comparing when particular amphibians are calling from one year to the next, they have determined that the mating seasons of certain frogs are shifting earlier in the season as our climate continues to change.
Last updated: September 15, 2018
