
|
Geological Survey Professional Paper 554—D
Cenozoic Volcanic Rocks of the Devils Postpile Quadrangle, Eastern Sierra Nevada California |
PETROLOGIC AND CHEMICAL DATA
MICROSCOPIC PETROGRAPHY
Data obtained from the petrographic study of the volcanic rocks are recorded in table 2. Percentages of constituents are based upon visual estimates obtained from thin-section study and are little more than rough approximations. The percentages, however, can be effectively used to distinguish major and minor constituents and to reveal the large proportion of indeterminate material occult in the groundmass of most of the rocks. Minerals listed in groups of two or more are given in order of decreasing abundance. In most specimens range in anorthite content of the plagioclase was determined from twinning relationships. Olivine is typically magnesium rich.
TABLE 2.—Petrographic summary of the volcanic rocks
[An, anorthite; n, refractive index; Fa, fayalite]
| Volcanic unit | Color (Goddard, 1948) |
Texture | Phenocrysts | Matrix | Remarks | |||
| Mineral | Average range in size (mm) |
Percent | Material | Percent | ||||
| Rhyolite. | Light gray to black. | Holohyaline to vitrophyric. | Plagioclase (An≈10). Sanidine. Quartz. Biotite. Oxyhornblende. Granular opaque minerals. |
1-5 2-10 0.5-2 <0.5 <0.5 <0.5 |
See remarks. | Glass and impalpable dust, minor feldspar, microlites. | See remarks. | Material is dominantly obsidian and pumice. Where phenocrysts are locally abundant (as at Deer Mountain), they occur in approximately the following ratio—plagioclase: sanidine: quartz mafic minerals: 6:2:1:1. Then of fused obsidian from small dome north of Deadman Creek is 1.490. |
| Quartz latite of Mammoth Mountain. | Light gray to nearly black. | Vitrophyric to pilotaxitic, dominantly hyalopillitic. | Plagioclase (An30-50). Biotite, oxyhornblende, clinopyroxene, granular opaque minerals, minor apatite. |
1-5 0.1-2 |
5-15 1-5 |
Plagioclase and potassium feldspar. Glass and impalpable dust. |
0-75 5-90 |
Plagioclase phenocrysts are commonly zoned and contain irregular patches of glass; potassium feldspar in matrix is indicated by stain tests; n of natural glass is 1.493-1.500, rock commonly shows flow banding. |
| Quartz latite of Two Teats. | Light gray to dark or purplish gray. | Hyalopilitic. | Plagioclase (An25-45). Biotite, oxyhornblende, granular opaque minerals, minor apatite and zircon. |
1-5 0.1-1 |
15-30 <5-10 |
Plagioclase. Glass and opaque dust. |
15-70 15-70 |
Most plagioclase phenocrysts are embayed, riddled with glass, and zoned; mafic phenocrysts are generally strongly oxidized and otherwise altered. |
| Olivine-bearing quartz latite. | Dark gray. | Hyalopilitic to intergranular. | Plagioclase (An25-50). Sanidine. Biotite, oxyhornblende, clinopyroxene, orthopyroxene, olivine. |
2-5 2-5 0.1-0.5 |
20-30 5-10 5 |
Plagioclase, glass, and minor opaque dust. | 60-70 | Plagioclase phenocrysts are commonly riddled with glass disposed in somewhat vermicular pattern and have some reverse zoning of plagioclase. Olivine has a composition about Fa20 according to optical data. |
| Tuff of Reds Meadow, | Variable with position within flow; light to dark gray to reddish brown. | Vitroclastic. | Sanidine. Quartz. Plagioclase (An15-25). Biotite, granular opaque minerals. |
0.2-2 0.2-2 0.2-1 0.1-0.5 |
5-10 ≈5 ≈5 <1 |
Glass and impalpable dust; minor devitrification locally, | 70-90 | Many phenocrysts are commonly fragmented, showing some preserved crystal faces: exotic rock fragments are common; degree of welding and formation of eutaxitic structure is variable; n of pumice from base is 1.497; phenocrysts make up 10-30 percent of the rock with average of 20 percent. Potassium-sodium ratio in sanidine is about 2:1, as estimated from partial chemical and X-ray diffraction data. |
| Andesite from Dry creek area. | Medium light gray to medium dark gray. | Trachytic to intergranular. | Plagioclase (An65-70). Olivine. Clinopyroxene. |
0.1-3 0.1-1 <0.1-0.5 |
<5-20 5-10 <5 |
Plagioclase. Olivine and clinopyroxene. Magnetite and other opaque minerals, glass(?). |
50-75 10-25 10-20 |
Olivine and pyroxene are moderately to strongly altered to black opaque material; olivine is composed of about Fa10-20 according to optical data and also altered to iddingsite(?) or bowlingite(?). |
| Andesite from Deadman-Glass creeks area, | Medium light gray to medium dark gray. | Pilotaxitic. | Olivine. Clinopyroxene. |
0.15-2 <0.01-0.13 |
3-5 5-10 |
Plagioclase An (35-55). Olivine and clinopyroxene. Magnetite and minor opaque minerals, |
50-75 10-25 5-10 |
Only about half a dozen highly altered plagioclase phenocrysts occur in thin section; otherwise, alteration in rock is restricted to rims of iddingsite(?) or bowlingite(?) around olivine. Sufficient magnetite is present to affect hand magnet. Olivine is composed of about Fa20 according to optical data. |
| Andesite of Pumice Butte | Medium light gray to dark gray. | Merocrystalline to trachytic. | Plagioclase (An60-70). Clinopyroxene, olivine. |
0.1-3 0.05-0.3 |
10-20 2-5 |
Plagioclase. Olivine, pyroxene impalpable dust, opaque minerals, and glass. |
20-50 30-70 |
In specimens with appreciable glass, plagioclase phenocrysts are typically embayed and riddled with matrix material; olivine is composed of about Fa10-20 according to optical data. Specimens from small knobs at north edge of outcrop area appear to be more latitic than average, a conclusion based upon data from fused glass beads; they also contain up to 5 per cent euhedral plates and wedges of opaque material apparently altered from hornblende. |
| Andesite of the Devils Postpile. | Medium light gray to medium dark gray. | Trachytic to intergranular. | Plagioclase (An50-70). Clinopyroxene, olivine. |
0.2-5 0.1-2 |
1-5 <5-25 |
Plagioclase. Olivine, pyroxene, opaque minerals, and impalpable dust. |
40-75 20-50 |
Rock in unit as mapped ranges from basalt to latite (45-66 percent SiO2) with andesite predominant; plagioclase phenocrysts in andesitic composition range are An55 to An65; plagioclase and pyroxene phenocrysts are commonly zoned. Olivine, being composed of about Fa10-20 according to optical data, is locally altered to iddingsite(?) or bowlingite(?). |
| Andesite of Deadman Pass. | Medium light gray to medium dark gray. | Pilotaxitic to trachytic. | Olivine. Clinopyroxene. |
0.1-2 0.1-1.5 |
15-25 | Plagioclase. Olivine, pyroxene, and granular opaque minerals. |
50-75 20-25 |
Rock is predominantly andesitic but includes some basalt. Percentage of olivine and clinopyroxene decreases with increasing silica. One specimen, with the highest silica content as estimated from fused beads, contains both ortho- and clinopyroxene. Olivine, being composed of about Fa20 according to optical data, is locally altered to iddingsite(?) or bowlingite(?). |
| Basalt of the Red Cones, | Medium gray to medium dark gray. | Merocrystalline. | Plagioclase (An65-70). Olivine. Clinopyroxene. |
0.5-3 0.2-2 0.2-2 |
20-25 <5 <5 |
Plagioclase, olivine, pyroxene, granular opaque minerals, and glass. | 70 | Clinopyroxene and olivine are generally unaltered, with the composition of olivine being about Fa20 according to optical data. |
CHEMICAL DATA
Table 3 presents chemical analyses and norms for seven samples of volcanic rock from the Devils Postpile quadrangle and one from the Mount Morrison quadrangle.
TABLE 3.—Chemical analyses and norms of the volcanic rocks
[Analyses by the rapid method of Shapiro and Brannock (1956)]
| Volcanic Unit | Andesite of the Devils Postpile | Andesite of Deadman Pass | Quartz latite of Two Teats | Quartz latite of Mammoth Mountain | Olivine bearing quartz latite | |||
| Rittmann classification | Trachybasalt | Trachybasalt | Trachyandesite | Trachyandesite | Quartz latite | Quartz latite | Quartz latite | Quarts latite |
| Field No. (See explanation below) | D—399e | D—611a | D—515 | D—801e | D—800 | D—961 | 3M—340 | 3M—929a |
| Laboratory No | 1154228 | 1154230 | 1154229 | 1154232 | 1154231 | 263M—12 | 144089 | 148741 |
| Sp gr (powder) | 2.95 | 2.85 | 2.64 | 2.73 | 2.58 | n.d. | 2.62 | 2.56 |
| Rittmann p value (alkaline <55 <calc-alkaline) | 52.5 | 51.7 | 54.5 | 50.4 | 58.0 | 57.2 | 55.3 | 53,7 |
| Differentiation index | 35.0 | 35.8 | 59.8 | 53.0 | 82.0 | 86.3 | 80.1 | 79.2 |
| Average refractive index of fused glass beads | 1.594 | 1.583 | 1.545 | 1.560 | 1.505 | 1.505 | 1.510 | 1.515 |
| Chemical analyses (percent) | ||||||||
| SiO2 | 49.2 | 48.4 | 56.2 | 53.0 | 67.5 | 68.9 | 65.8 | 64.7 |
| Al2SO3 | 14.9 | 15.2 | 17.5 | 15.7 | 16.4 | 16.4 | 16.8 | 17.0 |
| Fe2O3 | 2.3 | 3.0 | 3.2 | 2.6 | 2.2 | 1.1 | 2.7 | 1.8 |
| FeO | 5.6 | 4.6 | 3.7 | 3.8 | .32 | 1.3 | 1.0 | 2.2 |
| MgO | 10.0 | 8.5 | 2.5 | 5.0 | .76 | 4.27 | 1.0 | 1.1 |
| CaO | 10.1 | 9.9 | 5.2 | 7.4 | 2.7 | 1.8 | 2.7 | 2.7 |
| Na2O | 2.9 | 3.0 | 4.7 | 3.8 | 4.4 | 4.9 | 5.0 | 4.5 |
| K2O | 1.8 | 1.8 | 2.5 | 2.7 | 4.1 | 4.1 | 3.9 | 4.8 |
| H2O | .30 | 1.1 | 1.1 | .92 | .77 | .19 | .18 | .60 |
| TiO2 | 1.3 | 1.0 | 1.5 | .94 | .34 | .51 | .70 | .64 |
| P2O5 | .80 | .62 | .79 | .50 | .24 | .20 | .22 | .16 |
| MnO | .06 | .18 | .16 | .14 | .09 | .08 | .08 | .06 |
| CO2 | .08 | 2.0 | .09 | 2.8 | .08 | <.05 | .05 | .07 |
| Total | 99.3 | 99.3 | 99.1 | 99.3 | 99.9 | 99.8 | 100.1 | 100.3 |
| Norms (weight percent) | ||||||||
| Quartz | ---- | ---- | 6.2 | 4.7 | 20.2 | 20.7 | 14.9 | 12.5 |
| Orthoclase | 10.6 | 10.6 | 14.7 | 16.0 | 24.2 | 24.2 | 22.8 | 28.4 |
| Albite | 24.1 | 25.4 | 39.7 | 32.1 | 37.2 | 41.4 | 42.4 | 38.3 |
| Anorthite | 22.3 (An48) | 22.7 (An47) | 19.3 (An33) | 15.7 (An33) | 11.3 (An23) | 7.6 (An16) | 12.0 (An22) | 12.0 (An24) |
| Nepheline | 0.3 | ---- | ---- | ---- | ---- | ---- | ---- | ---- |
| Diopside | 17.6 | 7.7 | 0.6 | ---- | ---- | ---- | 1.1 | 0.9 |
| Hypersthene | ---- | 13.1 | 7.9 | 16.0 | 1.9 | 1.5 | 2.0 | 3.9 |
| Apatite | 1.9 | 1.5 | 1.9 | 1.2 | 0.6 | 0.5 | ---- | ---- |
| Corundum | ---- | ---- | ---- | 0.8 | 0.6 | 1.1 | ---- | ---- |
| Magnetite | 3.3 | 4.4 | 4.6 | 3.8 | 0.3 | 1.6 | 1.2 | 2.6 |
| Ilmenite | 2.5 | 1.9 | 2.8 | 1.8 | 0.6 | 1.0 | 1.4 | 1.2 |
| Hematite | ---- | ---- | ---- | ---- | 2.0 | ---- | 1.9 | ---- |
| Calcite | 0.2 | 4.5 | 0.2 | 0.2 | ---- | ---- | ---- | |
| Olivine | 16.4 | 6.5 | ---- | ---- | ---- | ---- | ---- | ---- |
| Total | 96.2 | 98.3 | 97.9 | 98.5 | 99.1 | 99.6 | 99.7 | 99.8 |
D—399e. At outlet of Lake Mamie, Mammoth Lakes basin.
D—611a. On small ridge half a mile northeast of bench mark 7607 in Snow Canyon, King Creek.
D—515. On Boundary Creek just below John Muir trail southeast of Reds Meadow.
D—801e. On slope one-quarter of a mile northeast of bench mark 8425 along road southeast of Agnew Meadows.
D—800. Summit of Two Teats.
D—961. On northwesternmost spur of Mammoth Mountain at 10,000-ft elevation.
M—340. One-quarter of a mile north of Mammoth Rock (in Mount Morrison quadrangle, half a mile east of Devils Postpile quadrangle boundary).
M—929a. One-quarter of a mile west of quadrangle boundary along Deadman Creek.
1 Analysts: P. L. D. Elmore, S. D. Botts, and I. H. Barlow.
2 Analysts: L. B. Beatty and A. C. Bettiga.
3 Analysts: K. E. White, P. L. D. Elmore, P. W. Scott, and S. D. Botts (from Rinehart and Ross, 1964, table 9).
4 Quantitative spectrographic analysis (63MS—60).
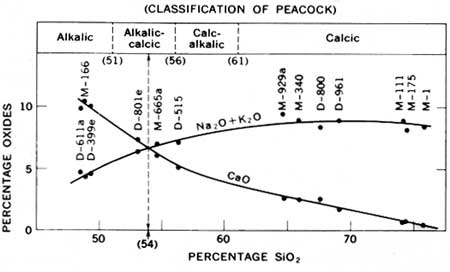
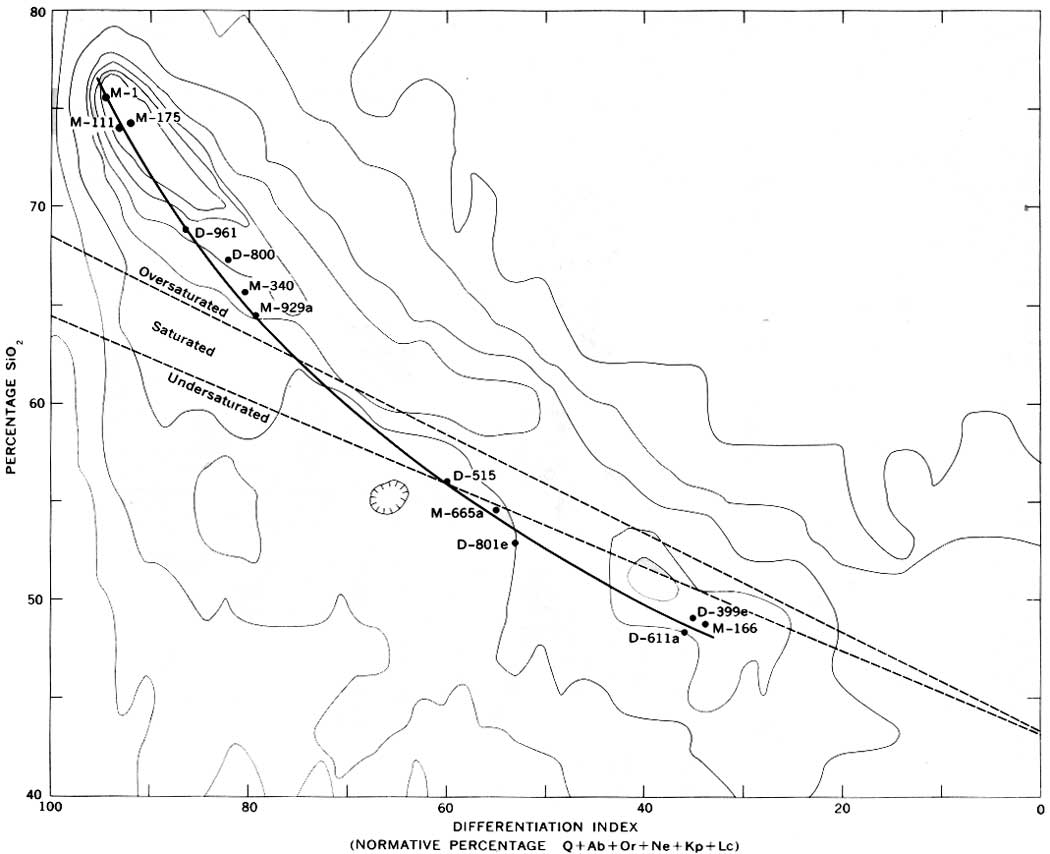
While only the Cenozoic volcanic rocks of the Devils Postpile quadrangle are described in this report, the volcanic rocks of both the Devils Postpile and Mount Morrison quadrangles (an area we call the Mammoth Lakes area) overlap in time and space and are here considered part of a consanguineous suite which has alkalic affinities, at least in the mafic rocks of the suite. The nature of this suite is illustrated by a Peacock (1931) variation diagram (fig. 2). The alkali-lime index, approximately 54, places the suite in the alkalic-calcic type. Alkalic affinities also are well shown at the mafic end of the series, where the Rittmann p values are less than 55 (alkaline <55 <calc-alkaline; Rittmann, 1953), and the rocks are trachybasalt and trachyandesite (table 3) according to Rittmann's classification. Figure 3 further illustrates the alkalic tendencies of the suite at its mafic end, as alkalic rocks typically fall within the undersaturated field of silica-differentiation-index plots (Thornton and Tuttle, 1960).
|
| FIGURE 2.—Variation diagram of the Mammoth Lakes volcanic suite showing classification according to the "alkali-lime index" (percentage of Si2 at which Na2O+K2O=CaO) of Peacock (1931). D samples are from table 3; M—1 is a rhyolite from the nearby Mono Craters (R. A. Loney, written commun., 1965); the other M samples are from Rinehart and Ross (1964, table 9). |
|
| FIGURE 3.— "Differentiation trend" for the Mammoth Lakes volcanic suite as determined by utilization of the "differentiation index" of Thorton and Tuttle (1960). Background contours indicate frequency distribution of the silica-differentiation-index values for 5,000 analyses in H. S. Washington's tables (from Thornton and Tuttle, 1960). Sample sources listed in figure 2. (click on image for an enlargement in a new window) |
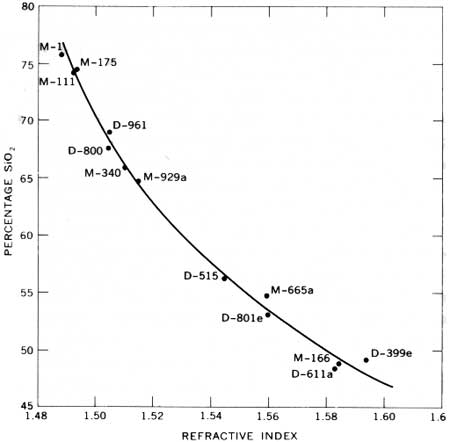
In order to extrapolate from data of the few chemical analyses, the rapid-fusion technique described in Rinehart and Ross (1964) was used to obtain estimates of percent silica from a large number of specimens. Available chemical analyses cover a range in silica content sufficient to establish a reasonably definitive silica refractive-index curve for the Mammoth Lakes suite (Huber and Rinehart, 1966). This curve, shown in figure 4, is a slight modification, based upon additional data, of an earlier version (Rinehart and Ross, 1964). The rapid-fusion techniques used were the same as described in these two earlier reports.
|
| FIGURE 4.—Silica-refractive-index diagram showing curve established for volcanic rocks of the Mammoth Lakes area, Same sources as listed in figure 2. The positions of M—111 and M—175 were transposed in Rinehart and Ross (1964). |
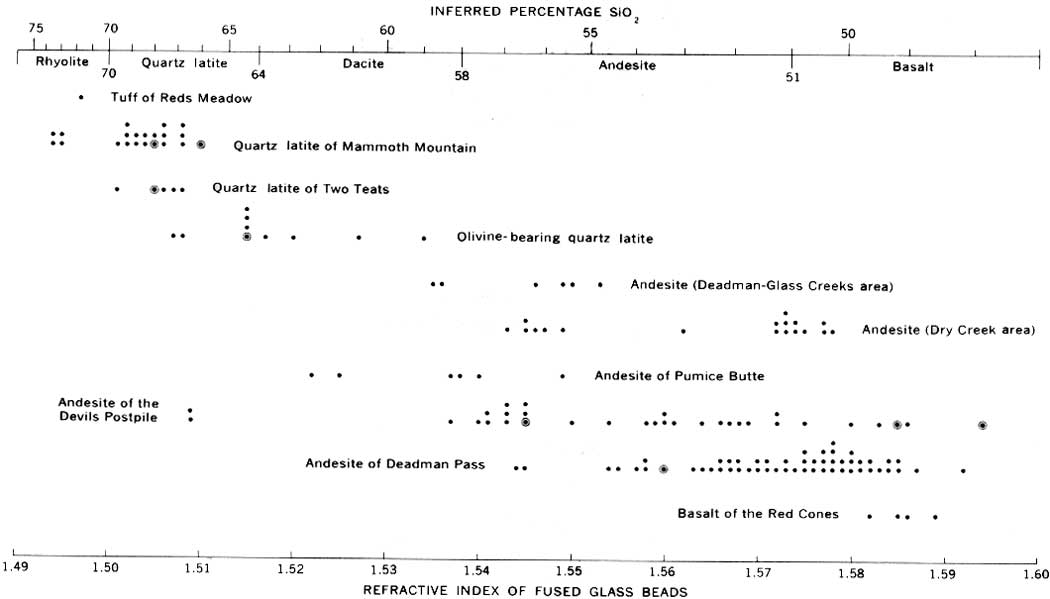
The data obtained from refractive-index determinations are in figure 5, which gives an indication of the average percent silica as well as the general range in percent silica for the map units indicated. (See pl. 1 for geographic plot of silica distribution.) The variation within some of the map units is extreme but may be in part explained by the probability that the units represent more than one eruptive cycle. The significance of this variation is considered later in discussions of the individual map units.
|
| FIGURE 5.—Range in percentage of silica of some of the mapped volcanic units as inferred from refractive indices of fused samples, Percentage of silica is projected from figure 4. Each dot represents one sample; some samples were collected a short distance into the Mount Morrison quadrangle, Circled dots indicate chemically analyzed samples. The rock classification used in this report is also shown. (click on image for an enlargement in a new window) |
CLASSIFICATION
The volcanic rock classification used in this report is based upon chemical composition rather than mineralogy, and therefore many of the rock names used are different from those used by previous workers in the area (chiefly Erwin, 1934). The chemically analyzed samples represent the entire compositional range of the suite (table 3) fairly well and are classified according to the Rittmann system (Rittmann, 1952). Fused-bead data provide a good estimate of the silica percentage of the remaining samples; hence, silica percentage provides an auxiliary basis for classifying these rocks. From a study of the classifications of Rittmann and of Nockolds (1954), which are similar, we have arrived at the classification shown on figure 5, which is based solely upon percent silica. For convenience, the prefix "trachy" is generally omitted in the ensuing discussion, although most, and perhaps all, of the andesites and basalts in the quadrangle are tsachyandesites and trachybasalts.
| <<< Previous | <<< Contents >>> | Next >>> |
pp/554-D/sec1.htm
Last Updated: 18-Jan-2007