|
MESA VERDE
Environment of Mesa Verde, Colorado Wetherill Mesa Studies |

|

Chapter 4
discussion of site interrelations
Data collected at the six sites were presented in the previous section, along with observations on the interrelations of the different ecosystem components. Many comparisons of the environmental data can be made. The comparisons discussed in this chapter were chosen for their relevance to the project's objectives. The annual environment data are included in this report (see appendix) in order to make them readily available for use in other studies.
SOIL AND VEGETATION RELATION SHIPS OF SELECTED SITES
A comparison of soil types indicates a similarity among the M—3, C—1, and C—3 sites—all are stony loams in the Mughouse series. These fine-textured soils are relatively shallow, have a large proportion of rock fragments, and support woody shrubs.
The M—1 and C—2 sites have azonal soils (lacking a natural horizonation) but are otherwise very dissimilar. The M—1 soils—lithosols——support black sagebrush (Artemisia nova), an indicator of shallow soils. The alluvium at C—2 supports a dense stand of big sagebrush, a shrub best adapted to deep, friable soils.
The M—2 site is unique in that its soil, a Witt loam, is highly developed, as well as deep, and supports a climax stand of forest and grass that is generally devoid of any woody shrubs.
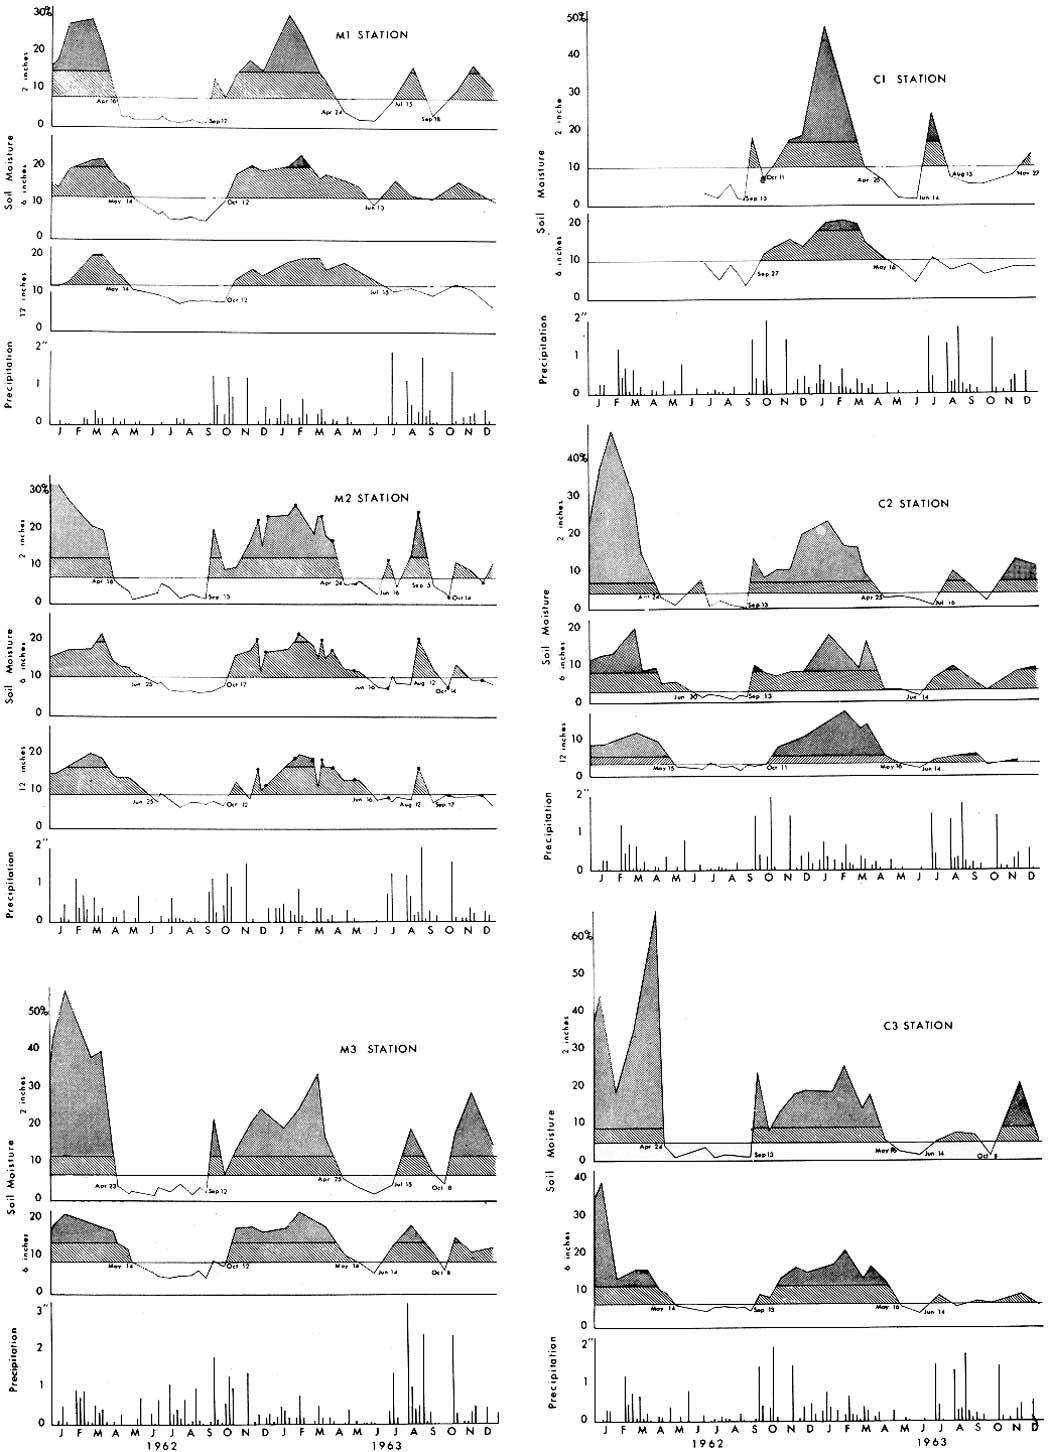
Some characteristics of soil moisture, a critical factor in any semiarid area such as Mesa Verde, are given in figure 15. The annual pattern of soil moisture shows similarities as well as differences during the 2 years of our study. In both years, moisture from melting snow built up in the soil in early spring and then dropped rapidly as the dry season came on in late spring. In 1963, precipitation in August recharged the soil moisture in a way that is probably typical of the area. The year of 1962, on the other hand, provided an example of an extremely dry summer. There was so little precipitation that soil moisture remained deficient until fall.
|
| Fig. 15 Graph showing soil moisture content and precipitation at the six sites in 1962 and 1963. The light hatching indicates available moisture, while the darker shading represents moisture content above field capacity. A continuous horizontal line marks the permanent wilting coefficient for each depth. Precipitation is shown in the bar graphs. At M—2, four replicated gravimetric samples were collected each month during 1963; their average moisture content is indicated by dots. (click on image for an enlargement in a new window) |
Comparisons between sites show that moisture was deficient at the 6-inch depth for the longest period at the southwest exposure site (C—1) and for the shortest period in the canyon floor site (C—2). The latter case was due to the frozen condition of the ground, which persisted well into the spring.
COMPARISON OF 1962 AND 1963 WEATHER
An important aspect of climate from an ecological standpoint are year-to-year variations in weather factors. There was little difference between the 2 years of our study in annual averages and totals; however there were striking differences in the monthly records for these years.
Solar radiation. This was similar in all months of the 2 years except August, when the daily values were 644 gm. cal./cm.2/day in 1962 and only 514 in 1963. The lower value for 1963 resulted from greater cloudiness, precipitation, and relative humidity—conditions that would reduce the amount of solar radiation reaching the ground.
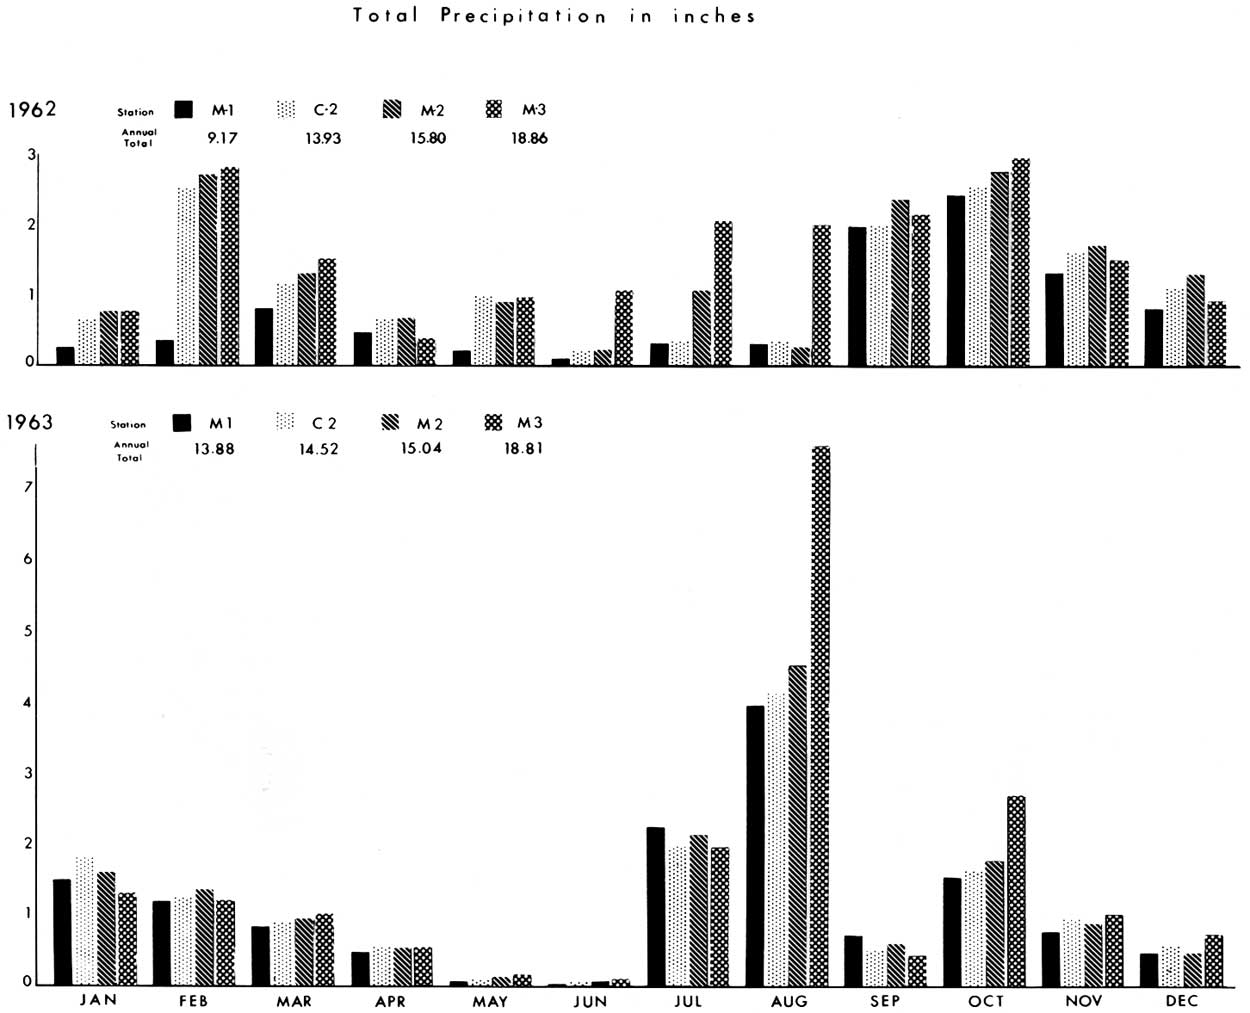
Precipitation. As mentioned earlier, the annual precipitation at Mesa Verde averaged 18 inches over the past 41 years. The 14 inches in 1962 and 15 inches in 1963, recorded at the Weather Bureau station, were thus somewhat below normal. Total precipitation differed very little—about 1 inch during the 2 years of the environment program. This was also true of the canyon and other mesa-top sites, except for M—1 at the lower end of Chapin Mesa. There, a difference of almost 5 inches was recorded (fig. 16).
|
| Fig. 16 Graphic comparison of monthly precipitation in 1962 and 1963 at the mesa-top sites and at the canyon-bottom site. (click on image for an enlargement in a new window) |
The hazards in generalizing about a year's weather from such information can be seen in figure 16. Only the late spring was dry in 1963, whereas the entire summer was relatively dry in 1962. The effects of such a distribution of moisture on plants, especially cultigens dependent upon summer rains, is obvious.
The extremely wet summer of 1963 deserves further comment. Although August is usually the wettest month of the year, the Weather Bureau station received twice the normal amount in August 1963. Moreover, at the M—3 site on Park Point, almost half of the year's precipitation came during that month! In contrast, in August of 1962 the Weather Bureau station received less than one-tenth of the average for August. Snowfall in both the winters of 1961-62 and 1962-63 was below normal, but the former had more snow than the latter.
Evaporation. At all sites, this was higher in 1962 than in 1963. The potential summer evaporation, as measured by the atmographs, greatly exceeded the actual yearly precipitation. Some summer months had evaporation potentials that were about half the yearly precipitation.
Temperature. Temperature recordings at the Weather Bureau station during 1962 and 1963 are shown in table 1. Air temperature fluctuations at all the environment measurement sites were more alike during 1963 than during 1962, perhaps because of the greater amount of cloudiness and rainfall in 1963. Clouds and moisture would tend to reduce the effect of locally modifying forces, and thus local conditions would approximate regional conditions.
COMPARISON OF INDIVIDUAL FACTORS BETWEEN SITES
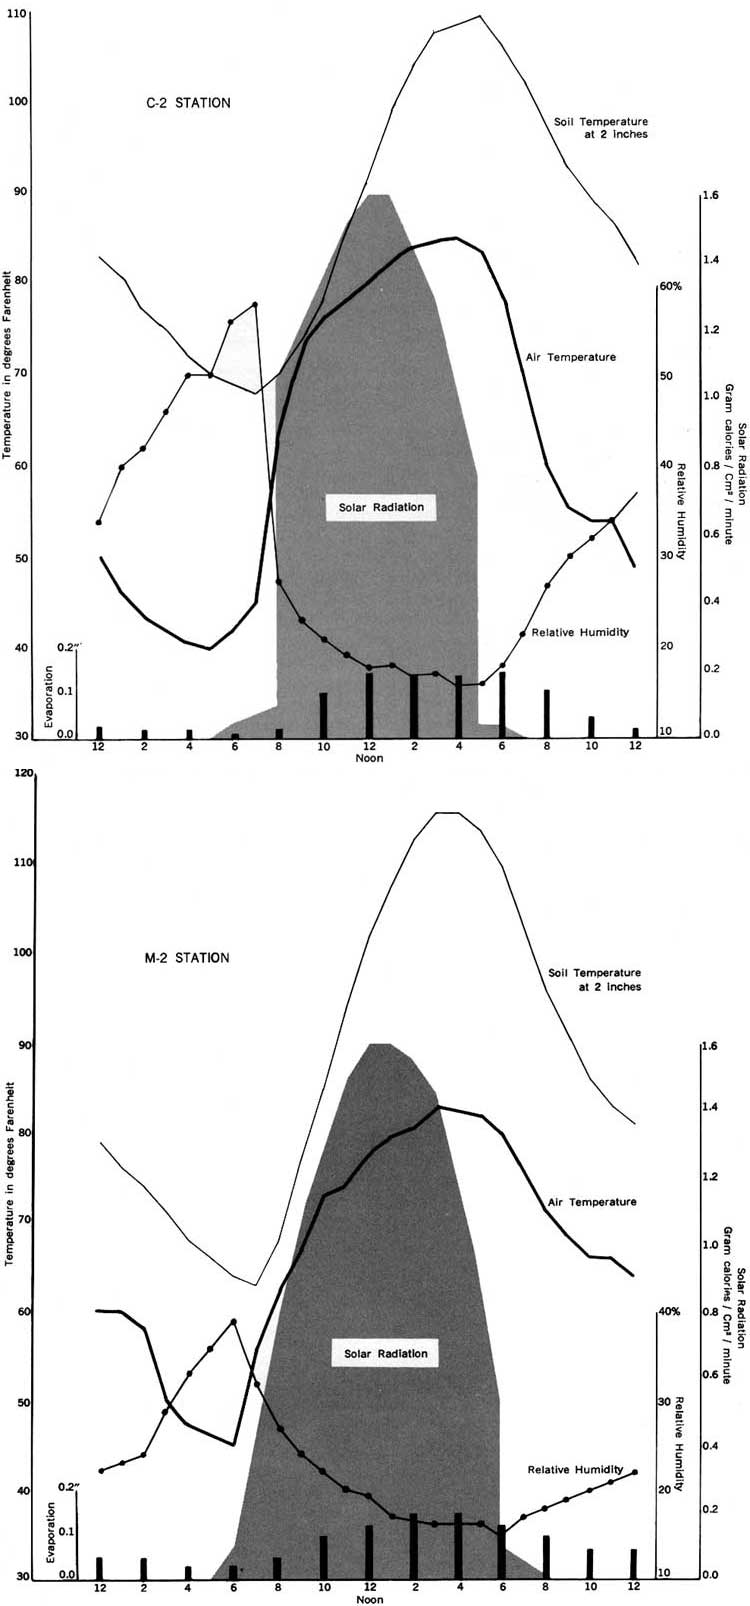
Solar radiation. As one of the major controls of other environmental factors, solar radiation was consistently higher at M—2 than at C—2 throughout the year. The reason for this difference is obvious; when the sun is low during the early morning and late afternoon, the canyon floor is in the shadow of the upper cliffs of the mesas.
Although we did not measure this factor on the talus slopes, we have studied it from indirect sources because of its importance in understanding the local environments of the canyons. There are many indications that C—1, with its southwest exposure, receives more solar radiation than does C—3, on the opposite slope. Although the following measurements of incident angles of direct sunlight show that the southwest slope receives more solar radiation at noon, the actual maximum radiation occurs in late morning at the northeast exposure and in early afternoon at the southwest exposure. The smaller the angle, the more direct the sunlight perpendicular to the slope. It is evident that the radiation regimes become more alike in summer.
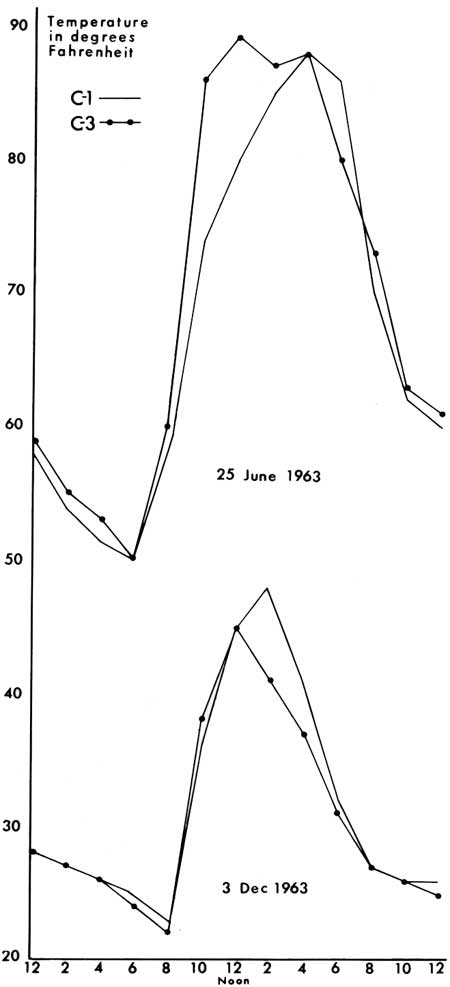
An effect of the solar radiation load on the two slopes can be seen in the temperature differences. The march of air temperatures on clear summer and winter days (fig. 17) indicates that solar radiation was higher on the southwest exposure slope during late autumn and winter, whereas the northeast slope received more radiation during late spring and summer. We believe that the southwest exposure receives more solar radiation on a yearly basis, but the northeast slope probably receives more during the growing season. The topography and orientation of the two sites is such that the sun reaches the northeast exposure first during all seasons of the year (calculated from Geiger, 1957, p. 221).
|
| Fig. 17 Graph showing relationship of air temperatures to exposure under cloudless skies, As shown, the heat load varies from a summer maximum on the east-northeast exposure (C—3) to a winter maximum on the west-southwest exposure (C—1). |
Perhaps the most reliable indicator of solar radiation intensities on the two slopes is the persistence of snow; snow cover is intermittent on the southwest exposure, while it persists most of the winter on the C—3 slope.
The density of the vegetation is both a result and a cause of differences in the amount of solar radiation. If both slopes were bare of plants, the southwestern exposure would receive more total radiation for the year and, consequently, it would be less mesic. Since plants are present, they tend to produce a more complete cover on the more mesic, northeastern exposure. The more open vegetation of the southwestern slope thereby permits greater heating of the soil and air.
The effect of clouds on insolation is difficult to determine. Clear mornings and cloudy afternoons are common throughout the summer. A rather complete cloud cover in the afternoon would reduce the total daily radiation on the southwestern slope more than on the northeastern slope because at that time of day solar radiation is potentially more direct on the former. Scattered cumulus clouds could, however, actually increase radiation through reflection.
Air temperature and cold-air drainage. At all sites, minimum air temperatures varied more from day to day than did maximum temperatures. Both maximum and minimum temperatures varied more in the winter than in the summer.
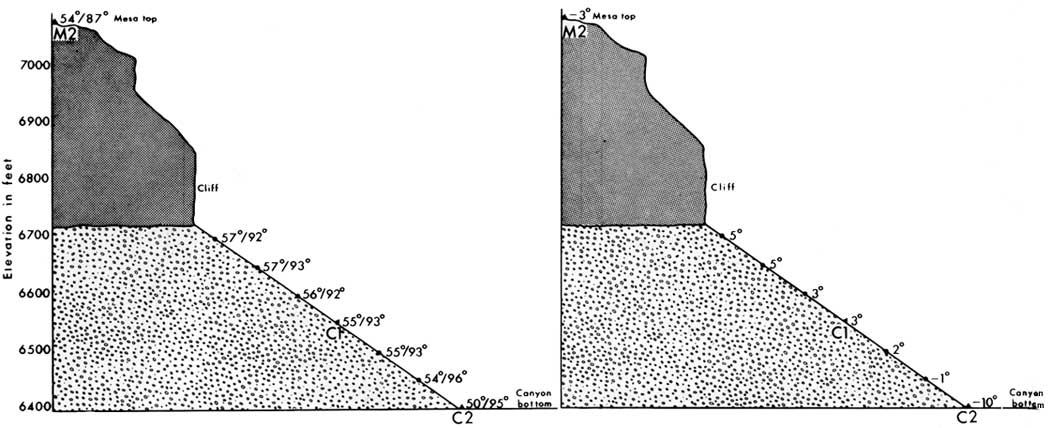
Early study of our data showed the expected pattern of cold-air drainage. Air that becomes colder, and therefore more dense due to local cooling, drains downslope and accumulates in lowlands. The drainage is most striking on clear and calm nights in summer. In order to study this phenomenon more intensively, Weather Bureau-type maximum and minimum thermometers were mounted at shoulder height on the north side of trees in small, ventilated shelters. These shelters were established at intervals of 50 feet along a transect from the canyon floor to the base of the cliff (fig. 18).
|
| Fig. 18 Air-temperature profiles of the west-southwest-facing slope in Navajo Canyon, showing the pronounced cold-air drainage at the bottom and the "thermal zone" on the talus. The profile at left shows minimum and maximum temperatures during August 13-19, 1963, while the profile at right gives only minimum temperatures during the winter of 1963-64. (click on image for an enlargement in a new window) |
During the summer, cold air builds up to a level less than 50 feet deep in the canyon bottom. Above the 50-foot level, minimum temperatures are almost isothermal to the bottom of the cliff, while the mesa top is as cool as the 50-foot level. During the day, however, the cold air is warmed or replaced rapidly, and the low wind velocities present on the canyon floor allow temperatures there to build up more.
The cold air lake that occurs at night increases in depth during the winter and influences air temperature minima to over 50 feet above the canyon floor. Again, as is shown in figure 18, the upper slopes were warmer at night than both the mesa top and canyon floor. This is a common temperature phenomenon (Geiger, 1957, p. 205).
Soil temperature. Two generally known features of soil temperature are illustrated by our data. First, the amount of variation is greatest near the surface and decreases with increase in depth to about 12 inches, where there is little fluctuation throughout the year. Secondly, soil temperatures, except near the surface, are more moderate than air temperatures, both warmer in winter and cooler in summer. Since soil temperatures are controlled, in part, by the composition of the soil, overall comparisons have not been made.
Precipitation. On the mesa tops, precipitation varies directly with increase in altitude, the highest site, at Park Point, receiving more precipitation than any other (fig. 16). Elevation is less important as a control in the canyons. For example, C—2, in the bottom of Navajo Canyon, received about the same amount of moisture as M—2, 800 feet above.
The long-term data from the Weather Bureau station show that there are generally two wet seasons each year—one in late winter and another in late summer, with August being the wettest month. Our data show that this pattern is characteristic of Mesa Verde as a whole.
Almost half of the yearly precipitation occurs as snow, with the greatest snowfall coming in the month of January. Snowstorms are not unusual as late as April, particularly at the higher elevations.
The effect of snow on soil temperature and moisture was complicated because of movements of snow by changing wind. This circumstance was most pronounced at Park Point, where areas covered by a drift 1 week were free of snow the next.
Relative humidity. The humidity record of M—2 may be considered typical of most of the mesa top. Humidity at the canyon floor and other low areas is markedly different, since these localities are subject to cold-air drainage. The C—2 data, as well as personal observations, indicate that air at the bottom of the canyon is saturated, or nearly so, almost every evening of the year.
Evaporation. Because of consistently poor evaporation records, comparison of evaporative rates between sites is not possible. However, by selecting five intervals of 6 days each during which there were continuous atmograph records (at sites having this instrument), we did find that the amount of evaporation appeared to be dependent more on wind than on temperature. Evaporation was lowest at C—2, higher at M—2 and M—1, and highest at windswept M—3.
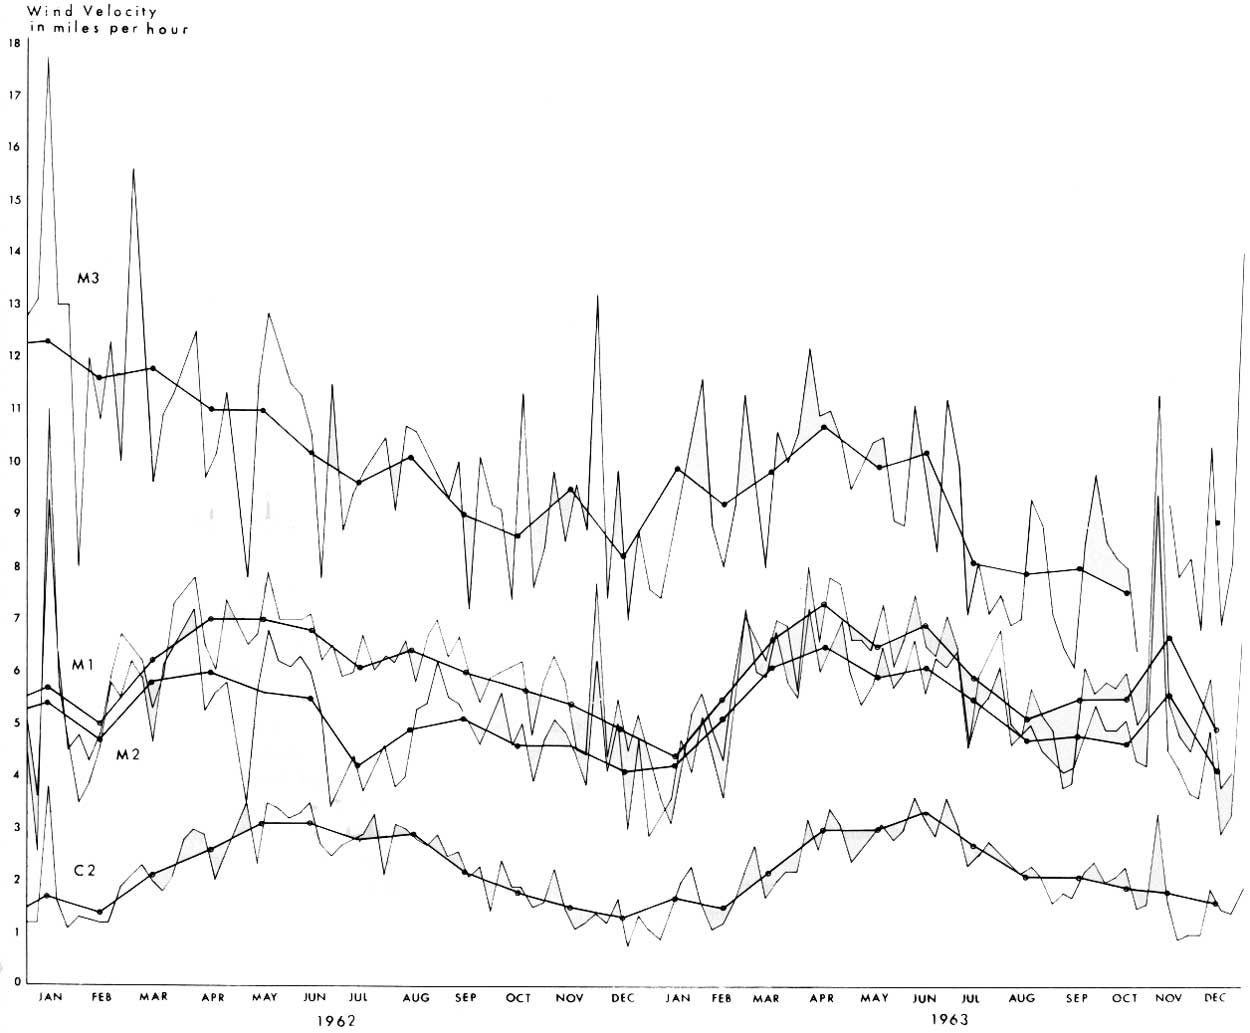
Wind. The prevailing winds at Mesa Verde are southwesterly. Spring and early summer are the windiest times, with the wind diminishing to its lowest point in winter (fig. 19).
|
| Fig. 19 Graph showing average wind velocities at the mesa-top and canyon-bottom sites in 1962 and 1963. Averages for servicing intervals and for months are indicated by light lines and heavy dotted lines, respectively. The gap in the M—3 record, in November 1963, was due to instrument failure during the first week of that month. (click on image for an enlargement in a new window) |
M—1 and M—3, near the extremities of the mesa, experienced more wind than M—2, the middle mesa-top site. This suggests that topographic setting has more influence on wind than does altitude. M—1, at the southern end of the mesa, was influenced by the nearby Mancos River canyon, whose northeast-southwest orientation acts as a natural wind funnel. Since the prevailing winds there are generally from the southwest, the spill-over from the canyon probably accounted for the small increase in wind at this site, in comparison with the situation at M—2.
C—2, on the canyon floor, had the least wind. Usually, the wind blew up-canyon during the day, and the cold air draining off the mesa tops and slopes produced down-canyon breezes at night.
COMPARISON OF WEATHER BUREAU STATION AND M—2 SITE
The 41-year record of the park's Weather Bureau station provides valuable information on the climate of the Mesa Verde. Our M—2 data supplement the Weather Bureau record by adding data on hour-to-hour temperature conditions and on factors not previously measured at that station. In addition, our study provides a means of testing how representative the long-term record is for the mesa as a whole.
Although the Weather Bureau station and M—2 were within a mile of each other and had similar topographic settings, their weather measurements do not agree closely. These unexpected results are probably due, in part, to the fact that the Weather Bureau station is in a small enclosure, which of course is influenced by adjacent buildings and trees.
Both maximum and minimum air temperatures were several degrees lower at M—2 than at the Weather Bureau station. This relationship was consistent throughout the 2 years of measurement. Actually recorded temperatures were more alike between the Weather Bureau station and M—1 lying 5 miles to the south and about 500 feet lower in elevation.
The occasional lack of accord in the precipitation records is more understandable. In 1962, M—2 had about 1.5 inches more precipitation than did the Weather Bureau station, but in 1963 it had 0.5 inch less. This erratic pattern occurred from month to month as well, and can be expected in an area where rainfall is commonly very localized.
COMPARISON OF MESA-TOP SITES
The three environment measurement sites on top of the mesas gave some indication of how factors vary along an elevational gradient.
Air temperature. M—2 recorded the lowest temperature of the mesa-top sites, -26° F., and M—1 recorded the highest temperature, 98° F. As pointed out earlier, the temperature regime at M—3 was surprisingly moderate, diurnal and seasonal temperatures fluctuating much less than at the other sites. In winter servicing trips, we often found that Park Point was the warmest spot on Mesa Verde. This is to be expected however, since temperature variations decrease with increasing altitude and wind, and Park Point was the highest and windiest site.
Precipitation. The sample of a given rain or snow storm caught in a gage varies with the amount of wind. Since our sites differed in this respect, comparison between them is not meaningful. It is clear, however, that annual precipitation increased with increasing altitude, being greatest in 1962, when the stand at the lowest mesa elevation received about two-thirds as much precipitation as the stand in the middle of the mesa and about half as much precipitation as the stand at Park Point. These differences resulted largely from variations between stations during the January-August interval. In 1963, the difference between stands was largely due to the fact that the stand at the highest elevation received almost twice as much precipitation (nearly 8 inches) as the other two during August, which was an exceptionally wet month.
Relative humidity. This was lowest at M—1, particularly in 1962, when this site received much less rainfall than the other mesa-top sites. M—2 and M—3 averaged about the same, although the humidity was not nearly as variable at higher M—3. Because of rapid, short-term fluctuations often associated with local showers, average values based on daily maxima and minima are not to be considered too significant.
Evaporation. This was greater at the ends of the mesa than in the middle, primarily due to more wind. M—3 had the highest values in both 1962 and 1963.
COMPARISON OF MIDDLE MESA-TOP AND CANYON-BOTTOM SITES
Mesas and plateaus are striking features of a landscape, but Mesa Verde is especially impressive because of the many deep canyons that dissect the upland surface. Such contrasting features as flat mesa tops, cliffs and steep slopes, and narrow, sometimes flat canyon floors produce a variety of landscape types. Our data clearly show the effects of elevation and topographic setting on local stands or ecosystems.
Solar radiation. There are two notable differences in the solar radiation regimes between the mesa tops and canyons. First, the period of direct illumination is shorter in the canyon because the sun's rays are intercepted by the cliffs early and late in the day. Secondly, daylight begins and ends more abruptly in the canyon. These conditions are shown graphically in figure 20, which plots the progression and interaction of several factors at M—2 and C—2. In 1963, incoming radiation at C—2 was almost 10 percent lower than that at M—2. This was caused by the "cliff effect."
|
| Fig. 20. (click on image for an enlargement in a new window) |
Precipitation. Month-to-month differences in precipitation between the M—2 and C—2 were slight.
Wind. At C—2, wind velocity was about half that recorded at M—2, on the mesa top above. Nocturnal cold air movement may account for some of the wind along the floors of the canyons.
The significant differences in temperature, humidity, and evaporation rates between M—2 and C—2 (fig. 20) are definitely attributable to cold-air drainage, the controlling feature on the canyon floor.
COMPARISON OF CANYON SITES
The canyons contain a variety of ecosystems resulting from differences in altitude, soil parent material, substrate stability, exposure to solar radiation, and temperature related to cold-air drainage.
The three sites in Navajo Canyon were about one-half mile due west of park headquarters and 1-1/2 miles south west of the middle mesa-top site, M—2. Navajo Canyon, like many others in Mesa Verde, is oriented northwest-southeast. Consequently, the slopes receive different amounts of solar radiation, which results in the northeast-facing (west side) slope being somewhat cooler and more moist than the opposite slope.
Nocturnal conditions play a major role in controlling the vegetation at C—2 but have little effect on C—1 and C—3 nearby. Exposure to incoming solar radiation or to insolation appear to be the major cause of differences in the stands at C—1 and C—3. Therefore, daytime conditions, especially on a year-round basis, are important at the two canyon-slope sites.
Air-temperature averages at C—1 and C—3 show surprising similarities (table 11). Relative snow cover and soil moisture conditions were found to reflect the slope differences more vividly. The more direct insolation on the southwest-facing slope in winter is felt to be responsible for the greater aridity at C—1.
| <<< Previous | <<< Contents>>> | Next >>> |
archeology/7b/chap4.htm
Last Updated: 16-Jan-2007