
Photo by Ken & Mary Campbell (c) Program Overview and Results of the 2018 Field Season2018 was the 8th year of the program, and our second year back after taking a year off to analyze the data and evaluate the program. Following the program review, some of the survey units that were too hard to get to were dropped. We also moved some survey units from the core group (which we try to survey every year) to the group that gets surveyed occasionally. This was done for several reasons: 1) some units are just too hard to get to each year (e.g. Bailey Range and Skyline), 2) we had a lot of sampling in some areas (eg. High Divide region) and not enough in others (e.g. the southeast), and 3) we need to be able to schedule more repeated surveys in some areas so that the standard error around the detectability estimate is smaller, allowing us to detect a change better. Following those modifications, in 2018 the survey frame consisted of 370 survey units grouped into 71 clusters, with 159 survey units in 30 clusters assigned to the core group. 
NPS 
NPS Of the units that were completely surveyed in the core clusters in the park, 74% were found to be occupied by marmots, 16% were abandoned (surveyors saw past but not recent sign of marmot use) and 10% had no sign of marmots. The rate of occupancy averaged ranged from 56%-65% during the first 6 years of the study (Figure 2). When all units were combined, the overall marmot occupancy in 2018 was 58% (Figure 1). Conclusions and Plans for 2019 Acknowledgements

Olympic Marmots
Learn more about the Olympic Marmot. 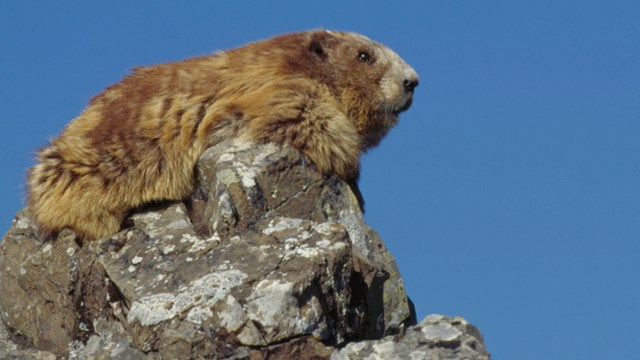
Marmot Monitoring Volunteers
Teams of volunteers hike to locations within Olympic National Park to record up-to-date information about the Olympic Marmot. 
Marmot Research, Reports, and Links
Learn more about the research on Olympic Marmots. |
Last updated: July 18, 2024