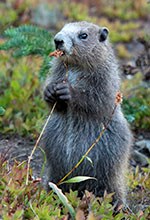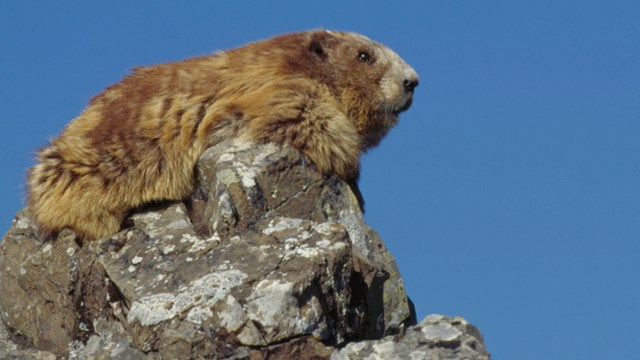
Photo by Ken & Mary Campbell (c) Program Overview and Results of the 2017 Field SeasonThis was our seventh full year of the Olympic Marmot Monitoring Program, and our first year back after taking a year off to analyze the data and evaluate the program. Most of the data analysis we did on our time off was included in the marmot charpter in the park's Natural Condition Assessment. We had a few bumps getting back into the swing of things but all in all, we had a good survey year.Following the program review, some of the survey units that are too hard to get to were dropped. Some clusters were also moved from the core group, which we try to survey annually, to the group that gets surveyed occasionally (every 2-3 years). This was done for several reasons: 1) some units are just too hard to get to each year (e.g. Bailey Range and Skyline), 2) we had a lot of sampling in some areas (eg. High Divide region) and not enough in others (e.g. the southeast), and 3) the need to be able to schedule more repeated surveys in some areas so that the standard error around the detectability estimate is smaller, allowing us to detect a change better. 
NPS 
So, in 2017 the survey frame consisted of 382 survey units in 71 clusters. We had 30 clusters in the core area- areas that should be surveyed every year, and that we have been able to survey pretty consistently since 2010. The remaining clusters are designated to be surveyed occasionally, as resources permit. Conclusions and Plans for 2018Data from the first 6 years of the program were analyzed and interpreted in the Natural Resource Condition Assessment for Olympic National Park (McCaffery and Happe, 2018). It was determined that although marmots have disappeared from 40% of the colonies that were monitored from 1957-2015, most of that decline happened prior to 1990. From 2010 to 2015 the marmot occupancy remained relatively stable (between 50 and 60%). However, occupancy rates varied between regions of the study area, with occupancy being highest in the northeast (mean=69%) and lowest in the southeast and south west (<40%). Occupancy was also most stable in the northeast, and more erratic (e.g. greater turnover) in the southwest and southeast. In 2019 we are going to continue the monitoring effort, and put more emphasis in areas of greater concern, such as the southeast. AcknowledgementsIn 2017 this project was supported by a continuing grant from Washington's National Park Fund. This whole endeavor would not have been possible without the hard work of the volunteer citizen scientists!

Olympic Marmots
Learn more about the Olympic Marmot. 
Marmot Monitoring Volunteers
Teams of volunteers hike to locations within Olympic National Park to record up-to-date information about the Olympic Marmot. 
Marmot Research, Reports, and Links
Learn more about the research on Olympic Marmots. |
Last updated: July 18, 2024
