2024 NPS Alaska Wildfire Summary
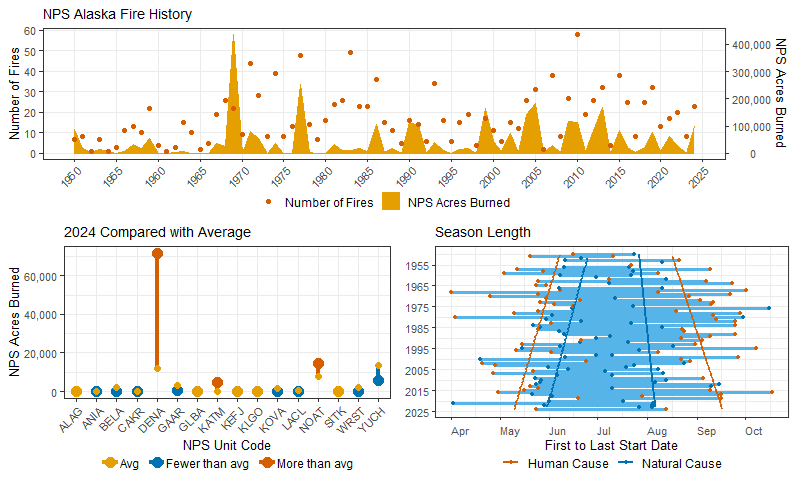
There were 23 fires affecting NPS units in Alaska in 2024, burning 97,465 acres of NPS-managed lands. For reference, this was 6 fires more than the yearly average of 17 fires and 54,675 acres more than the yearly average of 42,790 NPS acres burned. Yearly averages are calculated using data from 1950-2024.The NPS unit with both the most fires and by far the most NPS-managed acres burned was Denali National Park and Preserve (7 fires, 71,436 acres). The largest fire was the Grizzly Fire in Denali National Park and Preserve, which started on June 25 and was declared out on October 08. It burned a total of 38,790 acres, all of which were on NPS-managed lands. This fire burned the most acreage of NPS-managed lands of any single fire in Alaska in 2024.
Focusing on fires caused by humans or lightning (i.e. not including oil shale fires, which are more likely to burn over winter and have unusual start dates), the start date of the first reported fire was May 24 (Field Of Dreams Fire in Wrangell-St. Elias). The start date of the last reported fire was August 13 (Oxbow Fire in Denali). The 2024 fire season (defined here as the number of days between the first start of a fire and the last start of a fire) lasted 82 days. There is high variability in season length among years, but on average the fire season has been lengthening.

Figure 2 (bottom left): NPS acres burned in each NPS unit in Alaska in 2024 compared with yearly mean NPS acres burned for each unit since 1950. Units with higher/lower than average NPS acres burned are highlighted.
Figure 3 (bottom right): Start dates of first and last reported fires affecting NPS units in Alaska, color-coded by fire cause (human or natural). Trendlines are shown for the first and last start dates grouped by fire cause.
2024 Wildfire and lightning activity in NPS units in Alaska.
Lightning data from AICC (only available 2012 forward). Season duration defined here as number of days any fire was active in a unit.
| NPS Unit | Wildfires | Fires by Cause (Natural/Human) |
Total Acres Burned |
NPS Acres Burned |
Mean Fire Size (acres) |
Largest Fire (acres/name) | Season Duration (days) | Lightning Strikes |
| Alagnak Wild River | 0 | 0 / 0 | 0 | 0 | 0 | 0 | 0 | 1 |
| Aniakchak | 0 | 0 / 0 | 0 | 0 | 0 | 0 | 0 | 4 |
| Bering Land Bridge | 0 | 0 / 0 | 0 | 0 | 0 | 0 | 0 | 2 |
| Cape Krusenstern | 0 | 0 / 0 | 0 | 0 | 0 | 0 | 0 | 19 |
| Denali | 7 | 5 / 2 | 100,900 | 71,436 | 14,414 | 38,790 (Grizzly) | 111 | 2,286 |
| Gates of the Arctic | 2 | 2 / 0 | 568 | 568 | 284 | 369 (Eroded) | 71 | 555 |
| Glacier Bay | 0 | 0 / 0 | 0 | 0 | 0 | 0 | 0 | 10 |
| Katmai | 3 | 2 / 1 | 4,960 | 4,960 | 1,653 | 4,934 (American Creek) | 41 | 151 |
| Kenai Fjords | 0 | 0 / 0 | 0 | 0 | 0 | 0 | 0 | 17 |
| Klondike Gold Rush | 0 | 0 / 0 | 0 | 0 | 0 | 0 | 0 | 0 |
| Kobuk Valley | 0 | 0 / 0 | 0 | 0 | 0 | 0 | 0 | 172 |
| Lake Clark | 1 | 0 / 1 | 0.3 | 0.3 | 0.3 | 0.3 (Current Creek Island) | 45 | 264 |
| Noatak | 4 | 4 / 0 | 14,676 | 14,676 | 3,669 | 8,533 (Tututalak) | 75 | 427 |
| Sitka | 0 | 0 / 0 | 0 | 0 | 0 | 0 | 0 | 0 |
| Wrangell-St. Elias | 1 | 0 / 1 | 0.1 | 0 | 0.1 | 0.1 (Field Of Dreams) | 2 | 451 |
| Yukon-Charley Rivers | 5 | 4 / 1 | 22,950 | 5,826 | 4,590 | 22,944 (Van Hatten) | 155 | 419 |
| All Units | 23 | 17 / 6 | 144,054 | 97,466 | 1,538 | 38,790 (Grizzly) | 155 | 4,778 |
Last updated: April 9, 2025
