Data visualizers present information and results of long-term monitoring. For more information about how the data were collected visit the related monitoring program page under What We Monitor.
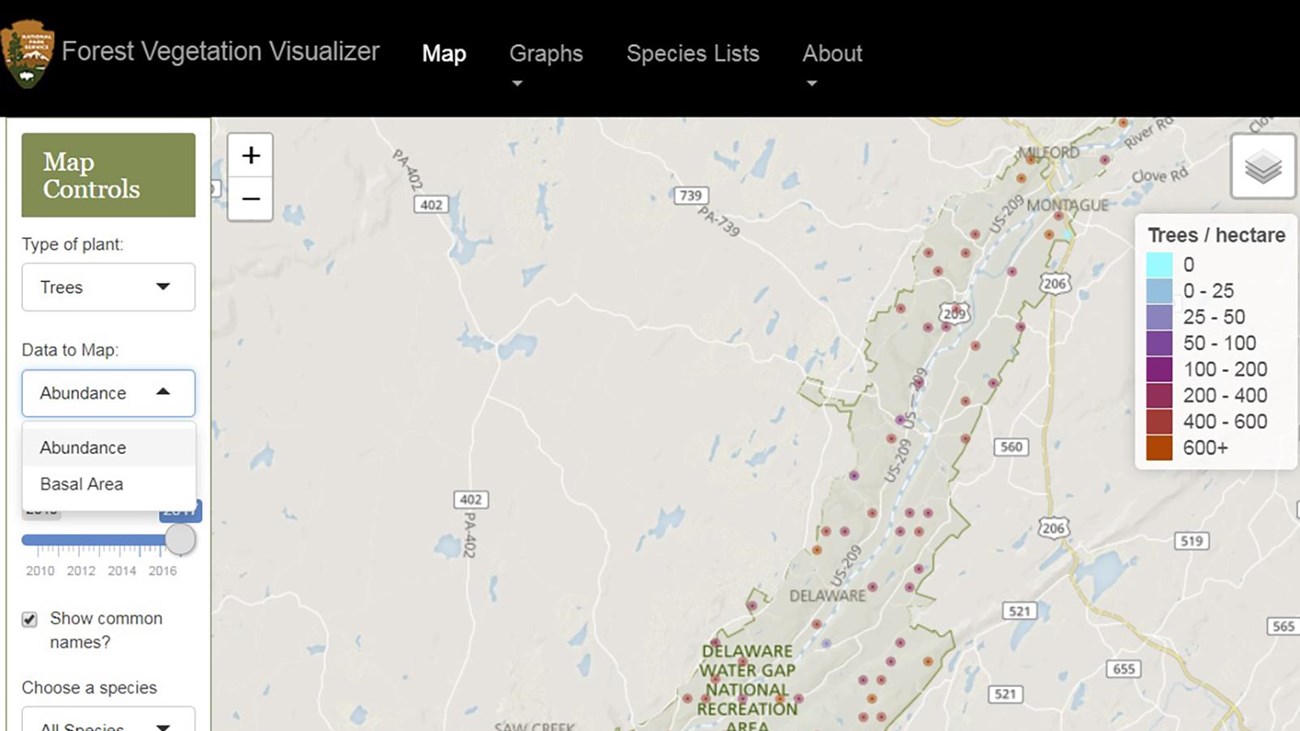
Forest Vegetation Visualizer
Explore maps, graphs, data tables, and species lists.
River Water Quality Visualizers
- Delaware River at Lordville, NY (UPDE)
- Delaware River at Montague, NJ (DEWA)
- Gauley River below Rich Creek at Jodie, WV (GARI)
- New River at Thurmond, WV (NERI)
- Bluestone River near Pipestem, WV (BLUE)
Last updated: September 30, 2022