Mapping Parklands
In their most basic
form, maps show us where things are and how to get there. We pore over
wrinkled road maps on summer vacation. We print out Internet directions
to the nearest post office or supermarket. At the mall, we check the
wall
map to save our tired feet from a wrong turn. In our national parks,
maps
point us to the geyser basin, natural bridge or waterfall we came to
experience.
Maps and geographic information have always served another, larger
purpose
in the National Park Service, to preserve America’s most special places
for our benefit, enjoyment, and education.
In the
early days, cartographers created hand drawings of parks to illustrate
such features as wagon trails, cattle grazing areas, wildfire
perimeters,
battlefield topography, and stream meanderings. Some of the earliest
maps
came from John Wesley Powell and his expedition through the Grand
Canyon
and from the U.S. Army Fifth Cavalry at Yosemite in 1896. Field maps
from
military cartographers and surveyors have helped national parks
recreate
authentic landscapes for visitors to see where their ancestors fought
and
died during the Revolutionary War, War of 1812, and Civil War.
Today, the park
service combines the best of early cartography with the latest
technology
to collect and display geographic information. Relatively new mapping
tools
include GIS software, global positioning systems, satellite photography
and storage of national park maps on computers for easy access and
review.
The park service now spends more than $17 million annually on
geographic
data. It is a grand endeavor of more than 11,000 topographic map sheets
representing more than 84 million acres. The park service and other
partners
together are mapping soils, plant life, geology, and other earth
science
themes at more than 388 national parks. The ongoing program eventually
will produce the first standard set of digital national park base maps.
Using GPS and hand-held
computers in the field, the park service can more accurately pinpoint
locations
of archeological sites, endangered species, and nesting areas and then
download them into GIS maps for review. A GIS map can show the
geographic
relationship of bird nest areas to soils, erosion rates, elevation and
vegetation in that area. The ability to display all the information
layers
on a single map helps park managers as they decide where to release
captive-bred
California condors into the wild, close a trail to protect newborn
bighorn
sheep, or increase patrols against artifact theft.
Most mapping
and geographic studies now extend beyond national park boundaries. They
might display the relationship of the park to streams, coastlines,
glaciers,
rock formations, hazardous waste cleanup sites, and even cities. The
park
service works with several federal agencies and other groups to collect
geographic information using sophisticated sensors on satellites,
aircraft,
balloons, ships, and submarines. Displaying the information on GIS maps
helps the park service compare different types of data. GIS technology
can help park managers predict how various factors, such as drought,
shoreline
changes, or increased thermal activity, might affect a park. The power
of GIS helps us relate, analyze, and model historic and current
features
and phenomena within a particular study area. Without new technology
and
geographic information, the National Park Service would face a
difficult
and sometimes impossible task to measure, map and understand America’s
changing landscape and environment.
Leslie Armstrong,
Chief,
Geographic Information Systems Division
National Park Service
Articles:
Tim Connors, Capitol Reef NP
Geology.....it's not just for scenery
anymore
GIS and cartographic tools are
particularly
important to the geologists working in national parks. Geology, often
scoffed
at as merely being attributable only to scenery, actually play a much
wider
role in the ecosystem. The importance of geology to our everyday
activities
is obvious to the geologist: it ranges from shaping the earth’s surface
to controlling where we eventually settle in communities. With GIS, the
geologist can illustrate the importance of the science of geology to
others,
including soil scientists, botanists, and ecologists, and national park
visitors. Capitol Reef National Park in Utah uses GIS maps help predict
habitat for threatened and endangered species, including Winkler’s
cactus,
Barneby reed-mustard, and Jones cycladenia. The park also found a
direct
link between the presence of several plant species and Navajo
sandstone.
Geologic maps describe underlying conditions of natural systems and are
key in the study of ecosystems, earth history, soils, and environmental
hazards such as fires, landslides, and falling rocks. When combined
with
GIS technology, these maps have advantages over traditional paper
geologic
maps. GIS maps display the relationship between the earth’s surface and
bedrock to data on soil, vegetation, water and other features. It
allows
study of all these features on a single precise map for fast, easy
review
and creates a powerful database. The park service has developed many of
its digital maps using ArcView software developed by ESRI.
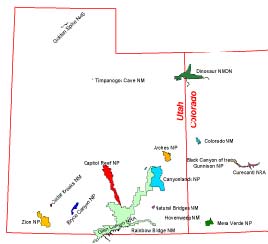
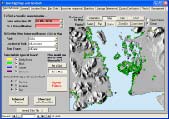
Figure 1. National Park Service
areas
in Utah and western Colorado; Capitol Reef NP shown in red
|
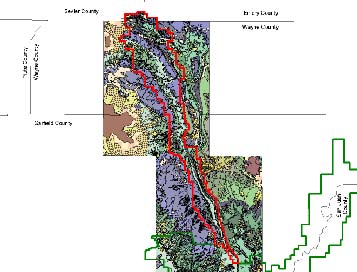
Figure 2. Digital geologic map of
Capitol
Reef NP and surrounding area (produced by NPS Geologic Resources
Inventory
staff from Billingsley, G.H., Huntoon, P.W., Beard, W.J., 1987,
Geologic
Map of Capitol Reef National Park and Vicinity, Utah, Utah Geolog
|
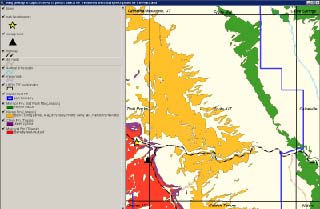
Figure 3. Derivative map showing
occurrence
and distribution of a few threatened and endangered species and their
ties
to geologic units in the Fruita area of Capitol Reef NP.
|
Geology.....it's not just
for scenery
anymore
PDF
Version
Word
Document
|
Click for Technical Article
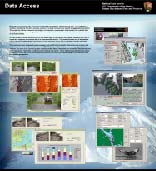
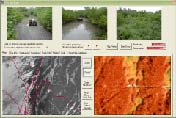
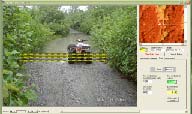
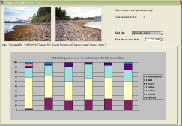
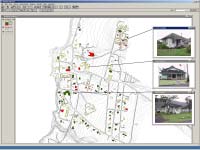
Bill Eichenlaub, Glacier Bay NP
Data Access
Glacier Bay National Park
and Preserve connects us to wild Alaska, now and for all time. Its tidewater
glaciers, deep
fjords, mossy rainforests, rugged coastline, and snow-capped peaks
provide a
living laboratory to explore the natural world. Its diverse landscapes
and
seascapes support wildlife ranging from humpback whales, porpoises, and
harbor
seals, to black bears, wolves, and tufted puffins. A mosaic of plant
life
blankets the coastal and alpine regions, including alder, spruce,
heath, spongy
muskeg, and a few species in areas released from the grip of glaciers.
These
complex ecosystems present park managers with scientific information
ranging
from detailed undersea profiles to the distribution of bear habitat.
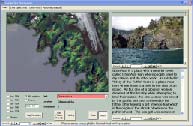
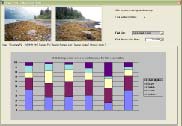
The
national park at Glacier
Bay uses GIS
technology to display complex and voluminous
information in map-enabled databases for fast and easy access to data,
aerial
and ground photographs, sound files, and video. These databases provide
instant
spatial access to tens of thousands of photos, many taken in remote
areas that
the average park manager may never visit. A manager can zoom in on the
map,
click on a point, review all the photos taken there, see graphs of
scientific
data, view a species list specific to that site, even read the notes
taken by
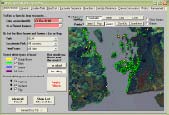
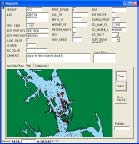
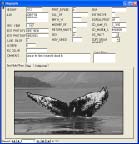
the field crew at the site. One database stores information about the
distribution of whales in Glacier Bay, helping managers decide where and when to
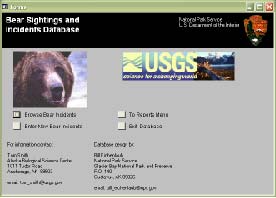
restrict sea-going vessels in the summer tourist season. Another
database on
bear sightings and bear-human interactions helps managers decide when
to close
remote campsites to protect visitors and their belongings. Another
project
includes a talking map that helps Native American students learn the
traditional names of local places and provides them a crucial link to
the
cultural landscapes of Glacier
Bay. These are just
some of the ways the national
park uses databases supported by GIS technology.
Click for Technical Article
Thomas Fake, Kalaupapa NHP
FMSS and LCS Integration at Kalaupapa
NHP
Kalaupapa National Historic Park
contains
the setting for two tragedies in Hawaiian history. The first was the
forced
removal of indigenous people in 1865 and 1895 from an area where they
had
lived for more than 900 years on the island of Molokai. The second was
the forced isolation of thousands of Hawaiians sick with leprosy
between
1866 and 1969, first at Kalawao and then at Kalaupapa. Many surviving
patients
of Hansen’s Disease, or leprosy, still live at Kalaupapa. Hundreds of
historic
buildings remain, and distinct neighborhoods support many activities of
daily life. The National Park Service and state of Hawaii have been
putting
these historic buildings under the park’s care since its creation in
1980.
The park reviewed the historic value of each structure and identified
more
than 200 buildings as a high priority for preservation. ArcView
software
developed by ESRI displayed the location of each historic building on
an
interactive GIS map. The map contains data on the condition of each
building,
and the work and money needed for restoration. The ability to join GIS
data to other databases has given managers a new tool to preserve
history
at Kalaupapa.
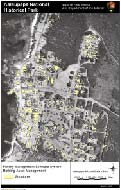
Kalaupapa NHP Facility Management
Software
System (FMSS) Buildings Asset Layer
|
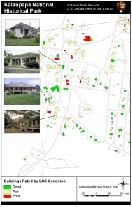
Kalaupapa NHP LCS Condition
Assessment
with Photographs
|
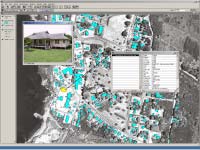
Kalaupapa Settlement Screen Capture
with
ID of Bay View Building 1
|
List of Classified Structures
Condition
Ratings For Buildings with 3 Photo Examples
|
Click for Technical Article
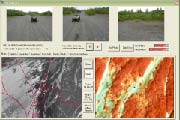
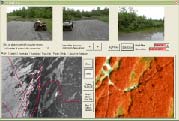
Jess Grunblatt,
Alaska
Support Office
Flexible Image Classification With
ARCGIS
The 15 national parks of Alaska cover
54
million acres of some of the most pristine lands in America. From
glaciers
to grasslands and from polar bears to reindeer, these parks feature an
incredible variety of, habitat, wildlife, and plant species across vast
ecosystems. Mapping the health and analyzing trends in these theses
ecosystems
has become a job for GIS. At Katmai National Park and Preserve, GIS
specialists
used ArcGIS software developed by ESRI, satellite images and other
technology
to map the types of vegetation in a study area of more than 4 million
acres
of rugged, remote wilderness. As a result of this work, Katmai produced
a final, generalized map showing the land cover of the entire park.
These
GIS-based maps help park managers evaluate the condition of ecosystems
and make planning decisions to guide their preservation.
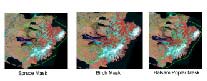
Illustration of species distribution
masks
for Katmai vegetation mapping.
|
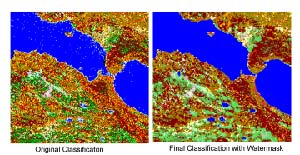
Illustration of water model results
as
implemented for Katmai vegetation mapping.
|
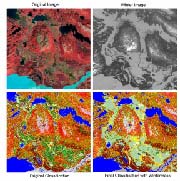
Illustration of winter image model
results
as implemented for Katmai vegetation mapping.
|

Illustration of shadow model results
as
implemented for Katmai vegetation mapping.
|
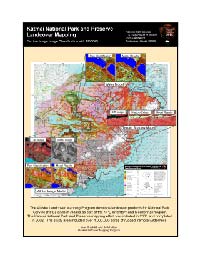
Poster summary of the Katmai
Vegetation
Map including final vegetation map and models.
|
|
Click for Technical Article
John Pinamont, Alaska
Support Office
Map Products
The unique GIS map, “Existing Public
Recreational
Lands in Alaska and Yukon Territory” shows all the public lands of
Alaska
on one sheet. The map provides vital information for regional planning
in the state’s national parks, based on data collected from state and
federal
agencies and the Internet. It is one of a series of digital maps
distributed
to national parks in Alaska that helps scientists and managers use GIS
technology in their daily work. Another popular GIS map shows the
national
parks of Alaska in relation to federally designated “Wild and Scenic
Rivers.”
The park service also produces GIS maps on paper, including several
statewide
maps and a series of park maps for many uses, including wilderness and
fire management.
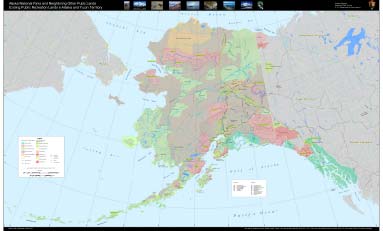
Public Recreation Lands in Alaska
and
Yukon
|
Click for Technical Article
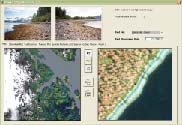
Dave Schirokauer, Point Reyes NS
Enhanced Wetlands Mapping at Point
Reyes National Seashore
Point Reyes National Seashore in
northern
California offers haven to thousands of migratory birds and more than
50
animal species, including elephant seals, gray whales, and tule elk.
Its
ocean views, winding trails, and historic lighthouse offer inspiration
and recreation. Its rare coastal wetlands feature salt, brackish, and
freshwater
marshes, meadows, and seasonal ponds. This national park aims to
preserve,
protect and restore these invaluable wetlands from hazardous material
spills,
failing septic systems, beef and dairy operations, construction, and
from
historic neglect and abuse of the land. As a preservation tool, GIS
technology
helps the National Park Service accurately map the location, size, and
type of wetlands as a way to evaluate environmental damage and plan
restoration.
In one case, field crews identified plant species found in wetlands of
the 4,000-acre Abbotts lagoon. The park displayed the botanical
inventory
on a detailed GIS map for research, planning and public review.
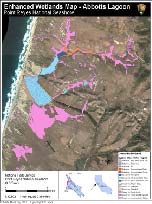
Wetlands in the Abbotts Lagoon
Watershed
displayed with Cowardin System, Class, and Water Regime Modifier
|
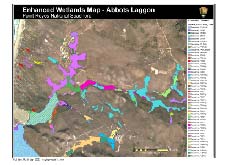
A detail of a portion of the
wetlands
in the Abbotts Lagoon Watershed displayed at the finest level of
thematic
resolution with Cowardin System, and NWI code.
|
Click for Technical Article