National Park Service Use of GIS to Manage
Ecosystems
Ecosystems are as varied as the meadows, glaciers, rivers, canyons and
other resources that make up the National Park Service landscape. The
primary
resource of an ecosystem might be a lake, forest, desert, or a
particular
endangered plant or animal. This makes ecosystems hard to define. They
often include complicated relationships between physical, biological
and
cultural resources. And federal law requires the National Park Service
to preserve ecosystems that often extend beyond protective park
boundaries.
Within this realm, GIS is a great tool to understand ecosystems and
their
importance in our world today.
GIS
software
has changed the way the National Park Service presents information
internally
and to the public. Scientists have long known there is no substitute
for
information and data about resources. But it’s another matter to
display
scientific findings in a simple way that makes common sense to policy
makers
and park visitors. GIS meets this challenge with colorful maps and
posters
packed with information that can illustrate the extent of an ecosystem
and ease the job of describing it.
The
mapping function of GIS illustrates the relationships between
individual
parts of the ecosystem, such as a particular wilderness and the
wildlife
found there. This high-tech tool does simple jobs, such as measuring
areas
and distances, or more complex tasks involving many variables within an
ecosystem. GIS software can produce models that show the slope of land,
precipitation, the kind of soil, and help us understand their impacts
on
the ecosystem. A GIS can illustrate the relationship of an ecosystem to
other areas and lets researchers monitor changes that take place over
time.
Animations or time-series maps offer convincing, understandable
evidence
when these changes happen.
This wealth of information has helped the National Park Service do a
better
job as it preserves our parks. With help from GIS, park managers can
study
and react to potential environmental threats against a park that come
from
the outside. Using GIS, a park manager might propose extending park
boundaries
to include resources deemed critical for the health of an ecosystem.
More
frequently, it helps the National Park Service monitor ecosystems as
part
of its goal to preserve our natural wonders.
Andrew Valdez,Geologist
Great Sand Dunes National Monument and
National Preserve
Articles:
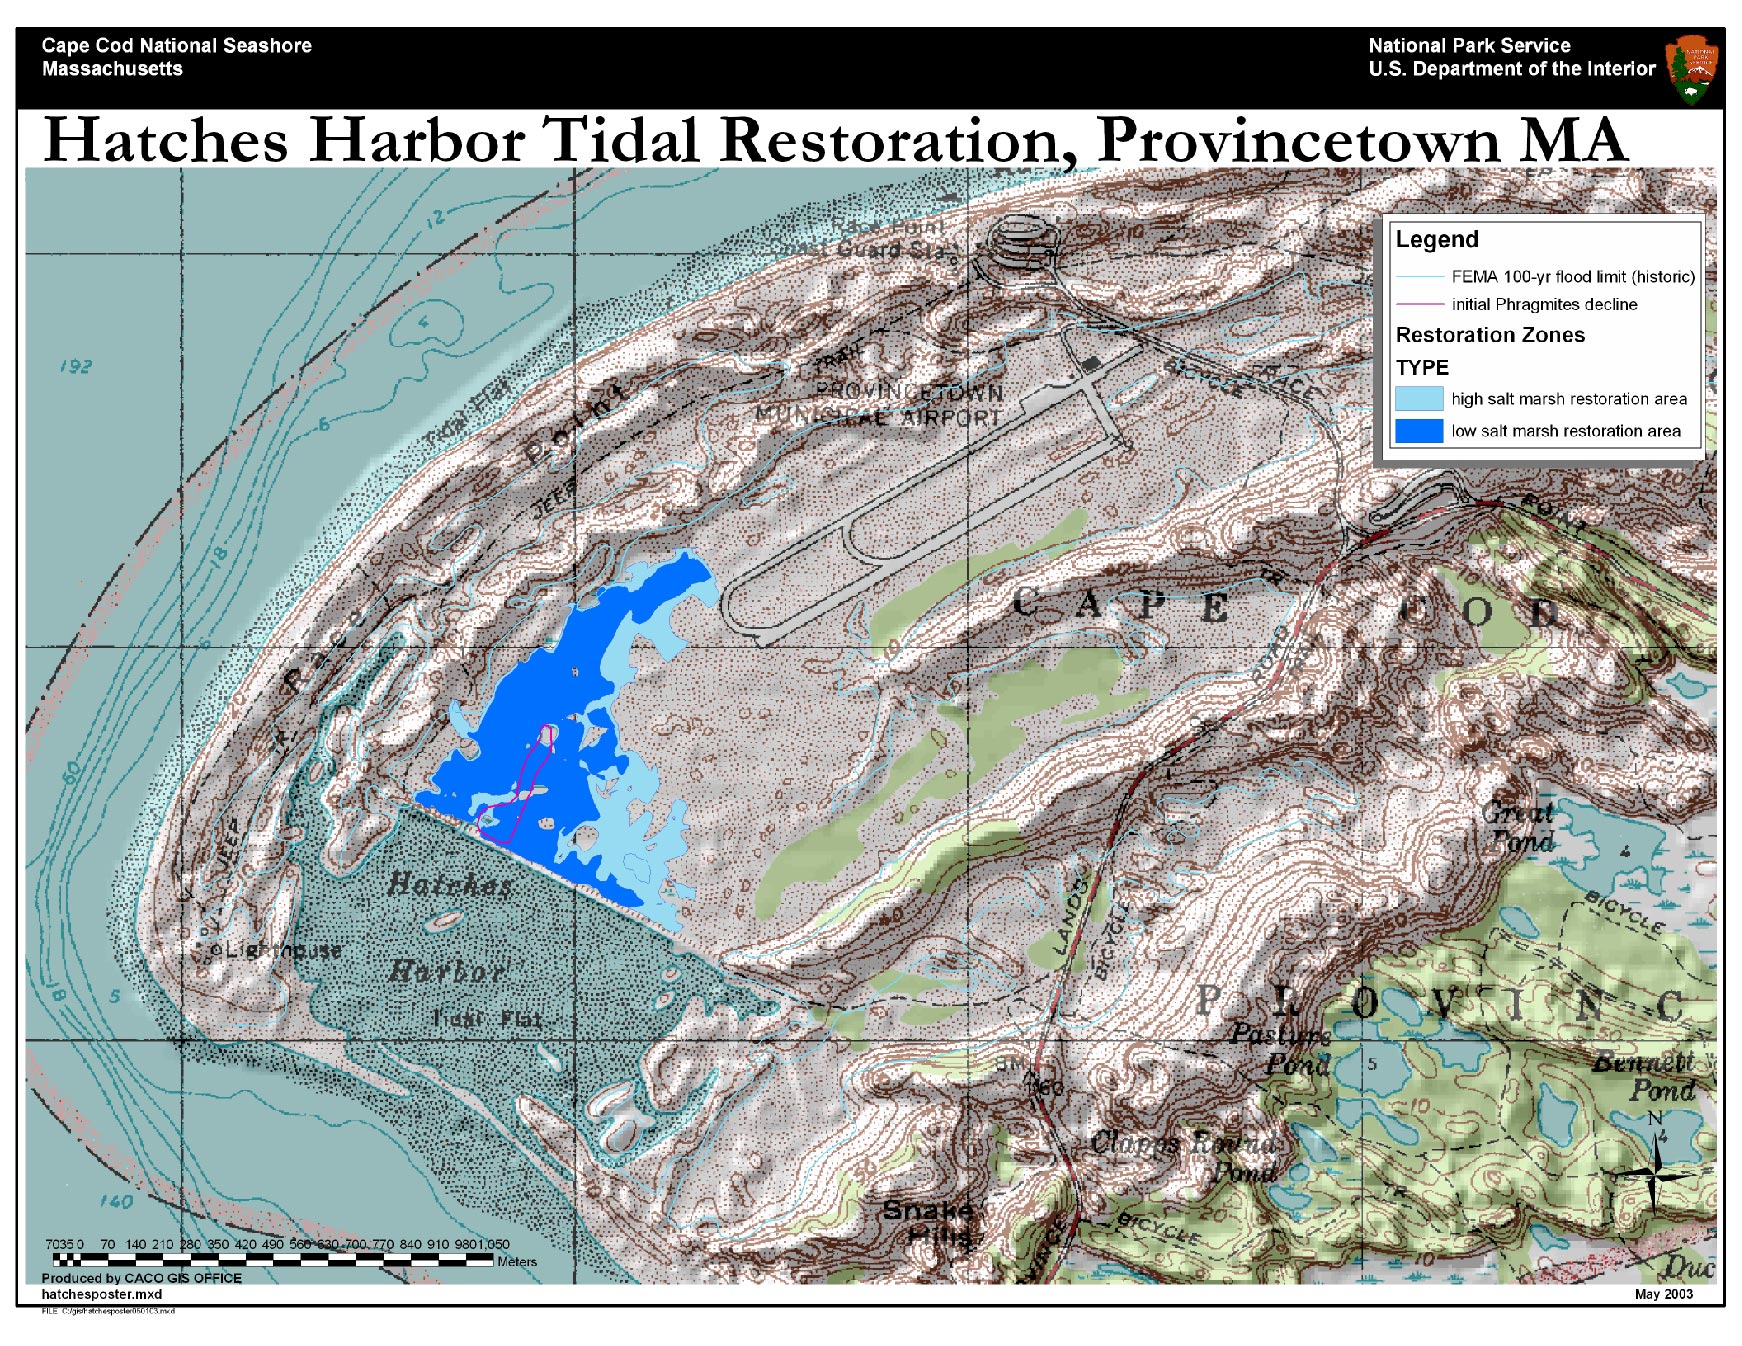
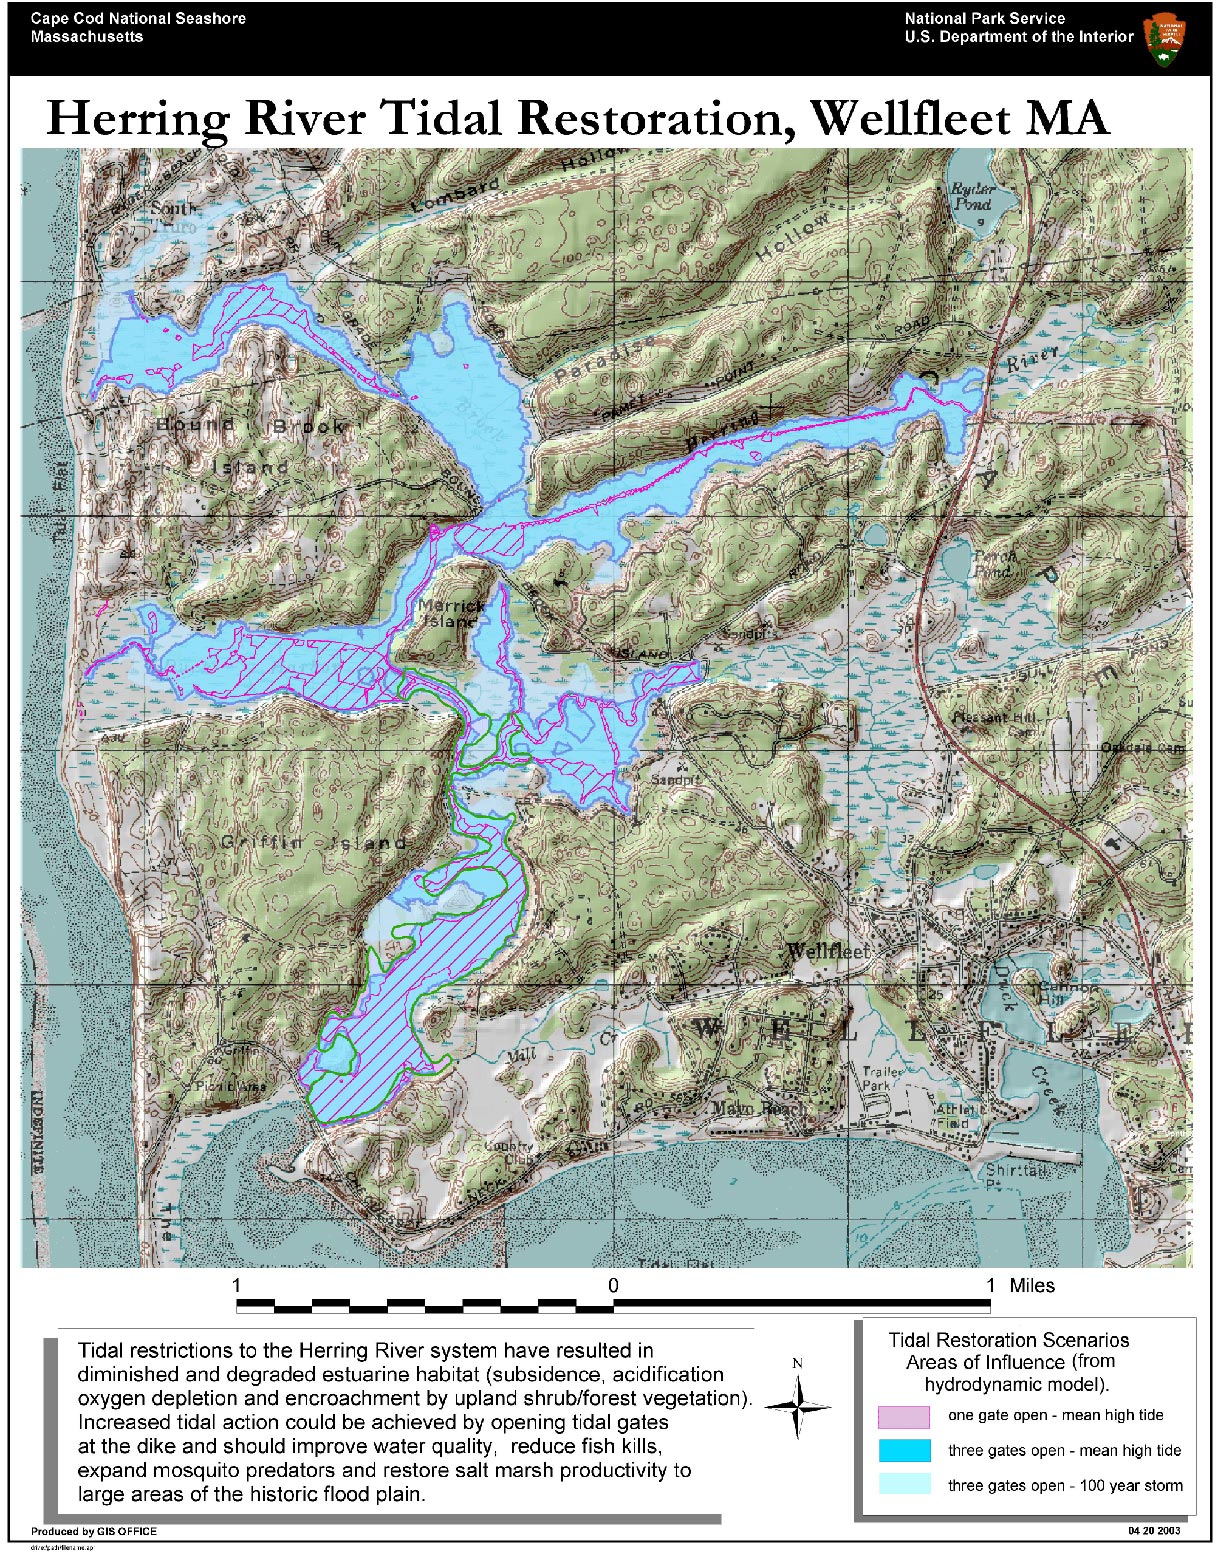
Mark Adams and John Portnoy, Cape Cod
NS
Restoration of Historically Restricted
Estuaries, Cape Cod National Seashore, Massachusetts
Historical misunderstandings and a lack
of appreciation for Atlantic Coast estuaries and salt marshes have led
to their widespread draining and development. Federal law created Cape
Cod National Seashore in 1961 to protect some of these areas for
recreation,
conservation and scientific study. Even
so, the National Park Service must overcome an array of obstacles to
restore
salt marshes damaged by fragmented ownership, development, and lack of
knowledge about human impacts. At the National Seashore, GIS, global
positioning
systems, and other technology tools help to restore tidal salt marshes
and estuaries at Hatches Harbor, East Harbor, and Herring River. GIS
maps
display the geographic relationship between vegetation, wildlife,
coastal
waters, and tidal floodplain elevation, and help specialists predict
the
impact of tides flowing through culvert openings.
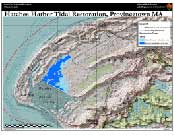
At Hatches Harbor,
the National Park Service in cooperation with local, state and federal
agencies is restoring a native salt marsh to a level that won’t
compromise
safety at the nearby municipal airport. GIS specialists are mapping
tide
heights; deposits of sand, rocks, and other particles; mosquitoes,
salinity,
flooding duration and other themes that will help guide restoration
strategy
over decades. On the Herring River, scientists are restoring natural
salt
marshes that existed for thousands of years before European settlement
interrupted the natural cycle with the placement of dikes starting in
the
1700s. By 1910, dikes designed to reduce mosquitoes at the river mouth
instead caused most of the original marshlands to disappear. The long
history
of dikes, drains, and depletion of oxygen in the water helps cause fish
kills, reduces fish and shellfish populations, and hurts water quality.
The mosquito thrives with fewer predators around. The program to
restore
the marshland should improve wildlife and fish habitat and leave fewer
mosquitoes. GIS technology is expected to help make this happen by
modeling
solutions to prevent saltwater intrusion into wells and flooding of a
nearby
golf course. Displaying data and models on GIS maps will play a big
part
in helping scientists solve these and other restoration issues on the
national
seashore.
Main Poster
|
Map of herring river restoration areas
|
Map of hatches harbor restoration areas
|
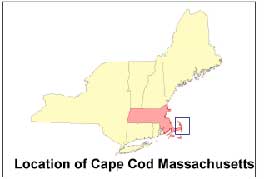
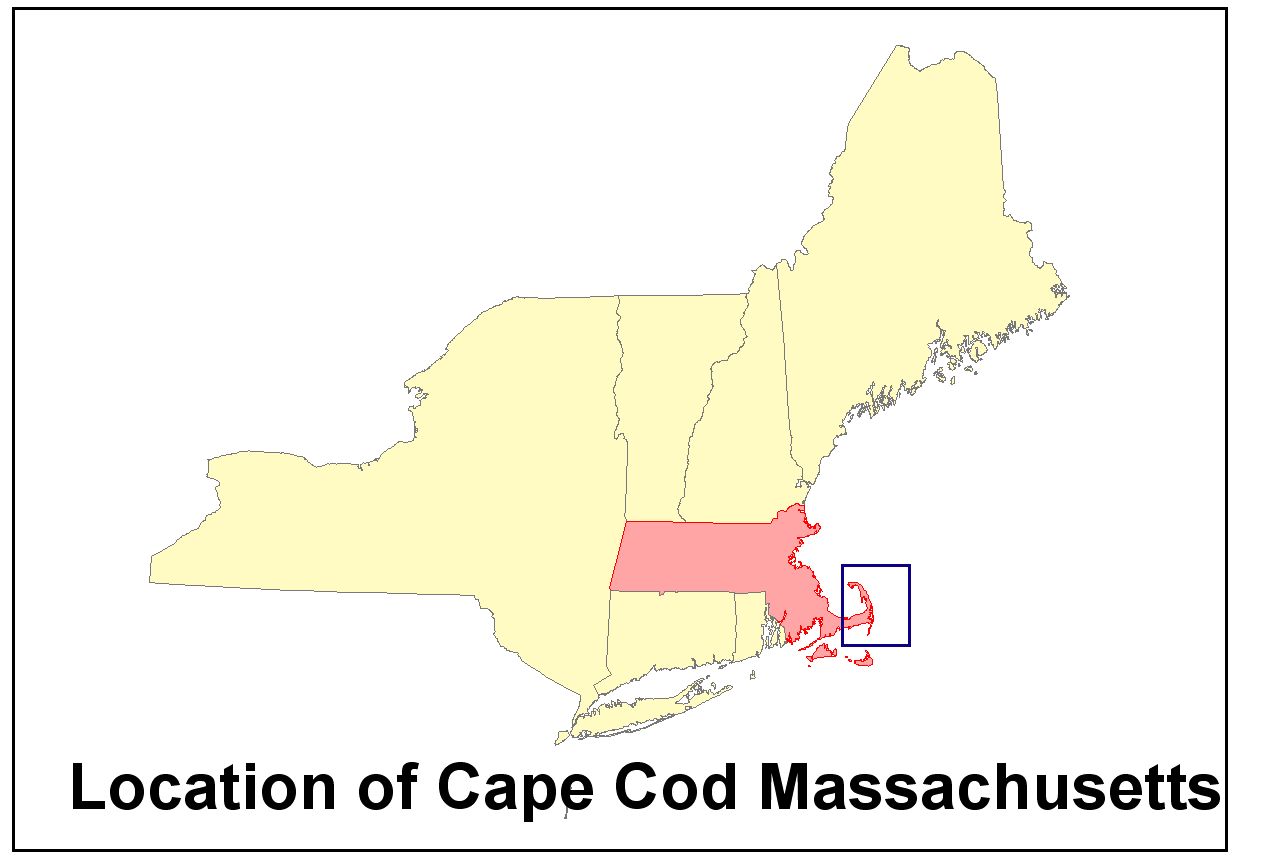
Location map of Cape Cod within the New England states
|
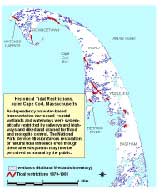
Cape Cod tidal restrictions context map
|
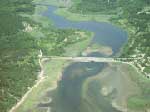
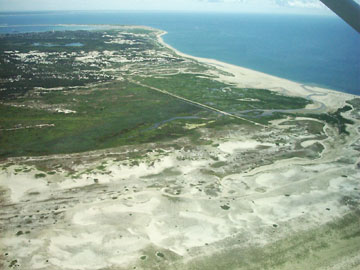
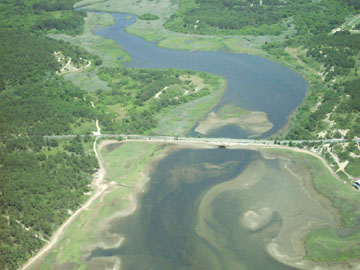
Aerial photo of herring river with tidal restriction (dike)
|
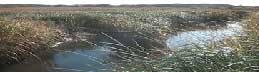
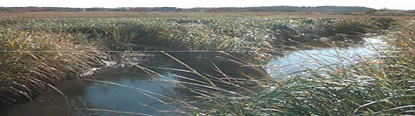
Photo of typical natural salt marsh (Spartina alterniflora) channel.
|
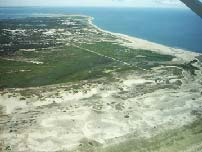
Aerial photo of hatches harbor with tidal restriction (dike)
|
Click for Technical Article
Greg Daniels, Alaska Region
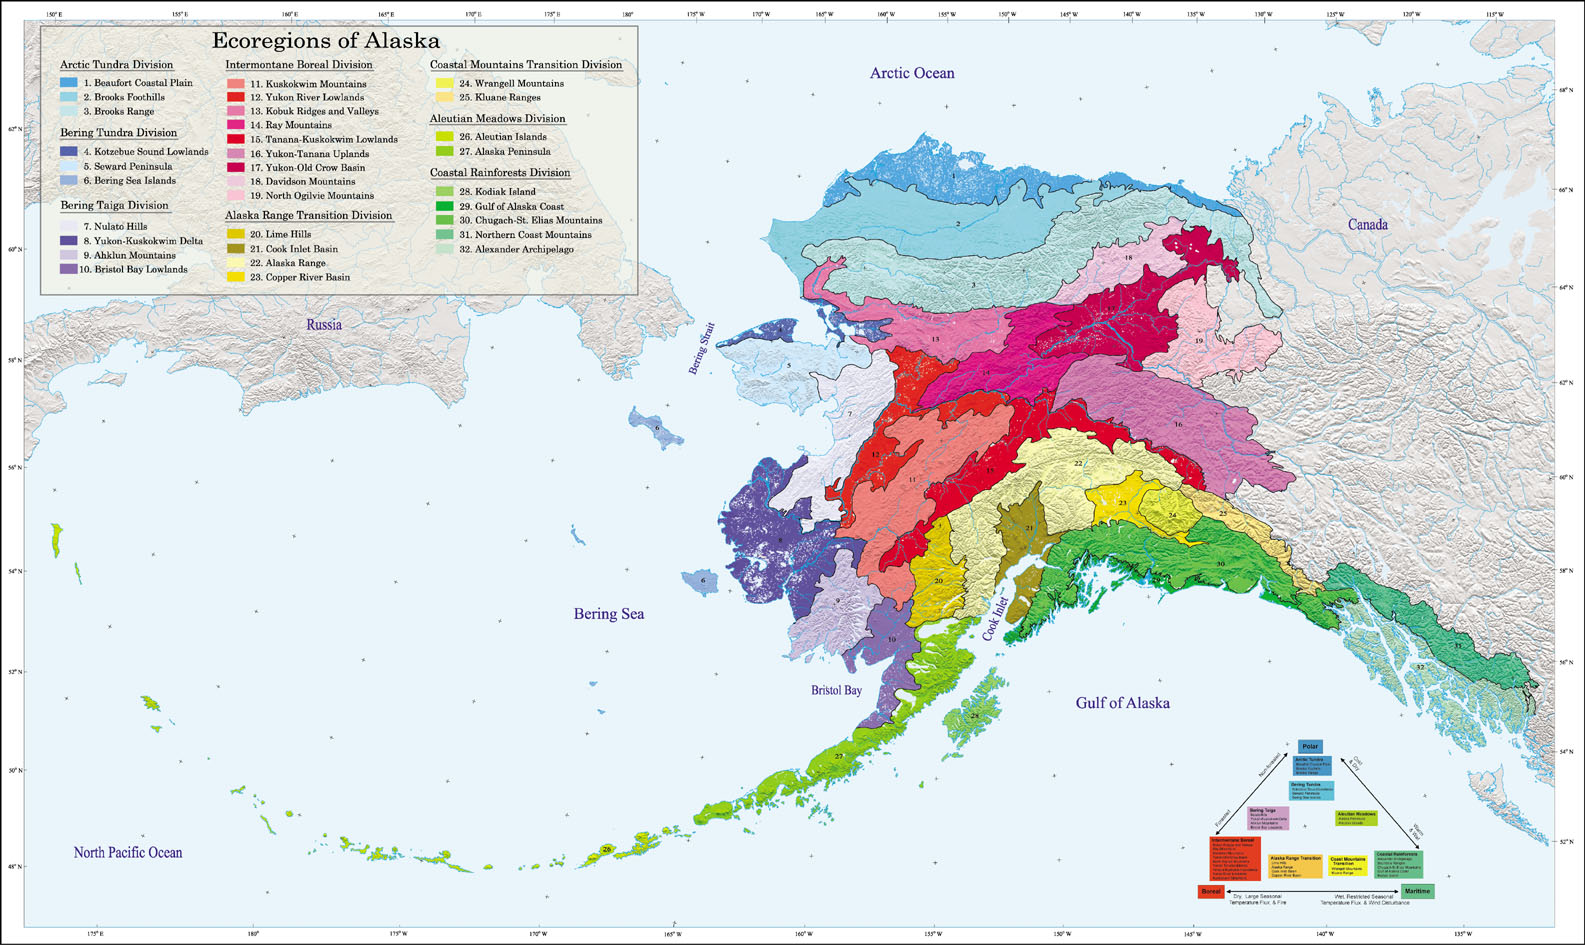
Unified Ecoregions of Alaska
Scientists with hundreds of years
of experience in Alaska have produced a GIS-based map that displays the
major ecosystems of the state for research, planning, and to help us
protect,
understand, and enjoy the values of this vast landscape. The
international
effort brought together and expanded on earlier mapping efforts dating
to the Cold War. The new map portrays ecosystems as they span
international
boundaries, in nearby Canada and Russia. The map identifies ecosystems
primarily by their climate and shape of the land, or topography.
Scientists
wanted the new map to ease confusion over the need to use and compare
several
different mapping and classification systems in their research, and to
improve communication among agencies. The new map draws on relatively
new
tools such as satellite photography, global positioning systems,
computers,
and GIS software, for accuracy and easy review. The final map, with
multiple
layers of geographic information, represents the collective wisdom of
nearly
50 scientists and advice from local experts. From the map, researchers
and the public can learn about temperature, precipitation, the rugged
nature
of the land, plants, wildlife, glaciers, and other features. It has
become
an important tool to understand the individual parts of the ecosystems
and how those parts relate to each other and to the region as a whole.
It provides an exceptional “Virtual Ecological Tour” of Alaska’s
national
parks.
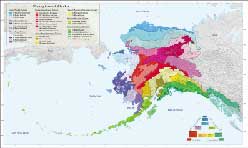
Ecological Regions of Alaska
|
Click for Technical Article
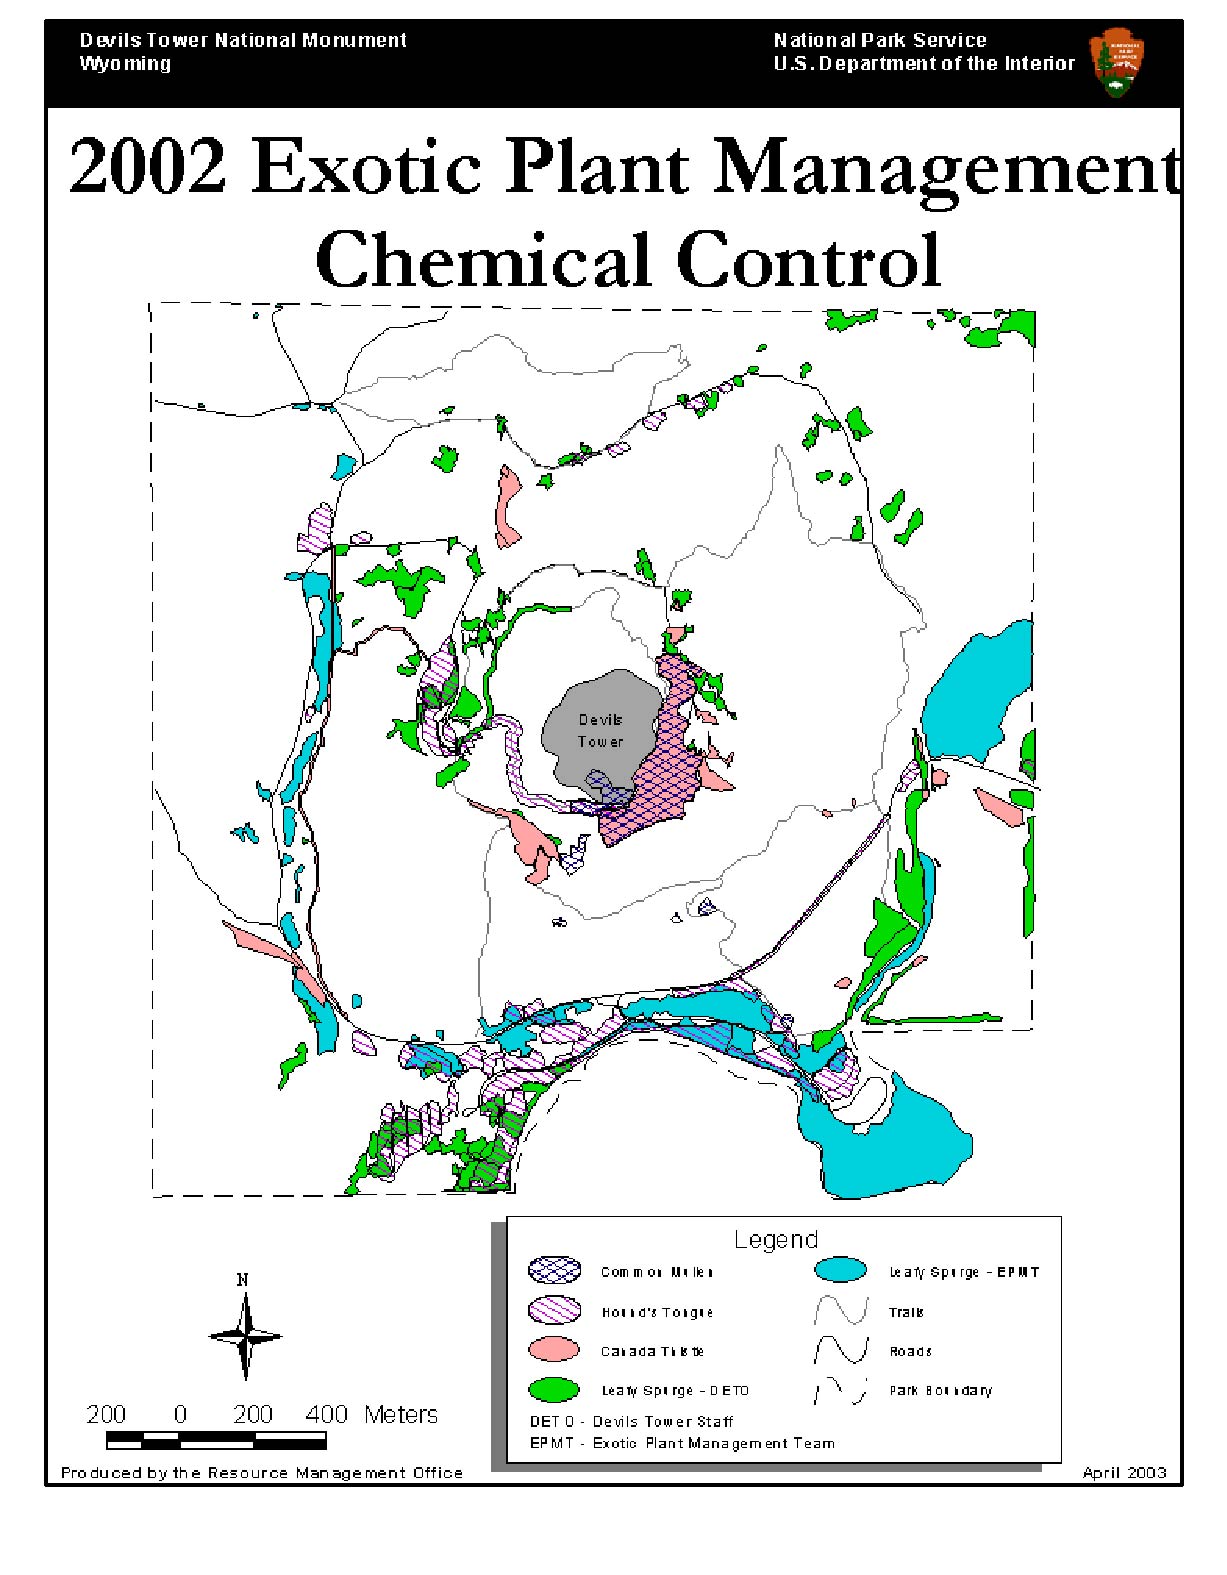
Ann Hebig, Devils Tower NM
2002 Exotic Plant Management - Chemical
Control
President Theodore Roosevelt designated
Devils Tower as the nation’s first national monument in 1906,
recognizing
the rock formation in the Black Hills of Wyoming as one of the most
remarkable
peaks in the country. Yet noxious weeds and other exotic plants in the
monument have disrupted the natural process of fire, hydrology and the
renewal of carbon, water, nitrogen, and other nutrients. The weeds also
hurt native plant and wildlife populations. The park aims to control
these
harmful plants to protect the monument, prevent their spread, and
preserve
the natural view for visitors. The park’s weed-fighting arsenal
includes
the release of flea beetles and other bugs, herbicides, and the removal
of exotic plants near development, roads, and trails. It also includes
high-tech tools such as ArcView software developed by ESRI. Using data
collected from global positioning systems, ArcView produces GIS maps
that
help the park visualize the distribution of exotic plants and their
treatment
in the monument.
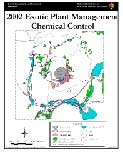
ArcView 3.3 layout of 2002 chemical treatment of exotic plants at
Devils
Tower National Monument.
|

Example of the type of backpack sprayer used at Devils Tower to treat
exotic plants with herbicide.
|
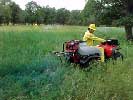
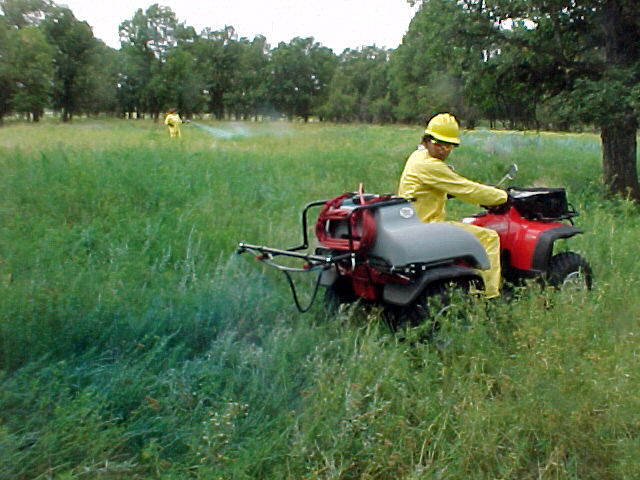
Digital photo of Devils Tower staff spraying leafy spurge using a boom
mounted on an ATV.
|

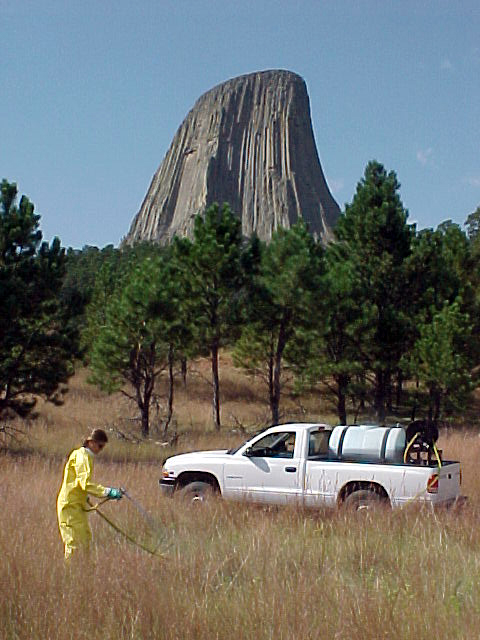
Digital photo of Devils Tower staff spraying hound's tongue using a
high-capacity hand-gun sprayer mounted on a pickup.
|
Click for Technical Article
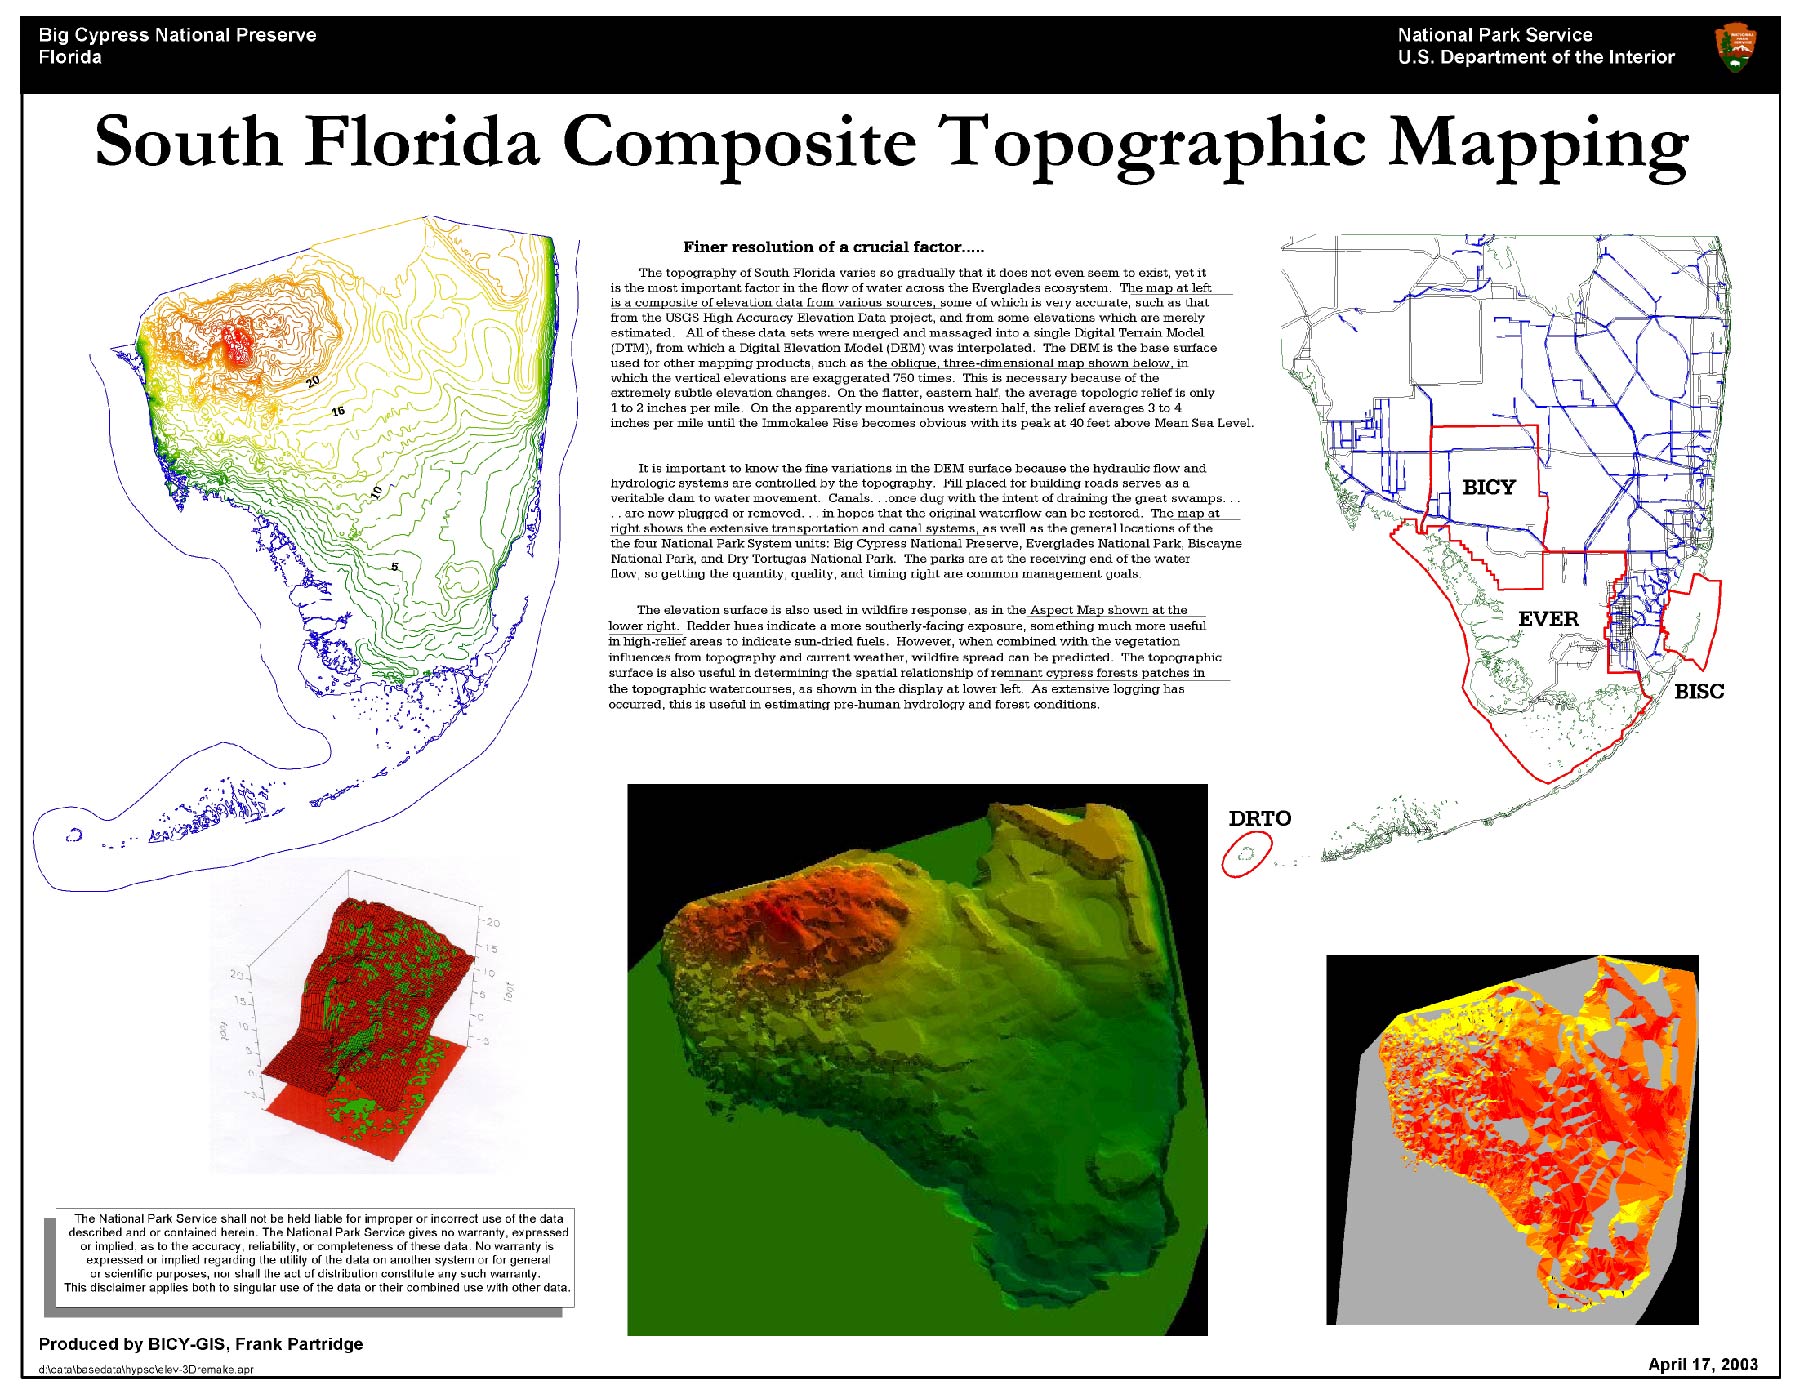
Frank Partridge, Big Cypress National
Preserve
South Florida Composite Topographic
Mapping
The broad movement of water across a
nearly
flat surface dominates the famous Everglades ecosystem in Florida. The
celebrated “River of Grass” flows seaward through grass marshes and
cypress
forests, reaching a width of 30 miles in some places. Yet for more than
a century, dams, dikes, levees, canals, railways, and roads have
affected
the natural flow, direction, volume, and quality of the river. In
recent
years, we found that the natural flow of the river is the healthy
system,
beneficial to plants, animals, and the future of our world. The
National
Park Service and other parties involved are trying to restore the
original
conditions, despite the massive scale of change that has occurred. In
this
process of restoration, some believe the greatest information challenge
is the ability to depict the topographic surface in ways that allow
meaningful
analysis to make decisions. Maps that show contours of one meter proved
largely useless for all but the overview. To meet the challenge, the
park
service created GIS-based maps that allow topographic contours of
one-tenth
of a foot. The mapping effort relied on federal, state, and private
databases,
each varying in extent and accuracy. GIS specialists combined the
datasets
using automated and hand-drawn contouring to create a region-wide
topology
for analysis. The affected region includes four national parks, Big
Cypress
National Preserve, Biscayne National Park, Dry Tortugas National Park,
and Everglades National Park. Dozens more protected areas are on the
receiving
end of this lazy yet tenacious water pipeline, making it crucial to
understand
the pathways of water from its sources to the sea.
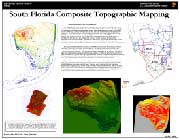
Big Cypress N.Pres., topographic mapping
|
Click for Technical Article
Phoebe Vanselow and Sharman Lewis, Glacier
Bay NP
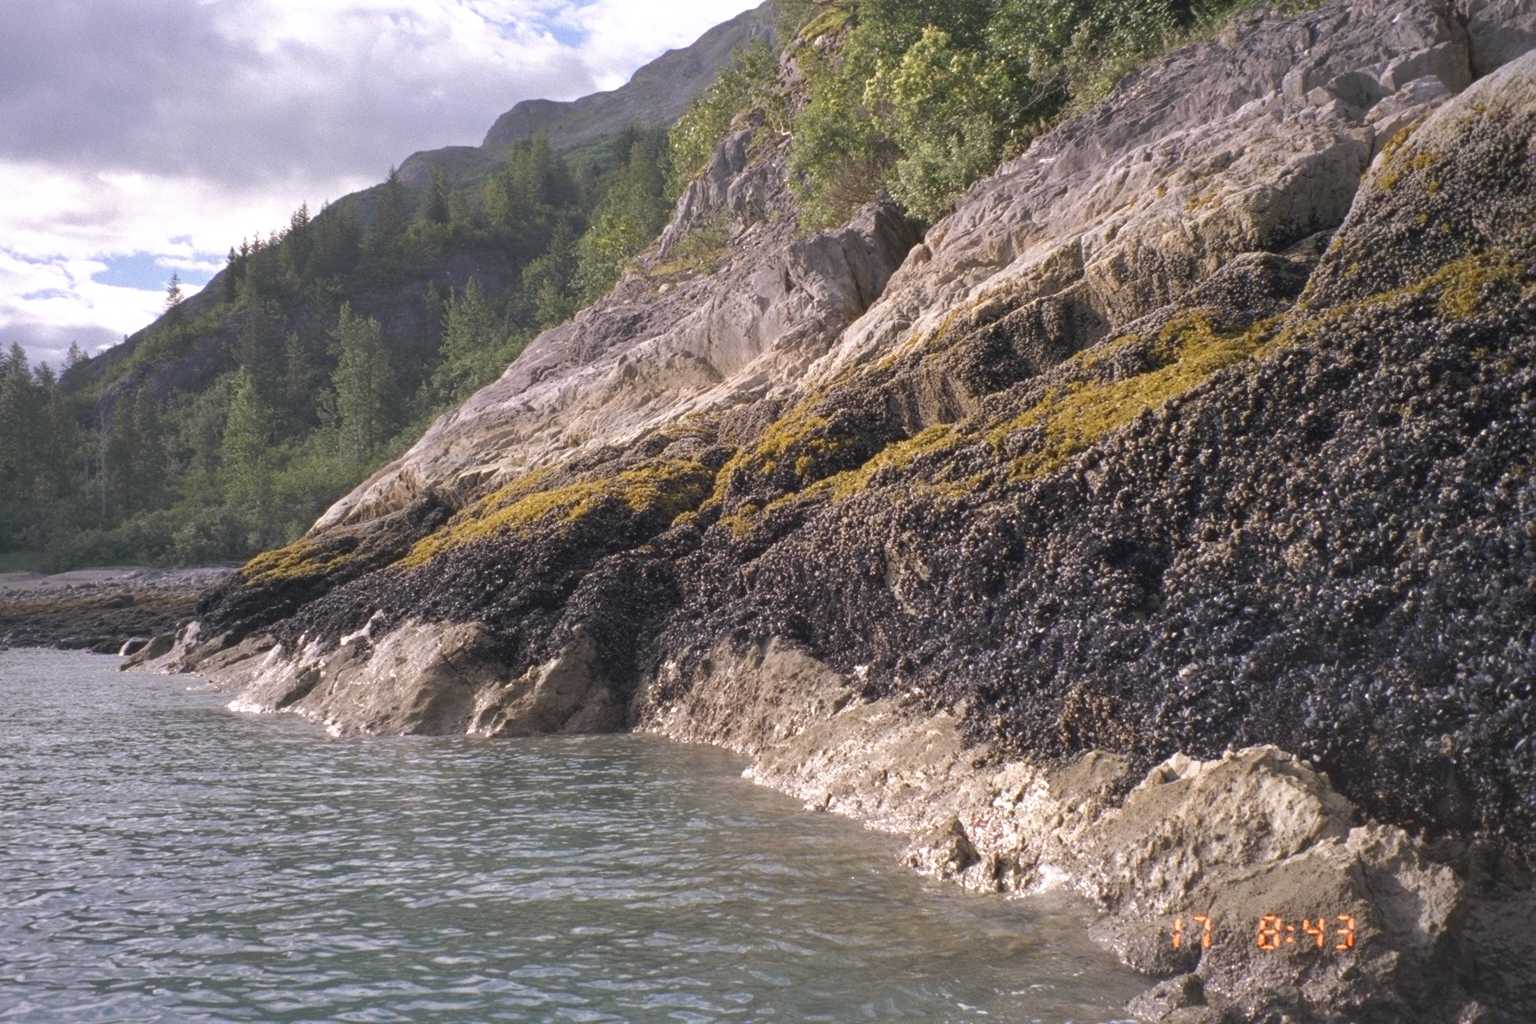
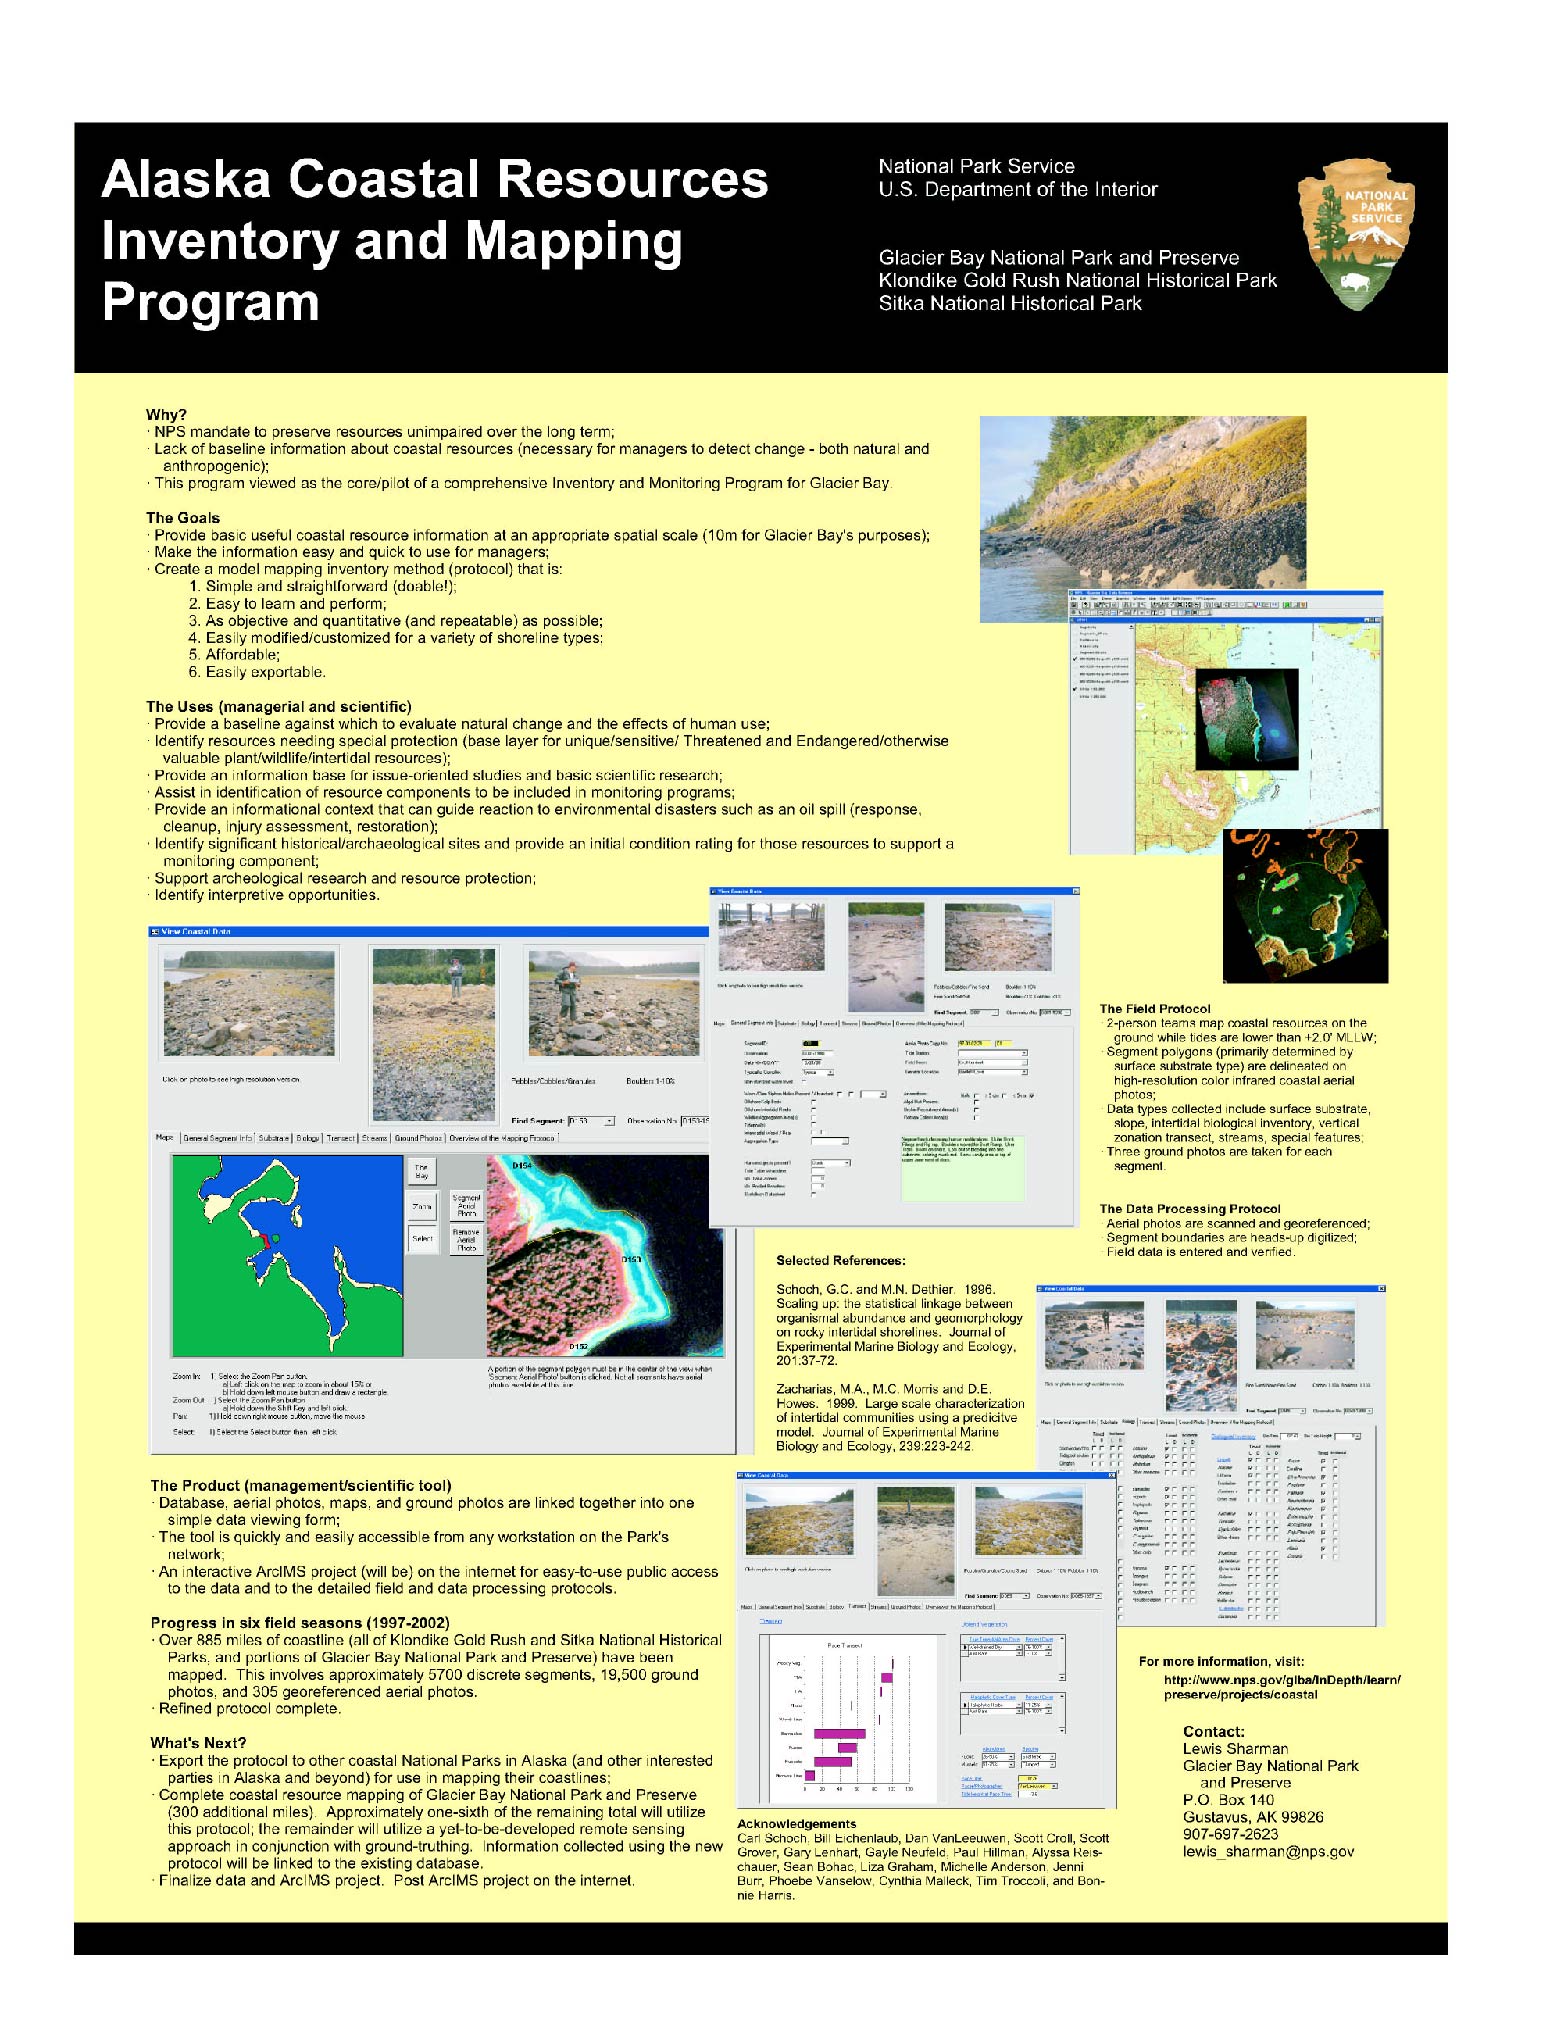
Alaska Coastal Resources Inventory
and Mapping Program
A high-tech mapping program in Alaska
offers
national park managers and the public easy access to geographic
information
about coastal areas, for purposes of research, education, management,
and
preservation. The program at Sitka National Historic Park, Klondike
Gold
Rush National Historic Park, and Glacier Bay National Park and Preserve
displays the information on colorful GIS maps for easy review. The maps
display data to help mangers evaluate changes in the coastline,
determine
areas needing special protection, plan for environmental disasters,
study
historical and archeological sites, and explain park features to the
public.
The GIS maps show more than 885 miles of coastline within the three
parks
and draw from 19,500 ground photographs and 305 aerial photographs. GIS
technology combines databases, photos, and maps into one visual display
to help managers and researchers guide and preserve the parks.
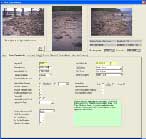
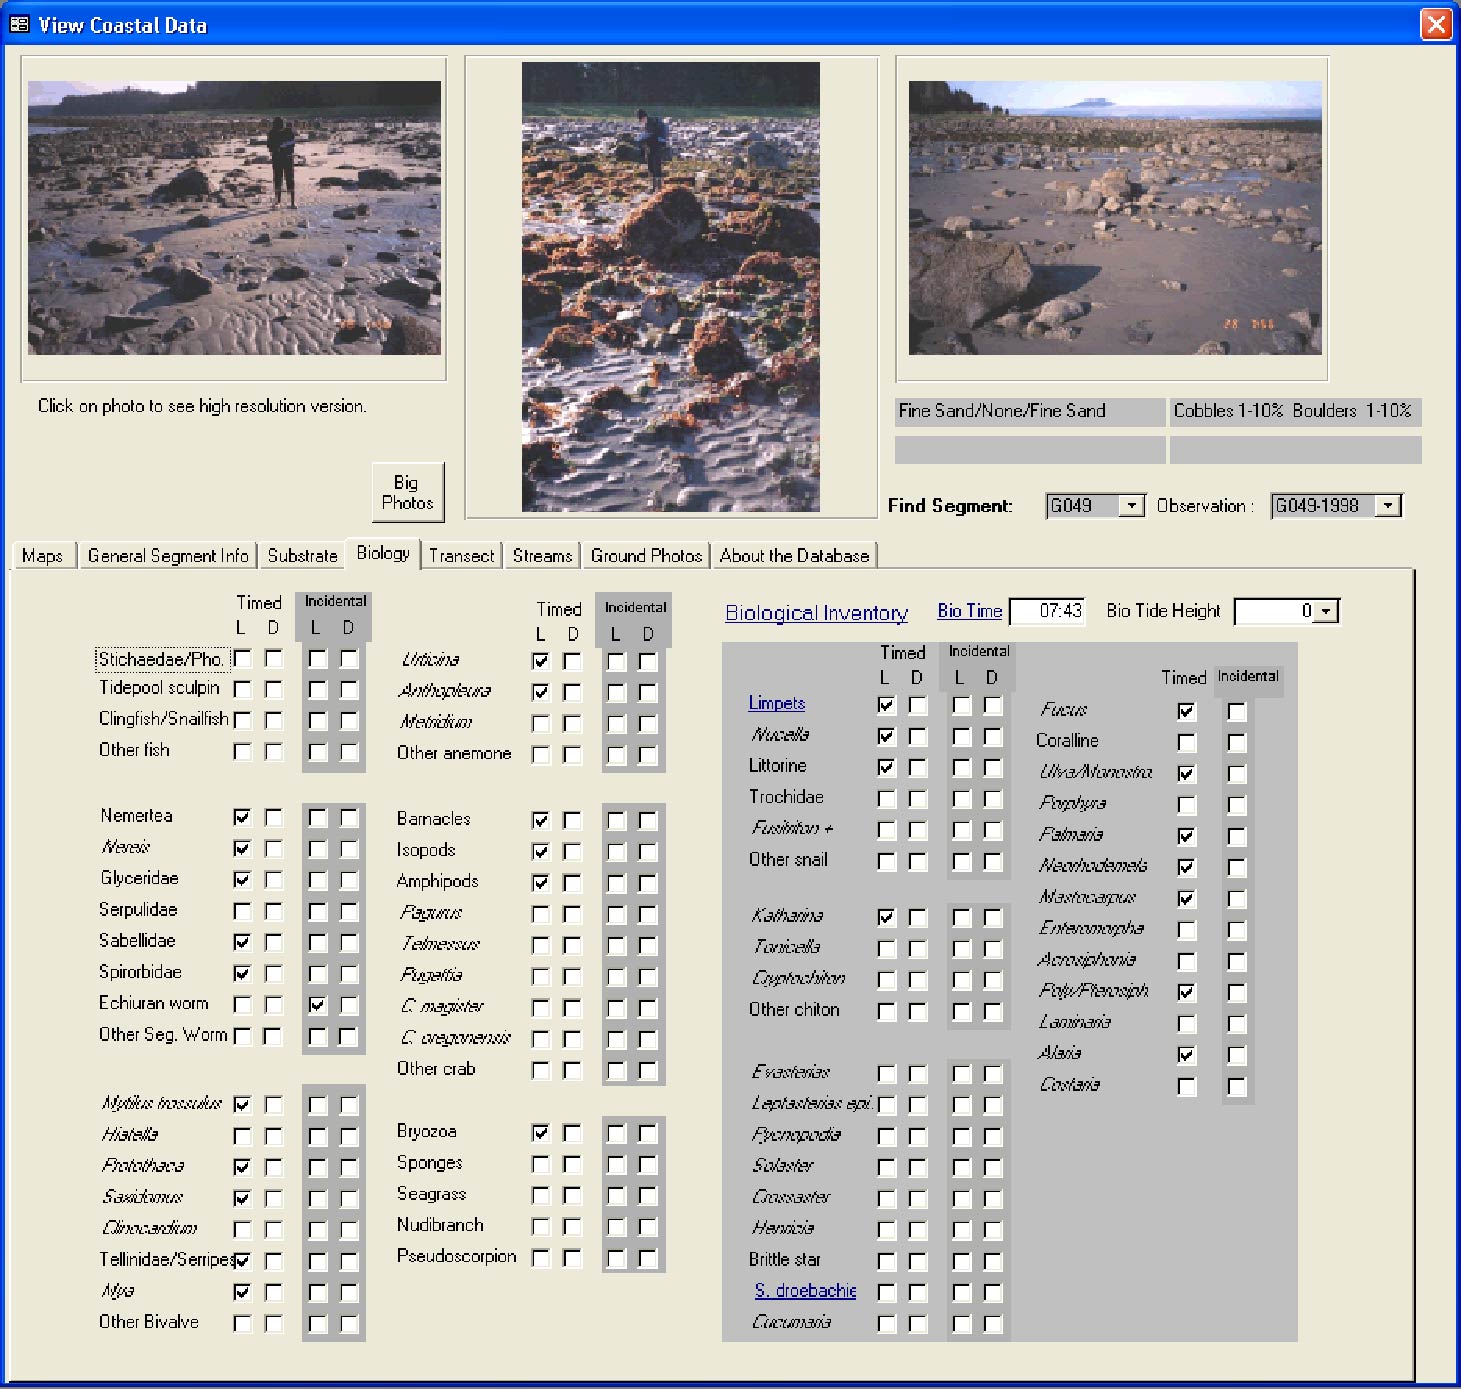
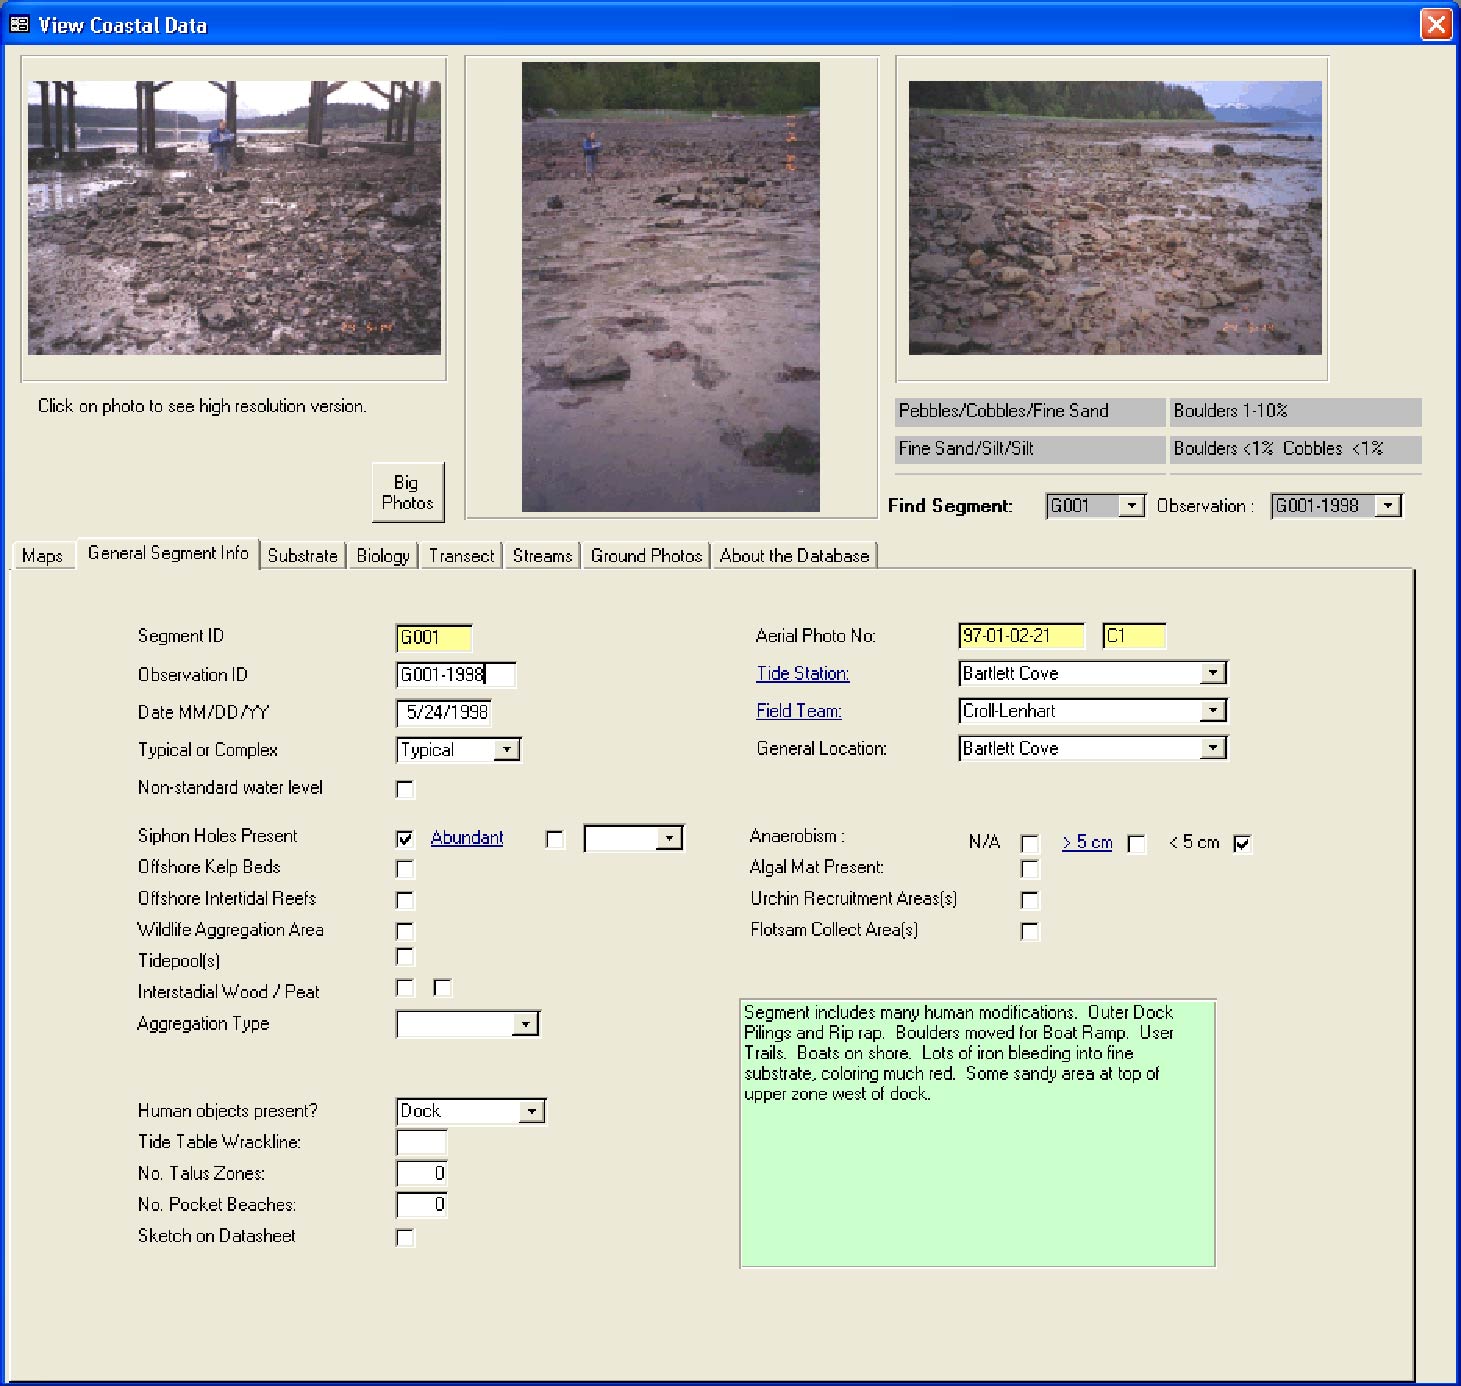
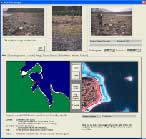
View of database showing general information about a shoreline segment
and displaying ground photos taken at the segment.
|
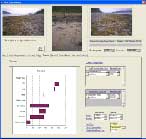
View of database showing graphical display of a pace transect capturing
information about vertical zonation in a shoreline segment and
displaying
ground photos taken at the segment.
|
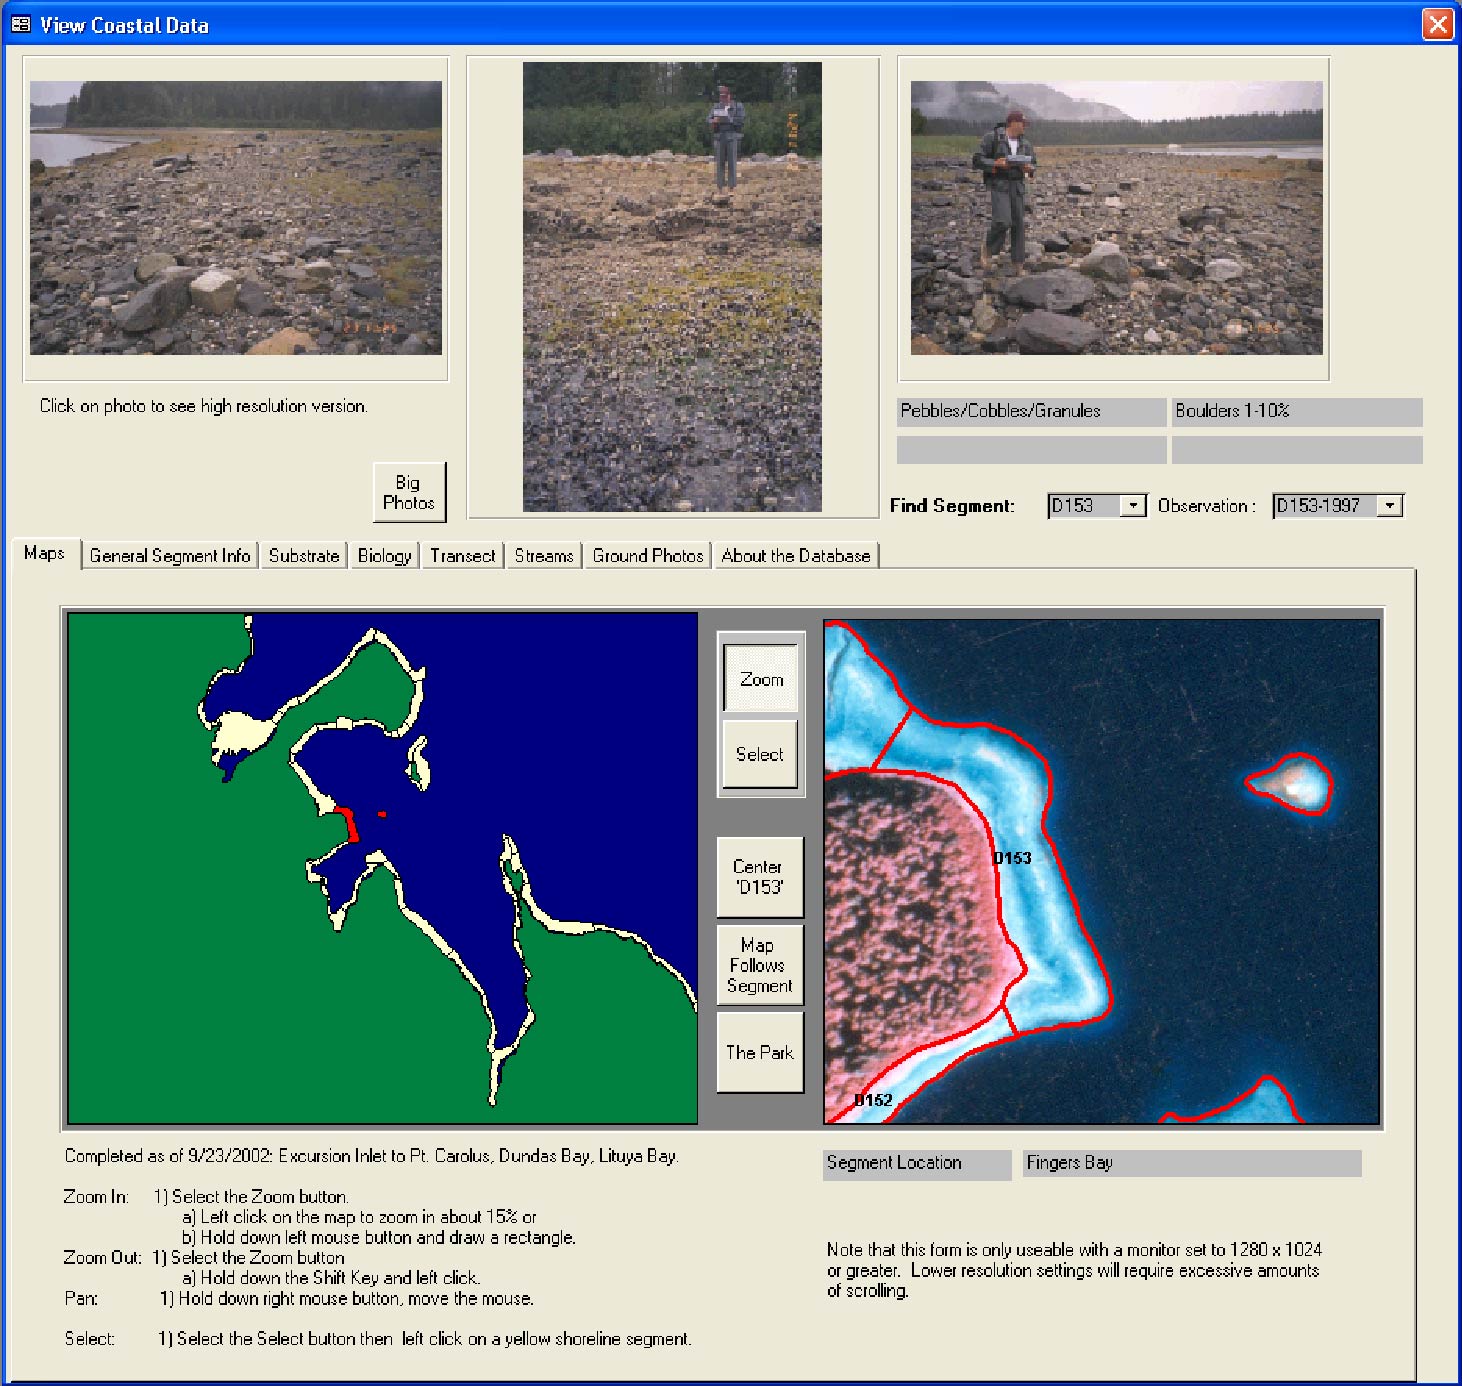
View of database showing the map tool that allows the user to select
a shoreline of interest. The view shows the location of a selected
shoreline
segment polygon and displays its infrared aerial photo and ground
photos
taken at the segment.
|
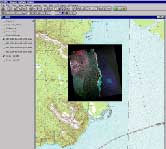
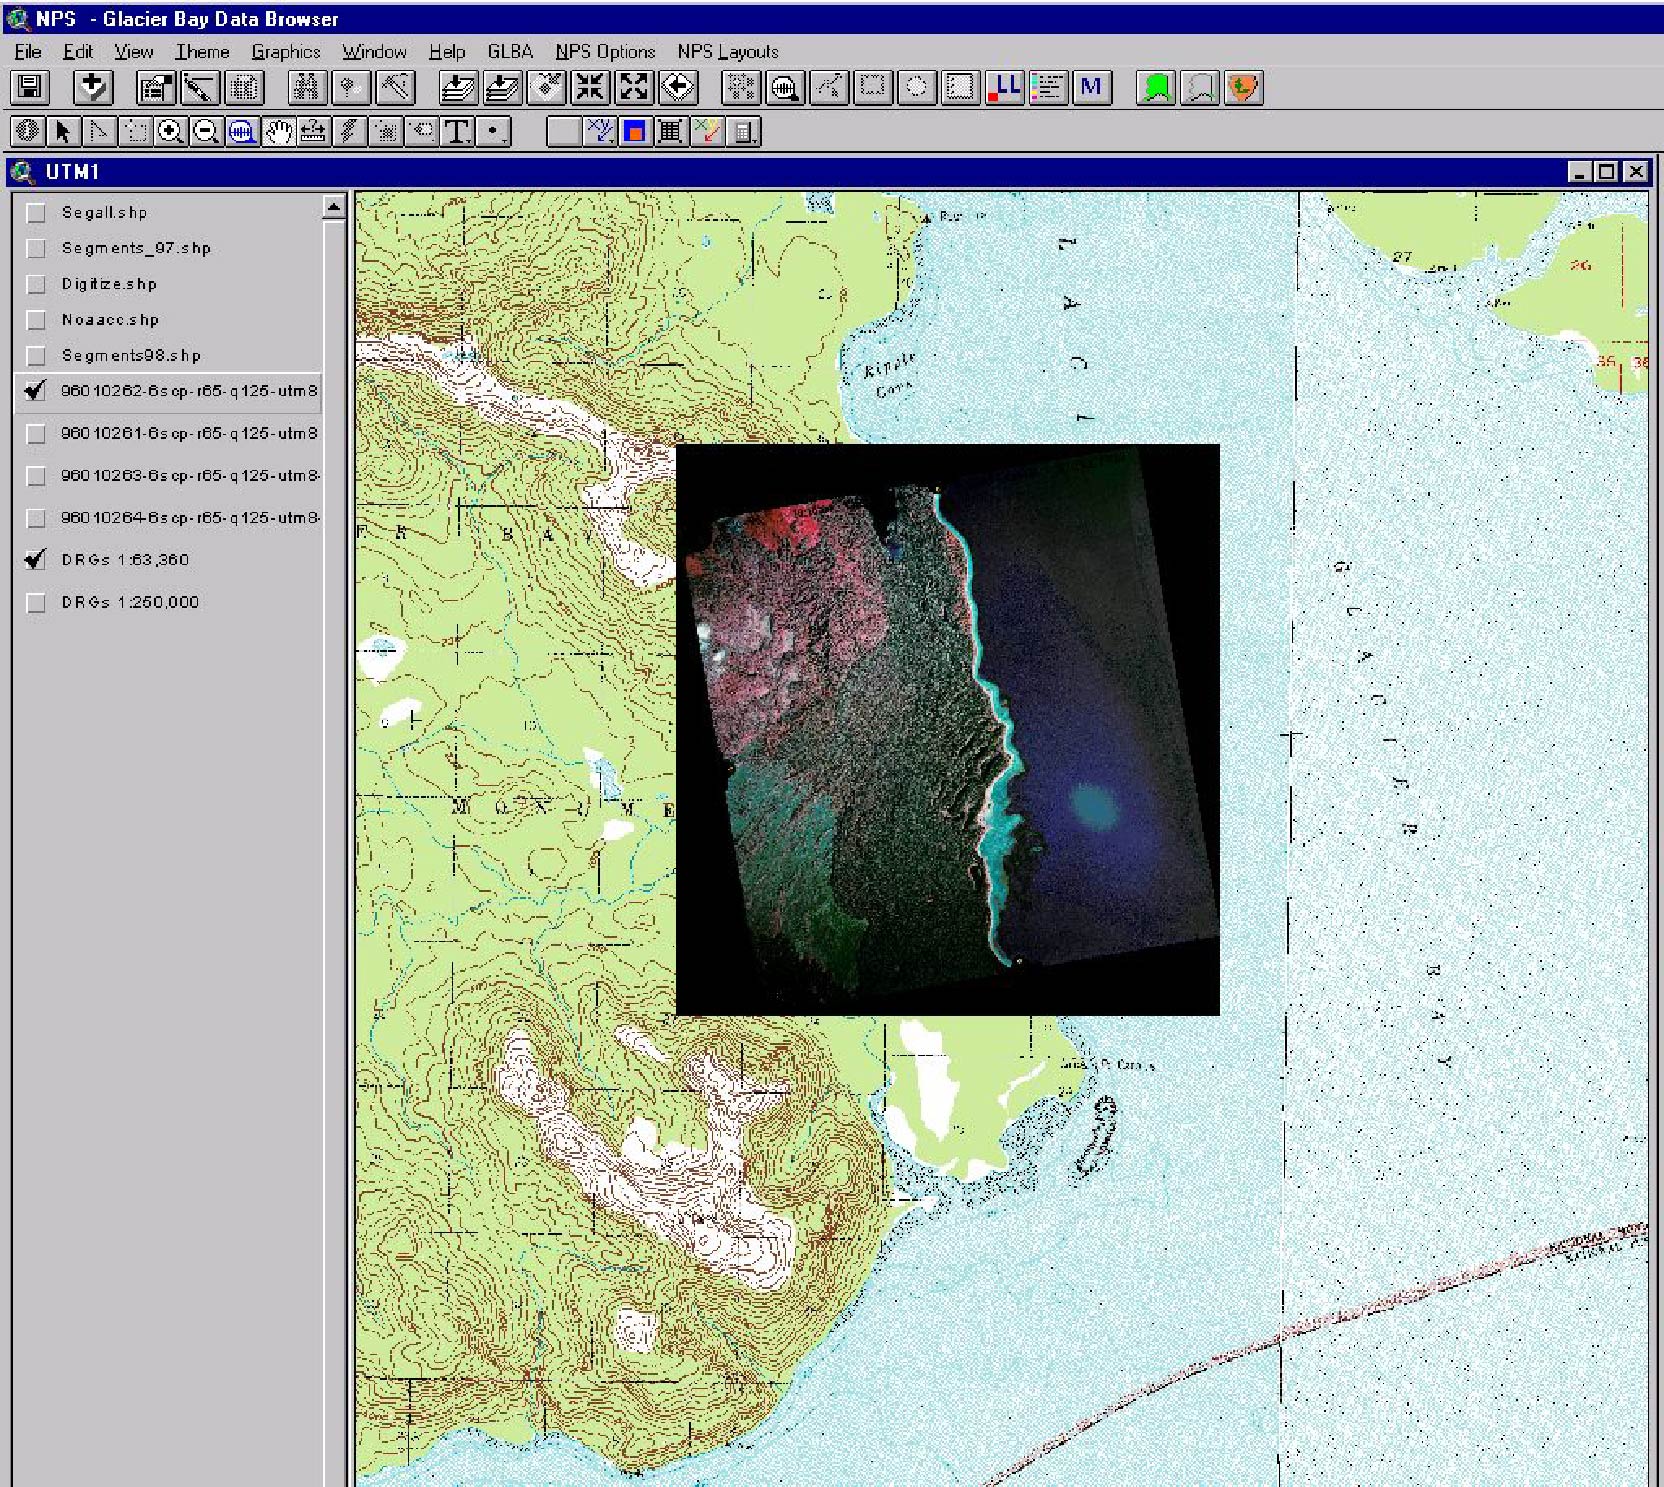
An illustration of an infrared aerial photo georeferenced into a
useable
map. Segment polygons are then heads-up digitized on the aerial photo
to
be linked to the database.
|
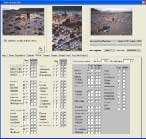
View of database showing the intertidal organisms noted as present
in a shoreline segment and displaying ground photos taken at the
segment.
|
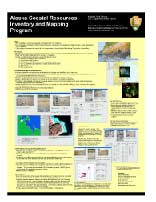
Poster describing the Alaska Coastal Resources Inventory and Mapping
Program (includes text and graphics)
|
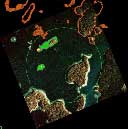
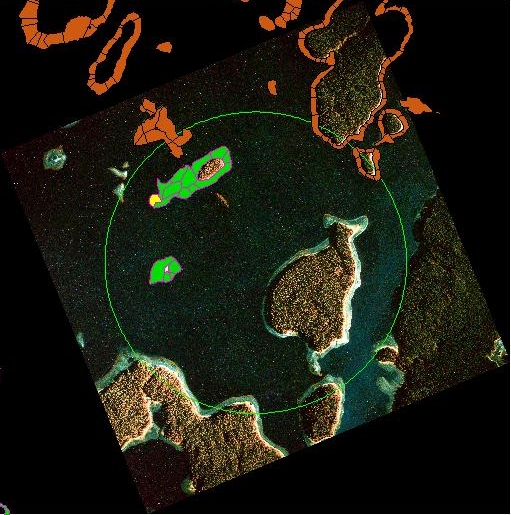
An illustration of segment polygons that have been heads-up digitized
using a georeferenced infrared aerial photo. Segment polygons are then
linked to their respective coastal resource data in the database.
|
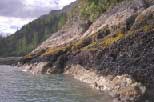
An example of a ground photo taken in a segment.
|
Click for Technical Article