Last updated: August 6, 2018
Article
Weather Data Analysis for the National Mall and Memorial Park
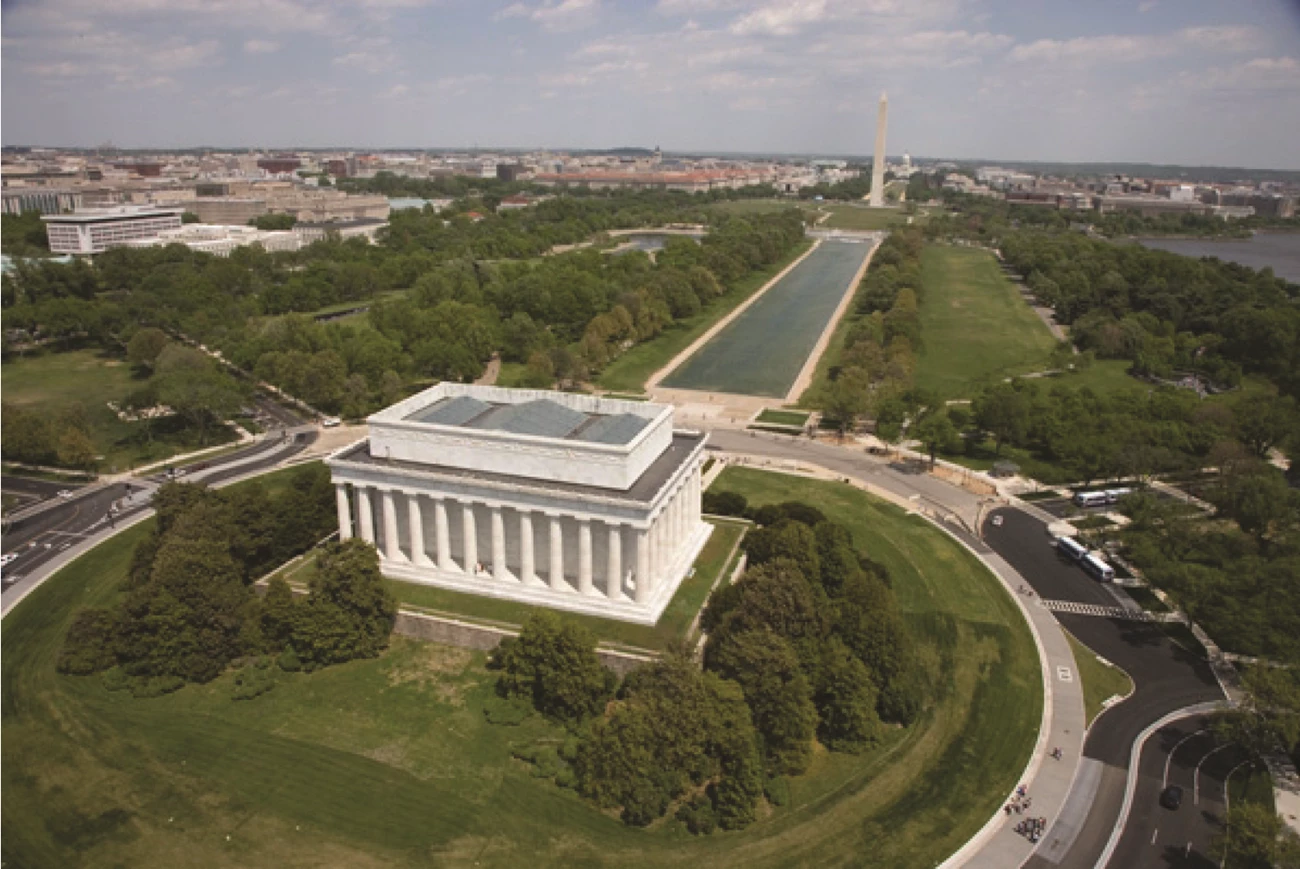
NPS
Significance
Complete historical weather records provide a unique opportunity to evaluate changing weather patterns. At the National Mall and Memorial Parks (Mall) recorded weather records indicate weather changes following an urban pattern: increased average temperatures, night-time low temperatures, day-time high temperatures, and precipitation.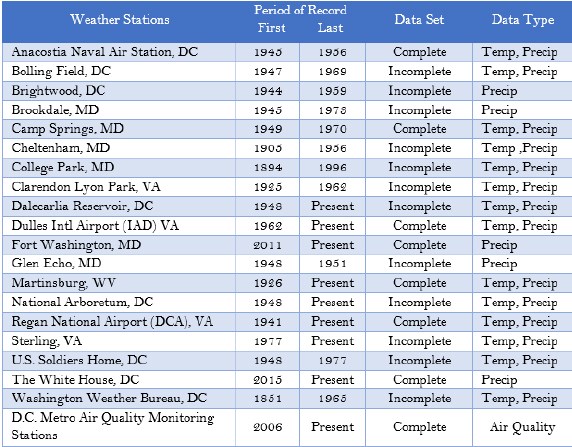
Introduction
Drawing from historical weather records in the National Capital Region, a climatological data set for the National Mall and Memorial Parks (Mall) was created. The regional climate data was able to provide regional context for changes in local weather patterns affording an opportunity to compare this analysis of the historical record to previous findings (Getzandanner, unpublished) and to published climate models for NPS parks (Gonzalez, 2013; Monahan & Fisichelli, 2014).Data and Process
Historical data sets were collected, evaluated, confirmed, and analyzed to seek weather patterns and changes over time in the Washington, District of Columbia (D.C.) area with an emphasis on the National Mall and Memorial Parks.Weather observations in D.C. begin in the 18th century as informal observations recorded by individuals. Some historical data was gathered from records compiled by Joseph Henry, the first Secretary of the Smithsonian Institution, considered by many as the father of the National Weather Service for establishing the first weather data network in the United States.
Weather observations became more standardized and reliable with the establishment of a federal weather service in the late 19th century and in the early 20th century when demands of military and civil aviation required continuous and accurate weather information (Ludlum 1966, Grice 2005). Prior to 1946, D.C. climatology was taken from the Washington Weather Bureau at 24th and M St, NW, which closed in 1965. After 1945 observations from Ronald Regan National Airport (DCA) became the primary source for continuous observations. Dulles International Airport (IAD), VA, started taking observations in late 1961.
Near the Mall, the most complete and uninterrupted daily observational data set comes from the DCA weather station. Hourly data from 1994-present at DCA was also used to enhance understanding of changes. Curated by the National Centers for Environmental Information from the National Oceanography and Atmospheric Administration (NOAA) these records formed the bulk of the analyzed data set, serving as the primary baseline for observations.
The regional data set includes a number of cooperative weather observations taken by individuals and other government organizations trained by the Weather Service (see Table 1). Missing data and extreme weather events were supplemented with newspaper accounts. Hourly air quality measurements for the D.C., starting in 2006, were evaluated.
Getzandanner, R. 2017.
Results
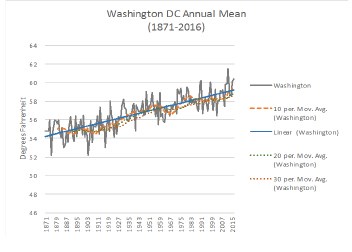
Yearly Mean Temperatures: Over the period of record, 145 years, D.C. has warmed (Figure 1). The 30-year average temperature for D.C. from the 1987-2016 window (58.5°F) compared to the average from 1871-1900 (54.9°F), showed an increase of 3.6°F (2.0°C). This warming trend was also evident at other stations within the National Capital region with long periods of record (i.e. College Park, MD; Sterling, VA; the National Arboretum, DC; and Dalecarlia Reservoir, DC). The largest increase in average temperature was found at IAD (23 miles or 37 km WNW of DCA) with a steady increase in yearly temperatures over the past 55 years. Every 10-year average temperature at IAD was warmer than the previous for the entire 55-year period of record. The yearly mean temperature difference between the first 10-year period and the last 10-years, was 2.7°F (1.6°C).
Average Number of Extreme High Temperatures: For each weather station, the largest change in warming occurred during the summer months with an increase in the total number of days in June - September of 90°F (32.2°C) or above. At DCA the average number of days at or above 90°F (32.2°C) exceeded the long-term average (35.6 days) during 4 of the last 5 decades. For temperatures at or above 100°F (37.8°C) DCA recorded a greater than double increase from 0.6 days per year over the 40 years from 1946 to 1985 to 1.6 days from 1986- 2015. The increase in extreme hot days is also documented at IAD.
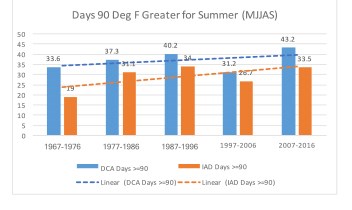
Reagan National Airport VA and Dulles Airport VA.
Getzandanner, R. 2017.
Airport VA.
Getzandanner, R. 2017.
Mid-Atlantic.
Getzandanner, R. 2017.
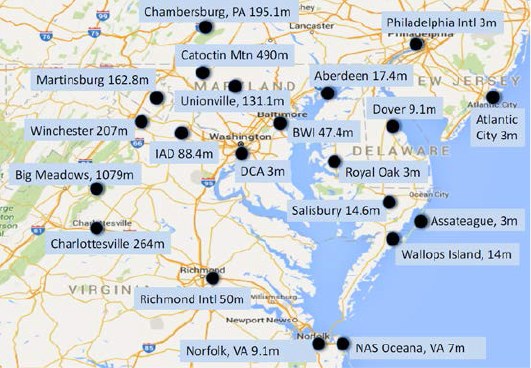
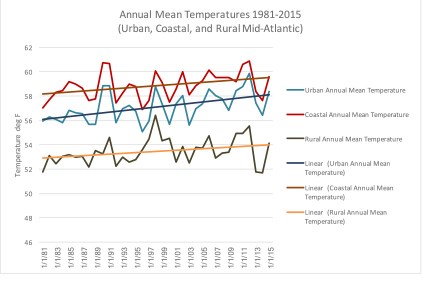
Nearly all the stations saw some increases in annual temperatures over their periods of record, some over 100 years. The urban and coastal stations saw similar large increases while the rural stations recorded little warming (Figure 5). For example, Martinsburg, WV, a rural station (63 miles Northwest of DCA) which has a continuous record from 1926 to present, saw very little change in annual average temperature over the past 90 years.
Other Considerations of Note: Typically, wind direction at DCA is northerly in contrast to the westerly winds on the Mall. Berg, et al. (2006) attribute the difference to the channeling influence of the Potomac and Anacostia Rivers. They also report lower wind speed on the mall than at DCA due to the frictional effect of the surrounding buildings.
urbanization in the Mid-Atlantic
Getzandanner, R. 2017.
Conclusions and Future Implications
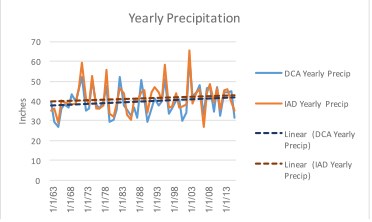
This analysis of the historical records clearly shows that the Mall and the surrounding National Capital Region are experiencing an increase in average temperatures. These findings are in alignment with conclusions reached from modeled predictions by Gonzalez (2013) and Monahan & Fisichelli (2014) which project a continuation of increased temperatures, more temperature extremes, and increases in precipitation.When coupled with findings from previous analysis in the mid-Atlantic (Getzandanner, unpublished), in which temperatures in the urban and coastal regions of the MidAtlantic were increasing faster than rural locations, these findings support an urban fingerprint to the recorded changes. The decreased range between daily high and low temperatures suggest an inability of the urban center to cool off at night due to the heat island effect. This is especially evident at Dulles Airport which has seen the most urbanization and also the greatest warming in the region. Another contributing factor impeding urban cooling could be an increase in moisture held in the atmosphere, due to increased temperatures. Increased moisture may also result in more precipitation. It is reasonable to assume that an increase in temperature would allow for more moisture and therefore more precipitation. The data does show a slight increase in precipitation although, for now, this increase is not significant.
The 4th Assessment of the Intergovernmental Panel on Climate Change (Trenberth et. al. 2007) reported differential warming around the globe including a “warming hole” over the eastern U.S. The observed rate of warming taking place there is less than the rate of warming throughout the rest of the world. Proximity of the “warming hole” may contribute to changes in the NCR. With no sign of a decrease in carbon dioxide levels, there will continue to be changing weather patterns. This work seeks to assist Park managers to detect and prepare for change.
Acknowledgements
Thanks to Ann Gallagher (NPS UERLA) and Dr. Rama Tangirala (D.C. Dept. of Energy and Environment) for their help in completing this project.
NPS
References
Berg, L. K., and K. J. Allwine. An Analysis of Wintertime Winds in Washington, D.C. United States: N. p., 2006. Web. doi:10.2172/888709.Getzandanner, R. unpublished research.
Gonzalez P. 2013. Climate Change and Impacts for the National Parks of Washington, DC, USA. National Park Service Climate Change Response Program. Washington, DC.
Grice, Gary K, History of Weather Observing in Washington, D.C. 1821- 1950 Current as of February 2005 docs.lib.noaa.gov/noaa_documents/NWS/NWS_ER/history/Washington_DC_1821-1950.pdf
Ludlum, David, 1966; Early American Winters; Vol. I: 1604 to 1820, Boston: American Meteorological Society.
Monahan WB and Fisichelli NA. 2014. Climate exposure of US National Parks in a New Era of Change. PLos ONE. 9(7):e101302. Monitoring and Assessment Branch, Air Quality Division, District Department of the Environment. “District of Columbia’s Ambient Air Quality TRENDS REPORT October 2014,” October 2014.
Trenberth, K. E., and Coauthors, 2007: Observations: surface and atmospheric climate change. Climate Change 2007: The Physical Science Basis. Contribution of Working Group 1 to the Fourth Assessment Report of the Intergovernmental Panel on Climate Change, S. D. Solomon et al., Eds. Cambridge University Press, 235–336.
