Last updated: April 13, 2020
Article
Water Quantity Monitoring in Southwest Alaska

Findings
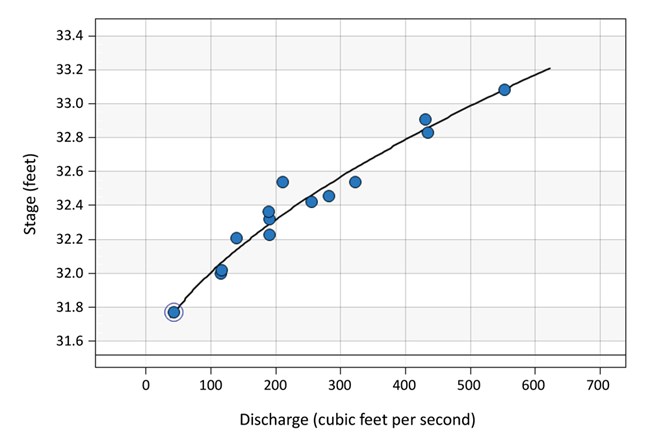
The Southwest Alaska Network (SWAN) monitors water quantity by measuring stage and discharge at the outlets of four high-priority lakes: Naknek Lake and Lake Brooks in Katmai National Park and Preserve, and Lake Clark and Kijik Lake in Lake Clark National Park and Preserve. In 2017, we refined the existing rating curves for three of these sites and created a new curve for the fourth (Kijik Lake). A rating curve is a graph of stage vs. discharge for a given location (Figure 1). The equation that best fits the curve enables the derivation of a continuous time series of discharge from a continuous time series of stage.

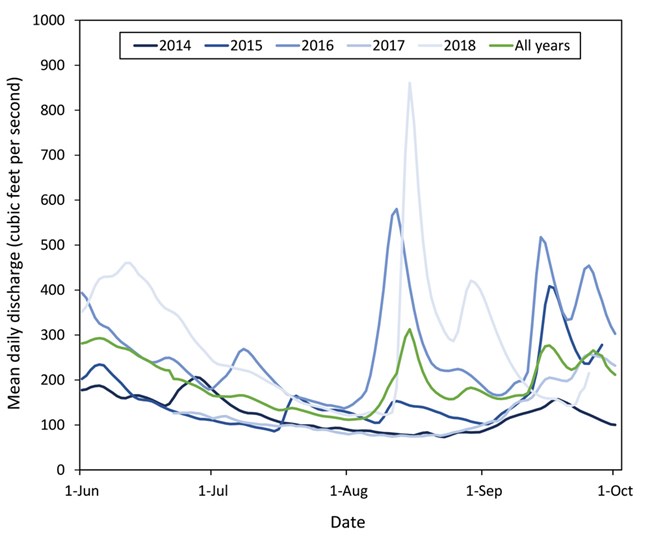
Preliminary results based on the new curve for the Kijik Lake outlet, indicate that mean daily discharge during the most recent 5 summers on record ranged from approximately 70 to 930 cubic feet per second (cfs; Figure 2). High variability among individual years was also apparent, reflecting year-to-year differences in the timing of precipitation within the watershed. For example, the timing of peak daily discharge in 2018 (930 cfs on August 15) tracked the timing of peak daily precipitation that summer (1.45 inches on August 13), as rain from a dissipating typhoon swept southwest Alaska. Watersheds like this, where rainfall determines the timing, duration, and magnitude of peak discharge, are classified as rain dominant. Rain-dominant watersheds like this are projected to become more common in Alaska, as warming air temperatures increase the proportion of precipitation falling as rain vs. snow.
Methods
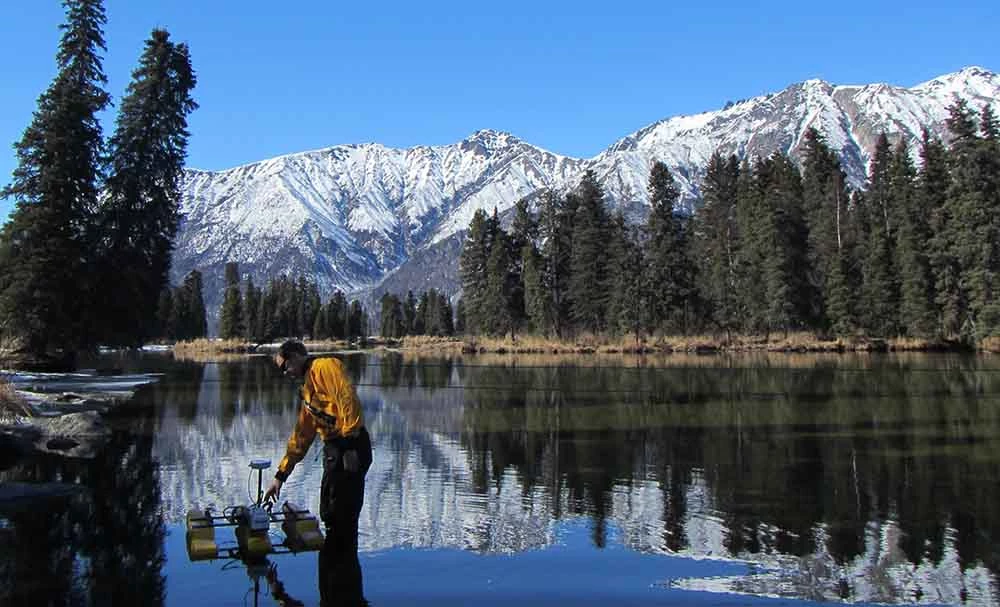
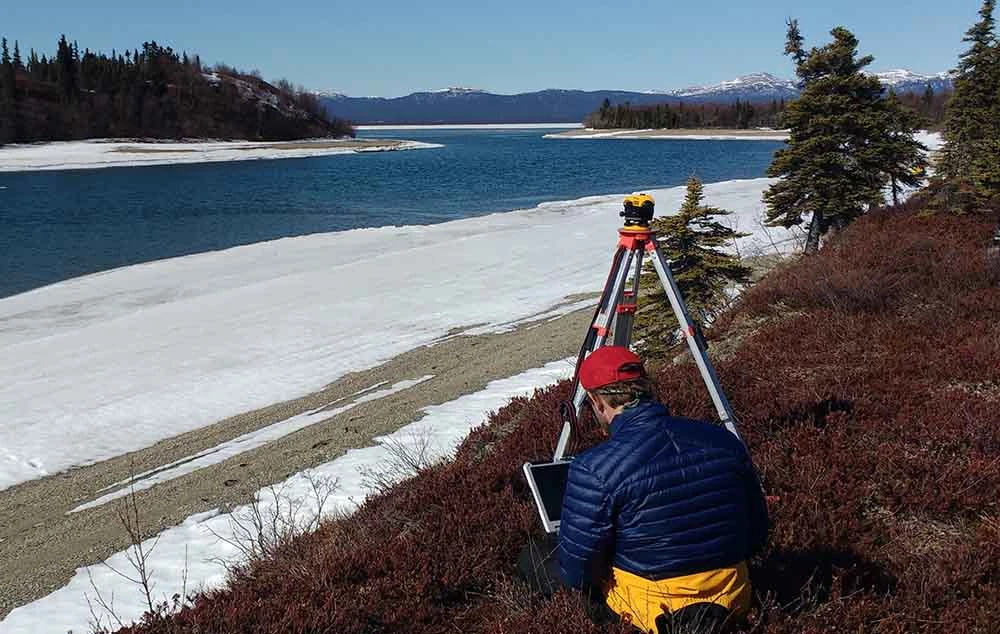
Discharge is measured periodically using an Acoustic Doppler Current Profiler (ADCP) attached to a boat or cableway. Stage is recorded hourly using a non-vented pressure transducer (level logger) attached to a fixed point year-round. Surveys are conducted to establish the elevation of the level logger relative to a benchmark and two reference points, because the level logger elevation may change when it is retrieved, downloaded, and redeployed.

NPS/Evan Booher

NPS/Dan Young
