Last updated: March 29, 2021
Article
Visitor Use
NPS/K. Jalone
Understanding visitor use patterns across the parks and over time allows park managers to assess where rangers and staff need to be stationed and where impacts to resources (such as trampling) may need to be monitored or mitigated in the future. Likewise, visitor use patterns may also inform commercial business operators (such as guides or air taxies) by providing insights to the areas currently visited and the timing of visits, details that are helpful when planning their services.
Park Visitation Trends
Where People Visit
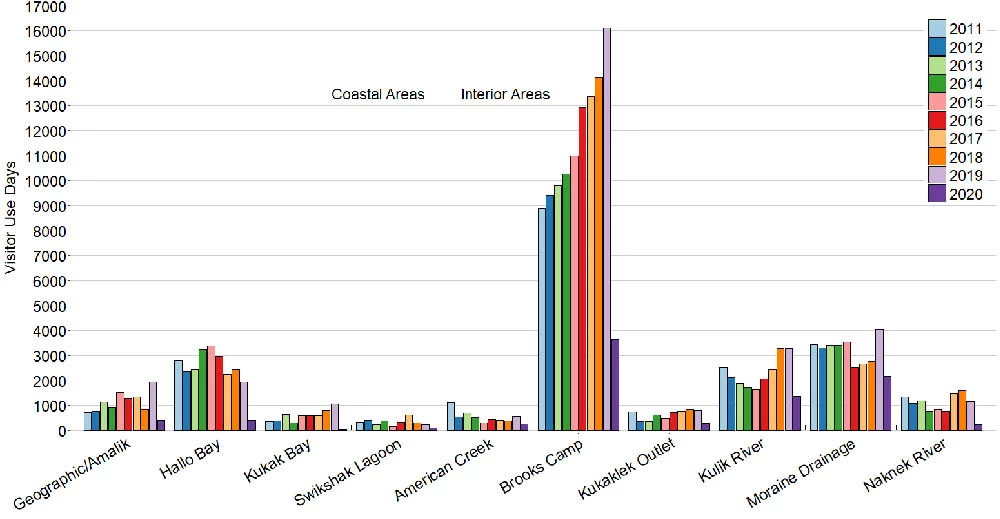
Over the years, the number of visitor use days reported by businesses operating in Katmai National Park and Preserve (NP&Pres) has fluctuated between 25,000 and 37,000 per year, with a sharp decrease in 2020 due to the pandemic. Even with the reduction in visitors in 2020, Brooks Camp and Moraine Drainage had higher visitation compared to other popular spots (Figure 1a). Hallo Bay, Geographic Harbor/Amalik Bay, Kukak Bay, and Swikshak Lagoon are some of the most-visited locations on the Katmai coast, in a normal year, combining to over 5,000 visitor use days per year (Figure 1a). The annual variation in visitation to sites is probably due to the change in the timing and magnitude of salmon runs connected to fishing and bear viewing opportunities.
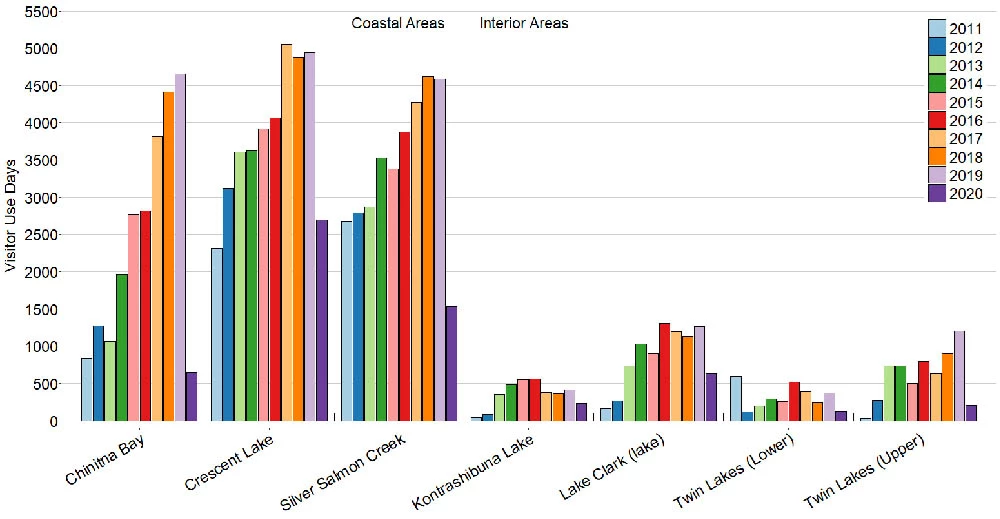
Visitation to Lake Clark NP&Pres also dropped significantly in 2020 when compared to past years--approximately 6,700 days in 2020 from almost 20,000 days in 2019. Prior to the pandemic, park visitation had been increasing, particularly on the Cook Inlet (coastal) side of the park. In 2019, Crescent Lake, Silver Salmon Creek, and Chinitna Bay were the most highly visited places in the park, together accounting for over 70% of visitation (over 13,000 days combined). Chinitna Bay has seen a large growth in visitor use, increasing from over 800 reported visitor use days in 2011 to over 4,600 in 2019 (Figure 1b).
[Data from the Katmai NP&Pres CUA database 3/08/2021]
[Data from the Lake Clark NP&Pres CUA database 3/8/2021]
When People Visit
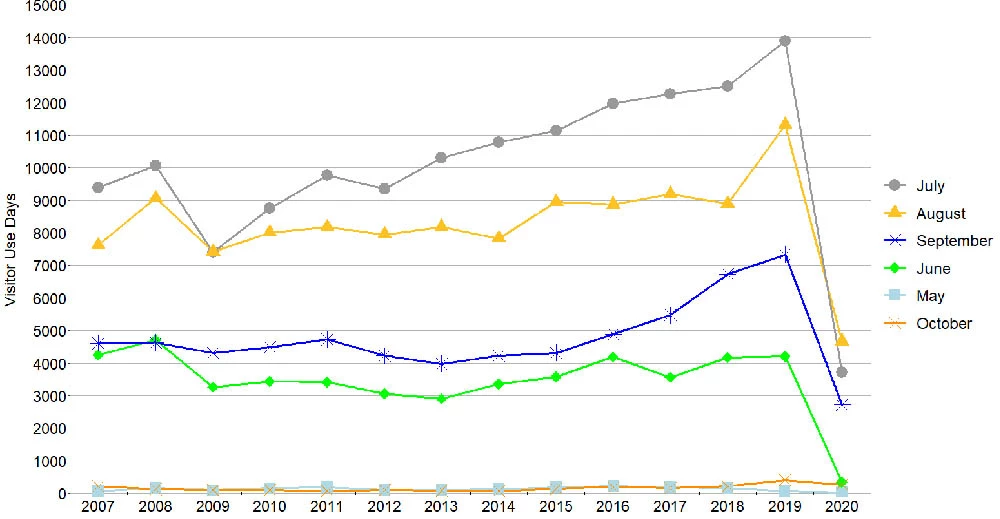
Figure 2a shows that most of the visitation for Katmai NP&Pres occurs in July and August. Normally about 70% of the visitor use days occurring during these two months. Similarly in Lake Clark NP&Pres, even with the reduction in visitation, July and August had the highest visitation as with past years (Figure 2b). Unlike past years, June saw less visitation than September.
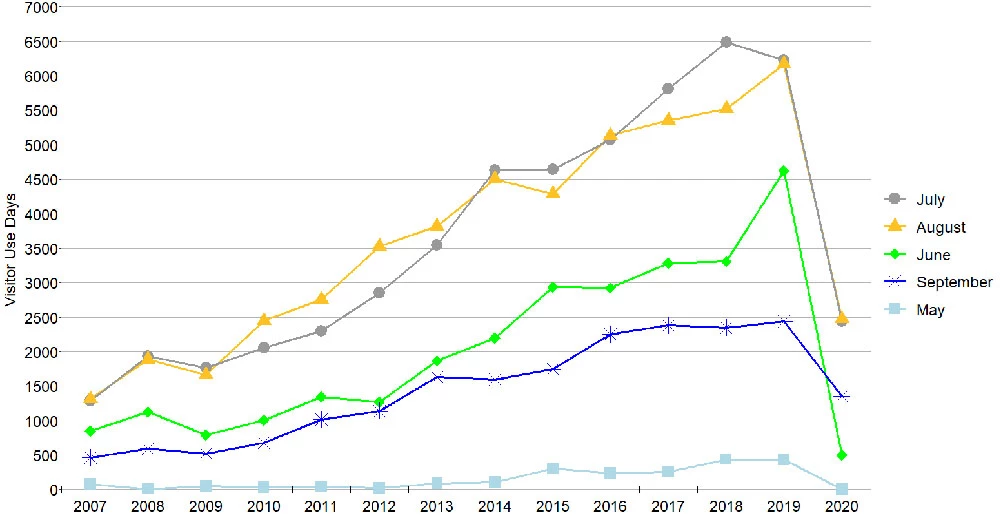
[Data from the Lake Clark NP&Pres CUA database 3/08/2021]
Figure 3 provides a snapshot of where visitation occurred in Katmai NP&Pres for select months in 2020. Brooks Camp was closed in June but received almost 2,000 visitor use days in July when the bear numbers on Brooks River are at their peak. In August, visitation spread out among other locations (Figure 3).
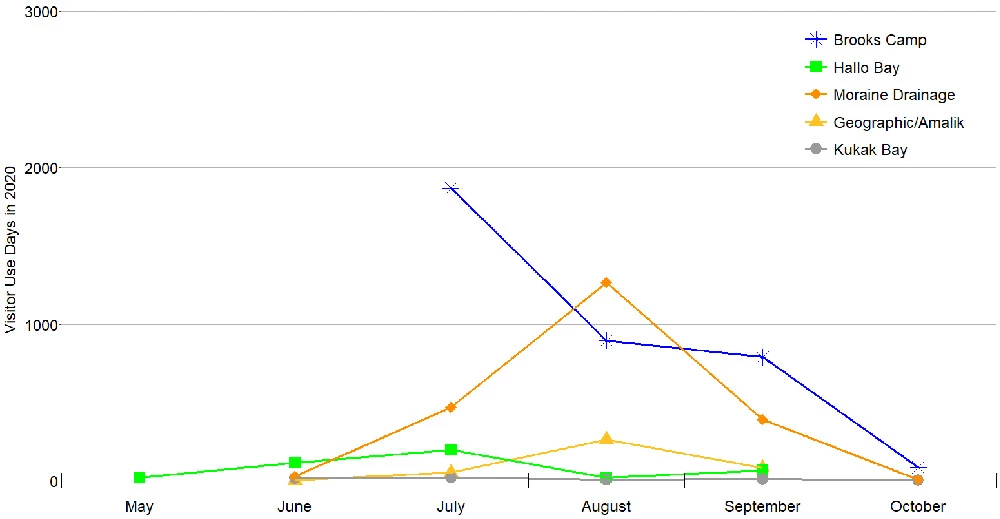
[Data from the Katmai NP&Pres CUA database 3/08/2021]
What People Do When They Visit
The three main activities in Katmai NP&Pres reported by commercial operators are sport fishing, bear viewing, and air taxi; these activities are not mutually exclusive (Figure 4a). In 2020, the visitor use days for sport fishing showed the smallest drop. This might be from folks taking advantage of deals offered by commercial operators with the loss of normal summer travel.
The three most popular activities in Lake Clark NP&Pres were still bear viewing, sport fishing, and photography (Figure 4b). For reported activities, the numbers for sport fishing showed the smallest drop. This might be from folks taking advantage of deals offered by commercial operators with the loss of normal summer travel.
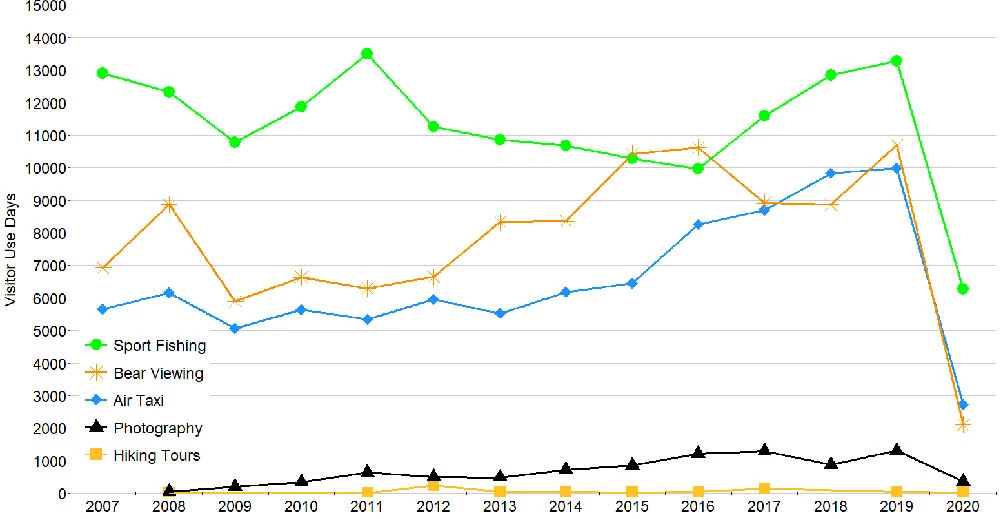
[Data from the Katmai NP&Pres CUA database 3/08/2021]
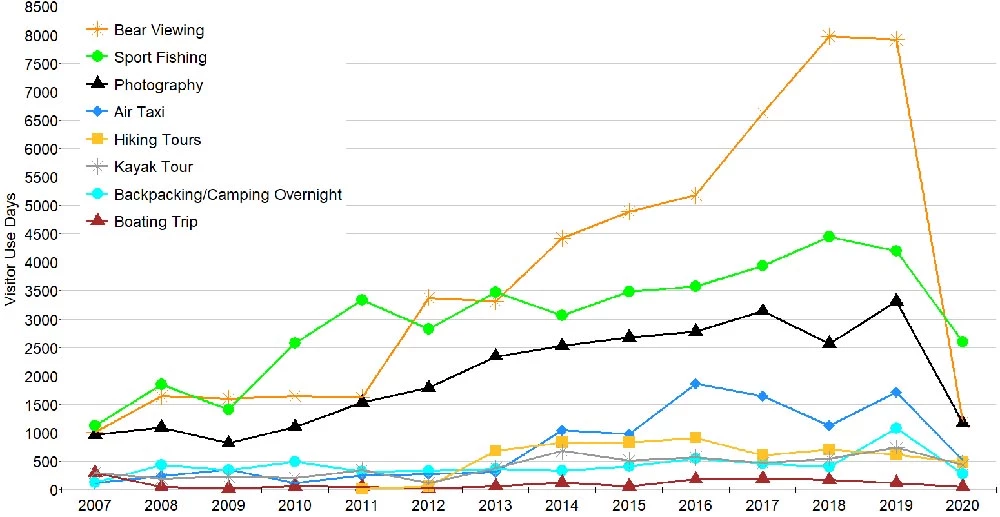
[Data from the Lake Clark NP&Pres CUA database 3/08/2021]
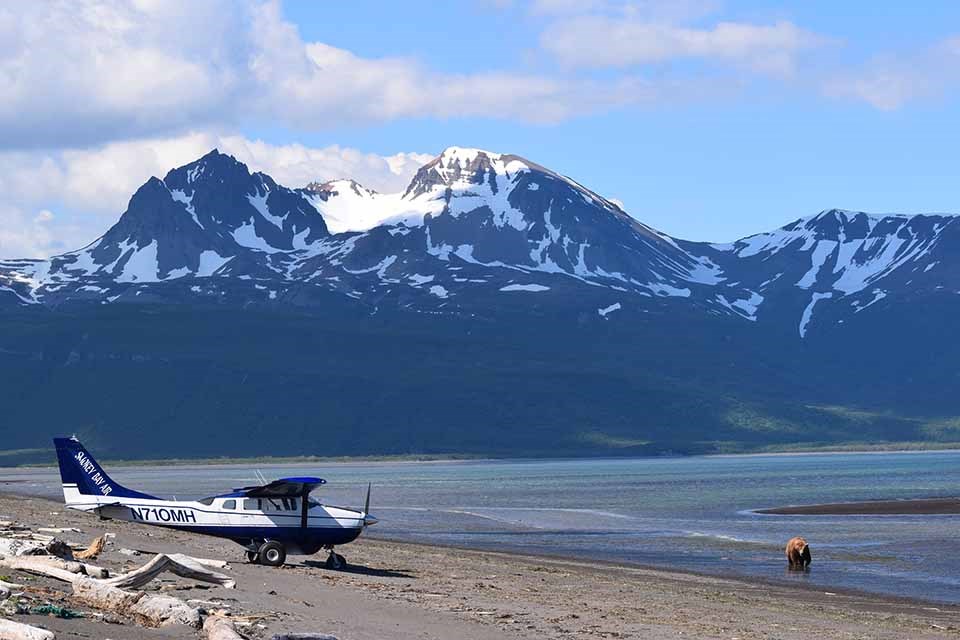
Methods
Remote Alaska parks do not have entrance stations to count people visiting the park. Some local visitation occurs, but the vast majority of visitors to Katmai and Lake Clark national parks and preserves use a lodge, guiding service, or air taxi operator. These commercial operators pay a fee for each visitor they bring to the park, and report back to the park the number of visitors, activities visitors are engaged in, and where within the park visitors go. Each park is divided into areas, roughly corresponding to watersheds. Areas with concentrated use have been sub-divided into smaller areas to provide more specificity regarding the location of use. The data collected by commercial operators are the primary means to quantify and understand visitation patterns and public uses.
