Vegetation and soils are two of many natural resources monitored by the National Park Service (NPS) Division of Inventory & Monitoring (I&M). Learning about vegetation dynamics helps us to better understand the integrity of ecological processes, productivity trends, and ecosystem interactions that can otherwise be difficult to monitor. In NPS units of the American Southwest, three I&M networks monitor vegetation and soils using the scientific protocol described here.
Importance
NPS
Generating more than 99.9% of Earth’s biomass, plants are the primary producers of life on our planet. Vegetation composition, distribution, and production are highly influenced by environmental factors, such as soil texture, depth, and landform type. Especially as they relate to water, these influences are magnified at local scales in the Sonoran Desert, Chihuahuan Desert, and Apache Highlands ecoregions. Because vegetation and soils are so closely interrelated, it is necessary to monitor them together to achieve a more complete picture of ecological function.
Vegetation and soils monitoring integrates six “vital signs,” or ecological indicators: vegetation community dynamics, vegetation lifeform abundance, exotic plant species–status and trends, biological soil crusts, soil aggregate stability, and soil cover. This integrated approach recognizes that complex ecosystems cannot be fully understood by studying their individual pieces, because when considered in aggregate, those systems exhibit emergent properties (i.e., they are “greater than the sum of their parts”). While still providing individual answers about the condition of specific vital signs, our approach to monitoring vegetation and soils is based on this holistic paradigm.
Monitoring Objectives
Monitoring objectives for terrestrial vegetation and soils monitoring are to determine the status and trends (over five-year intervals) in:
- Terrestrial vegetation cover for common (≥10% absolute canopy cover) perennial species (including non-native plants) and all plant lifeforms.
- Terrestrial vegetation frequency of uncommon (<10% absolute canopy cover) perennial species and non-native plants.
- Terrestrial soil cover by substrate classes (e.g., bare soil, litter, vegetation, biological soil crust, rock fragments of several size classes) that influence resistance to erosion.
- Terrestrial soil stability of surface aggregates by stability class (1–6).
- Biological soil crust cover and frequency by morphological group and lichen growth form.
Sample Design
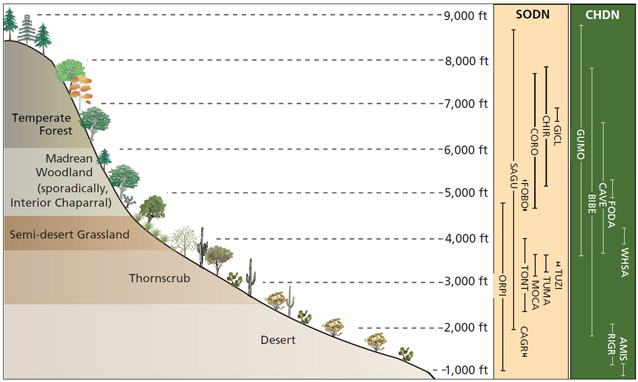
Terrestrial vegetation and soils are monitored at 14 parks in the Sonoran Desert and Chihuahuan Desert networks (SODN and CHDN; see table). For small units, all plots are sampled in a single year. At larger units, only 1/5 of the plots are sampled each year (see table), due to time and other constraints on field efforts, and to minimize the role of interannual climate variability on the results.
Sampling plots were allocated using a spatially balanced (Reversed Randomized Quadrant-Recursive Raster or RRQRR), stratified design, which allows us to capture the wide range of biomes found in these diverse units (see figure) and to modify sample sizes when necessary. All parks were stratified based on elevation and soil rock-fragment classes. The number of plots assigned to each stratum is proportional to the area that stratum occupies within the overall sampling frame.
| Park | Acronym | SODN | CHDN | Monitoring initiated |
|---|---|---|---|---|
| Big Bend NP | BIBE | – | X | 2011 |
| Carlsbad Caverns NP | CAVE | – | X | 2012 |
| Chiricahua NM | CHIR | X | – | 2007 |
| Coronado NMEM | CORO | X | – | 2009 |
| Guadalupe Mountains NP | GUMO | – | X | 2010 |
| Organ Pipe Cactus NM | ORPI | X | – | 2010 |
| Saguaro NP (Rincon Mountain District) | SAGE | X | – | 2008 |
| Saguaro NP (Tucson Mountain District) | SAGW | X | – | 2009 |
| White Sands NM | WHSA | – | X | 2011 |
| Park | Acronym | SODN | CHDN | Monitoring initiated |
|---|---|---|---|---|
| Casa Grande Ruins NM | CAGR | X | – | 2008 |
| Fort Bowie NHS | FOBO | X | – | 2008 |
| Fort Davis NHS | FODA | – | X | 2011 |
| Gila Cliff Dwellings NM | GICL | X | – | 2009 |
| Montezuma Castle NM | MOCA | X | – | 2010 |
| Tonto NM | TONT | X | – | 2009 |
Fields
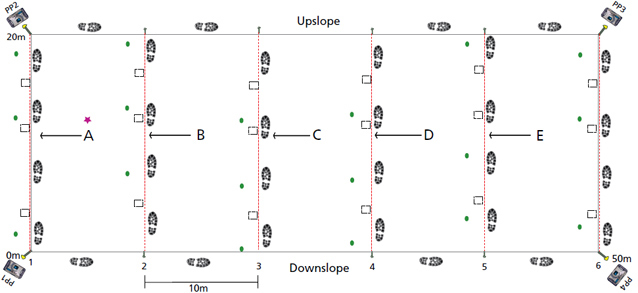
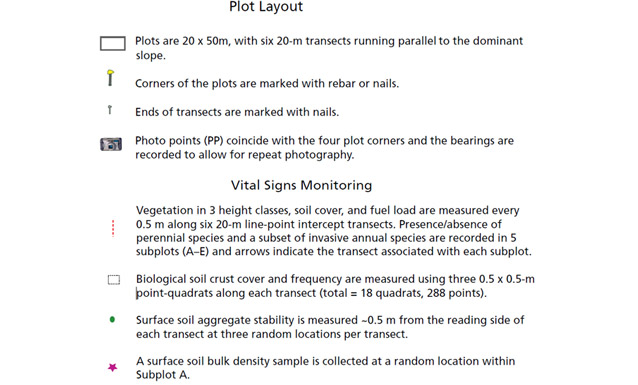
This protocol employs permanent, 20 × 50-m sampling plots (see figure below), within which all vegetation and soils data are collected at five-year intervals. The 50-m edges of the plot run parallel with the contours of the site. Along each of six transects, field crews sample vegetation, soil and biological soil crust cover, and soil stability. In the spaces between the transects (subplots), field crews record (1) the presence of perennial vegetation and a suite of annual non-native plants by species and (2) density of select succulent species (ocotillo, senita, organ pipe, and saguaro cacti).
Vegetation and soil cover
Along each transect, crew members record vegetation within three height categories using the line-point intercept method, with points spaced every 0.5 m (240 points total). The three height categories are field (0.025–0.5 m), subcanopy (>0.5–2 m), and canopy (>2 m). Line-point intercept measures the number of “hits” of a given species out of the total number of points measured. Perennial vegetation is recorded to species and annual vegetation is recorded to life form, with the exception of a suite of annual non-native plants that are recorded to the species level. Soil cover is also sampled at each 0.5-m intercept, and is recorded to substrate class (e.g., rock, gravel), with biological soil crusts recorded to morphological group (light cyanobacteria, dark cyanobacteria, lichen, moss) and litter and woody debris recorded by size class (fuel load).
Vegetation frequency and density
The area between any two adjacent transects forms the boundary of 10 × 20-m subplots used to estimate within-plot frequency of perennial plant species and exotic plants. The occurrence of any species not measured on the adjacent line-point transect is recorded to determine a within-plot frequency of 0–5. In addition, columnar cacti and ocotillo are counted by individual and height class within each subplot to provide an estimate of density for these species, where they occur.
Biological soil crust cover and frequency
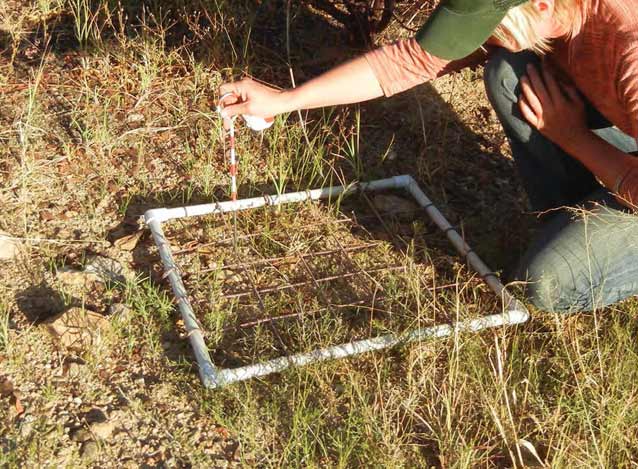
Biological soil crust cover is measured as a part of the soil-cover measurements described above and by using 0.25-m2 pointquadrats placed adjacent to the transects. Three quadrats are measured per transect using the point-quadrat method (similar in concept to line-point intercept), with 16 intercept measurements per quadrat, resulting in 18 quadrats and 288 measurements per plot. At each intercept, biological soil crusts are recorded as light cyanobacteria, dark cyanobacteria, bryophytes (mosses and liverworts), and lichen by growth forms (crustose, gelatinous, foliose, fruticose, and squamulose). Biological soil crust frequency by lichen growth form and morphological group is determined by the number of quadrats occupied per plot (0–18).
Soil aggregate stability
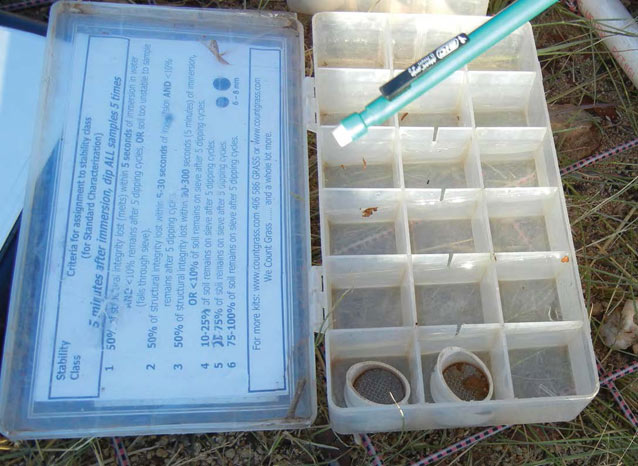
Surface soil aggregate stability is measured using a modified wet aggregate stability method. Within each plot, samples are attempted at three pre-determined points on the left side of each of transect (18 total). The uniformly sized (2–3 mm thick, 6–8 mm on each side) samples are placed on a screen and soaked in water for five minutes. After five minutes, the samples are dipped slowly up and down in water, with the remaining amount of soil recorded as an index of the wet aggregate stability of the sample. Samples are scored from 1 to 6, with 6 being the most stable.
Products, Scope, and Schedule
For large parks, where the full complement of plots is sampled over a five-year period, the networks produce annual data summary reports documenting each year’s effort and findings (after two years of sampling). After five years of monitoring, data are analyzed and interpreted in comprehensive status and trends reports. At smaller units, all plots are sampled in a given year, leading directly to a status and trends report. The scale of inference of each report is the individual park.
Data summaries and status and trend reports are published in the NPS Natural Resources Technical Report Series and posted on the Sonoran Desert Network and Chihuahuan Desert Network websites. Terrestrial vegetation and soils information is also communicated through live presentations, resource briefs, field summaries, network-wide synthesis reports produced every 10 years, and podcasts and other media produced and distributed through the network websites.
Protocol Status
The uplands monitoring protocol and standard operating procedures for the Sonoran Desert Network and Chihuahuan Desert Network were published in April 2012. A database and supporting documentation that meet NPS and FGDC standards are complete and available.
Prepared by the Sonoran Desert Network, 2012.
Tags
- big bend national park
- carlsbad caverns national park
- casa grande ruins national monument
- chiricahua national monument
- coronado national memorial
- fort bowie national historic site
- fort davis national historic site
- gila cliff dwellings national monument
- guadalupe mountains national park
- montezuma castle national monument
- organ pipe cactus national monument
- saguaro national park
- tonto national monument
- white sands national park
- swscience
- american southwest
- sonoran desert
- sodn
- chihuahuan desert
- chdn
- pinyon-juniper woodlands
- grassland communities
- shrubland communities
- desert communities
- biological soil crust
- uplands
- terrestrial invertebrates
- microorganism
- project
- science
- monitoring
- forests and woodlands
- soils
- vegetation and soils
Last updated: February 14, 2019
