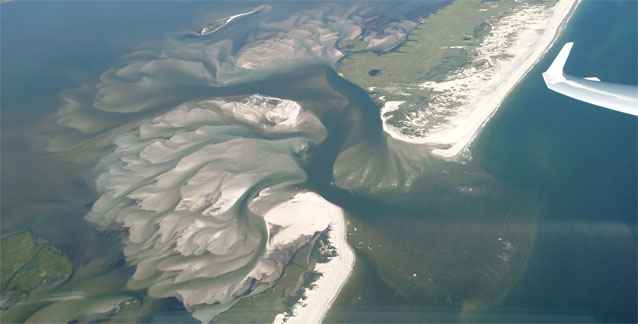
By comparing pre- and post-Hurricane Sandy tide gage data, Dr. Charles Flagg has monitored the impact of the wilderness breach on water levels and circulation in the Great South Bay. On frequent flights over the natural feature, Dr. Flagg tracks changes in the shifting shoals and shoreline of the breach.
Tracking Tides
Dr. Flagg has monitored conditions in the Great South Bay for more than a decade. Immediately after Hurricane Sandy, Dr. Flagg began closely monitoring a series of tide gages in Great South Bay to understand how the breach created during the storm in Fire Island’s wilderness was impacting water levels.
Tide gages record data on daily high and low water levels as well as fluctuation in tides throughout the year. As seasons change, the moon affects the tides and produces tides that can be higher and lower than normal.
Dr. Flagg evaluated tide gage data from before and after the breach opened to compare changes in mean high water levels. He found that changes in daily average mean high water have increased by one inch or less. Tide gage measurements also demonstrate that close to the breach, in Bellport Bay, the timing of high and low tides occurs approximately 20-35 minutes earlier in the tidal cycle than before the breach opened.
Watching the Wilderness Breach from Above

On regular flights over the wilderness breach, Dr. Flagg uses relatively simple technology - a video camera - to construct map-like photo mosaics of the breach. These photo mosaics help us understand how the breach shorelines and shoals have changed over time.
Last updated: November 1, 2016
