Last updated: March 14, 2022
Article
Lake Ice Monitoring

NOAA/Dave Withrow
Lake ice cover is a key component of Alaska ecosystems because it influences the physical processes, chemical processes, and biological productivity of the region’s lakes and the wellbeing of communities that depend on them. Global climate models indicate the climate is warming more rapidly at higher latitudes than it is closer to the equator. Historic records of Northern Hemisphere lake ice trends indicate duration is decreasing as a result of warming. The magnitude and impact of these changes in timing and duration (phenology) of lake ice is poorly understood in southwestern Alaska.
Observing Lake Ice Using Remote Sensing
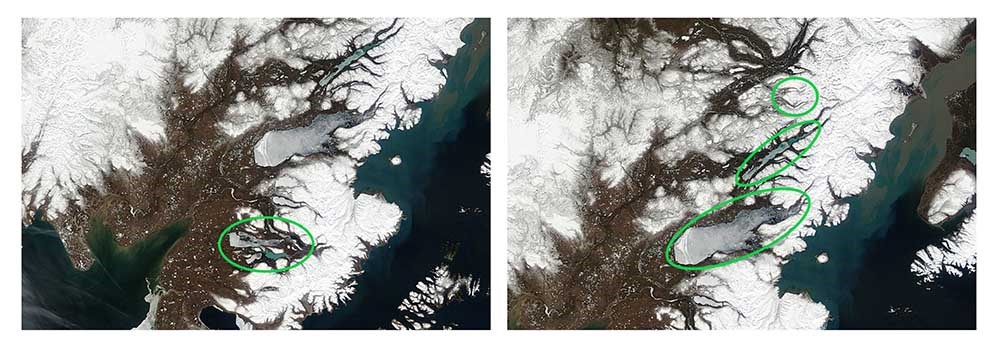
Southwest Alaska Network scientists are studying lake ice using remote sensing, climate data from long-term observations in the region and statistical modeling of the observed patterns. The ice phenology was estimated for important lakes in Katmai and Lake Clark national parks and preserves using images from satellites that pass over Alaska daily beginning in 2002 (Figure 1).

Timing of Freeze-up
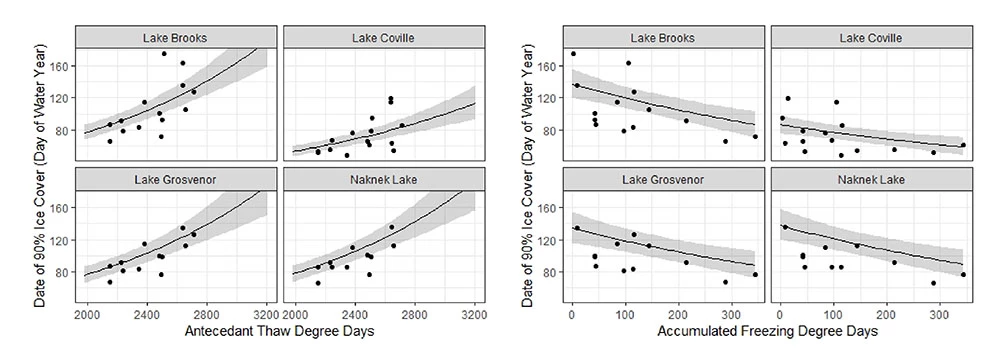
Freeze-up, the date when ice cover first exceeds 90%, was highly synchronous for the lakes in Katmai National Park and Preserve. Between 2002 and 2016, mean freeze-up dates for Naknek Lake (January 4; 96th day of the water year) and Grosvenor Lake (January 6; 98th day of the water year) were similar, followed by Lake Brooks (January 14; 106th day of the water year). Coville Lake was earlier (December 12; 73rd day of the water year), likely due to greater terrain shading and lower water volume. All four lakes displayed similar patterns where freeze-up occurred later following warm summers and earlier during cold autumns (Figure 2).

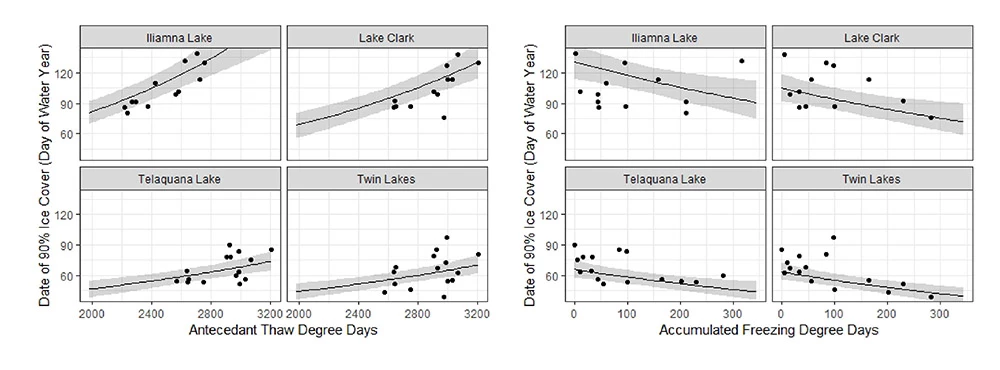
Between 2002 and 2016, mean freeze-up dates for large lakes in Lake Clark National Park and Preserve ranged from December 3 (64th day of the water year) at Twin Lakes, to January 13 (105th day of the water year) at Lake Iliamna. Mean freeze-up dates for Lake Clark (January 12; 104th day of the water year) and Telaquana (December 6; 67th day of the water year) fell within a similar range. The larger lakes, Lake Clark and Iliamna, were highly variable and did not freeze in years following warm summers and mild autumns. The two smaller, high-elevation lakes, Twin and Telaquana, were synchronous in terms of the timing of freeze-up, such that freeze-up occurred later following warm summers and earlier during cold autumns (Figure 3).

Modeling Lake Ice Using Air Temperature
We used a statistical model to measure the relationship between freeze-up dates and warm summer temperatures and cold autumn temperatures. We summarized the addition of heat to the lakes using cumulative thaw-degree days, which equate to the daily mean above freezing, between June 1 and September 30. We summarized the subtraction of heat using cumulative freeze-degree days, or the daily mean below freezing, between October 1 and December 15.
Predicting the Future
While there will always be some uncertainty in the weather and climate, with these data and model it’s possible to make reasonable estimates of the coming winter’s freeze-up date using the cumulative thaw-degree days of last summer and the present year’s accumulating freeze-degree days.
