Last updated: May 7, 2018
Article
Streamflow Monitoring in the San Francisco Bay Area

NPS / Jessica Weinberg McClosky

Why Is Streamflow Important?
The amount of water flowing in a stream is among the most useful factors available for understanding watershed and stream health. This is in part because streamflow is a reflection of the weather, climate, plant life, soil characteristics, and land use (e.g. how many buildings, roads, and farms there are) in the watershed. Streamflow then directly influences water quality, stream channel shape, and habitat conditions for a wide array of plants and animals. Federally endangered coho salmon and threatened California red-legged frogs are among the many at-risk species that rely on healthy waterways in the Bay Area.
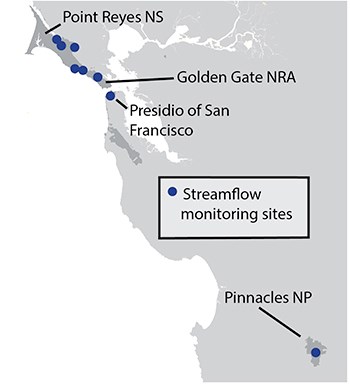
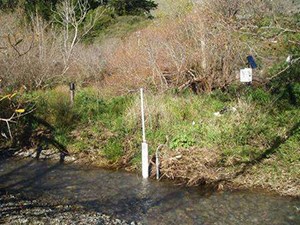
The San Francisco Bay Area Network Inventory and Monitoring Program and its partners monitor streamflow in selected streams in Golden Gate National Recreation Area, Pinnacles National Park, Point Reyes National Seashore, and the Presidio of San Francisco.
Why Do We Monitor Streamflow?
- To assess the variability and long-term trends in streamflow
- To track the frequency, size, and duration of high flow events and of extreme low water events in streams containing threatened or endangered species
How Do We Use the Monitoring Data?
- To guide decisions and policies about issues ranging from habitat restoration and water quality to urbanization and water rights
- To better predict extreme high or low streamflow events and plan strategies to lessen the negative effects these events can have on vulnerable wildlife

NPS
What Have We Learned?
The NPS has collected streamflow data regularly at sites in Golden Gate and Point Reyes since 1997-98, at the Presidio since 2001 and at Pinnacles since 2008. Given the high variability of streamflow data, it is too soon to report on long-term trends. Still, the data has already helped to address specific concerns at several parks. In Golden Gate, for example, streamflow data from Redwood Creek has been helpful in planning effective creek and wetland restoration activities. It has also been valuable for assessing and adjusting water withdrawal schedules to improve dry season habitat conditions for juvenile coho salmon and steelhead trout.
For More Information
Golden Gate Aquatic Ecologist
Darren Fong
Links
San Francisco Bay Area Inventory & Monitoring Network
Pacific Coast Science and Learning Center
Summary by Jessica Weinberg McClosky, January 2014.
Download PDF from the NPS Data Store
