Last updated: September 10, 2019
Article
Taking the Long View

Long-term data sets provide perspective on changes in the marine ecosystem in the Gulf of Alaska

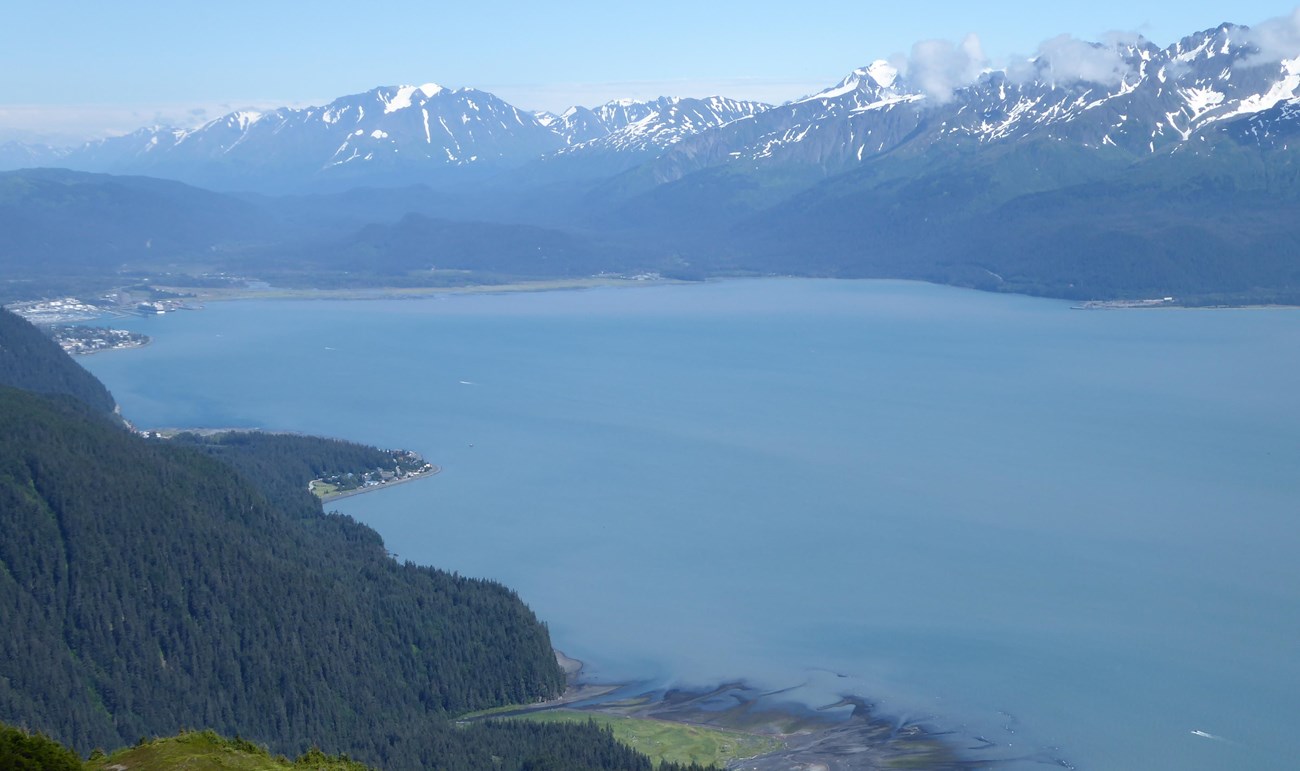
Enter the Seward Line. This series of oceanographic survey stations in the Gulf of Alaska has been in operation, in various forms, since the early 1970s. The Seward Line begins with the GAK-1 monitoring station at the mouth the Resurrection Bay and proceeds south 150 nautical miles to the outer edge of the continental shelf. The University of Alaska, Fairbanks established a long-term observation program along this transect in 1974 in order to fill in data gaps about the hydrology on the Gulf of Alaska shelf. Since that time a series of agencies have assumed management of the monitoring program, each with a unique focus for the information gathered.
The U.S. Global Ocean Ecosystem Dynamics (GLOBEC) program, sponsored by the National Science Foundation and National Oceanic and Atmospheric Administration began monitoring the stations in 1997, to examine the effects of climate change on ocean ecosystems, particularly on important fisheries. From 2005 to 2010, the North Pacific Research Board (NPRB) continued the research along the Seward Line an effort to better understand how the environment influences the success of fisheries in the Gulf of Alaska.
Today the Seward Line is part of a comprehensive long-term ecological research program funded by a consortium of agencies, including NPRB and the Alaska Ocean Observing System. The monitoring itself is conducted by Gulf Watch Alaska, an offshoot of the Exxon Valdez Oil Spill Trustee Council. Gulf Watch Alaska collects ecosystem data from multiple regions of the gulf affected by the 1989 spill, including Prince William Sound, the lower Cook Inlet and Kachemak Bay, and at point locations in Cordova and Seldovia Harbors. Their research cruises along the Seward Line focus on environmental drivers – those biological and physical factors that have the greatest influence on an ecosystem. In the marine environment, these include currents, water temperature, salinity, dissolved oxygen, nutrients, chlorophyll and plankton communities. They influence not only the gulf’s recovery when things go awry, (as in an oil spill), but its ability to adapt to a changing climate.

How is the Sampling Done?
Twice a year, in May and September, Gulf Watch Alaska researchers board the research vessel, Sikuliaq, to collect water samples from each station along the Seward Line transect. A CTD (conductivity, temperature, depth) instrument is lowered down through the water column to measure salinity and water temperature relative to the depth. Crews may also attach additional sensors to the CTD to measure water clarity, light penetration, dissolved oxygen content and phytoplankton.
Two different zooplankton-collecting systems are employed to gather a broad range of sizes and species. During the daytime, a simple vertical net coupled with two additional nets with smaller mesh sizes (.05 mm and .15mm) is lowered 100 meters into the water to collect the smaller zooplankton. At night, a more sophisticated "multinet" system with .5 mm mesh, is towed slowly behind the ship to catch the larger and faster zooplankton, such as krill.
Researchers also monitor for ocean acidification by evaluating water samples gathered at varying depths for carbonates. Biological and chemical samples are taken to the laboratory for analysis, while physical data are read directly from the instruments. In total, these data provide significant details on seasonal patterns and trends, as well as changing environmental conditions in the gulf.
What are They Finding?
Persistence, in terms of consistent, multi-decade studies, is beginning to pay off. The combined results of all of Gulf Watch Alaska’s monitoring sites, along with the efforts of multiple research teams and nearly 50 years of data, have revealed some significant trends in recent years. These trends are having a profound impact on marine life in the gulf.
http://research.cfos.uaf.edu/sewardline/Physics_time-series.html
Along the Seward Line, specifically, researchers have noted a 3°C (5.5°F) temperature variation during the May cruises from 1998 and 2016. While seemingly minor, these changes have influenced a host of critical factors. They found, for example that in warm years, the growth rate and timing of the spring phytoplankton bloom was smaller and occurred earlier than in colder years. Likewise, they detected that peaks in zooplankton production came earlier, and were smaller and shorter during warm-year periods. Results have also revealed that, in general, macro-nutrients, such as nitrate, phosphate and silicate, which help fuel the phytoplankton bloom, are depleted earlier in warm years and later in cold years.

