Last updated: August 30, 2017
Article
Shallow repeating seismic events under an alpine glacier on Mount Rainier: stick-slip glacier sliding events or volcanic earthquakes?
Importance
Sequences of small shallow repeating earthquakes occur often at Mount Rainier but escaped our detection until recently. Both glaciers and volcanoes can generate repeating earthquakes, and the seismic signals of the two can be virtually indistinguishable, but Mount Rainier has the highest at-risk population of any US volcano so a correct interpretation of the seismic source is critical. Our analysis of data from permanent seismic and weather stations on the mountain suggests that these sequences are generated by glaciers reacting to snow-loading during intense storm events and are not signs of a reawakening volcano.
To test this hypothesis, in 2012 we used a ground-based portable radar interferometer (GPRI) to monitor glacier velocities before, during, and after a snowstorm (and associated repeating earthquake swarms appeared) to test whether a small additional added load of snow could change the sliding behavior of a glacier. An additional benefit of this work is we have collected spatially continuous velocity measurements of glacier motion for the Nisqually, Wilson, Emmons, and Winthrop glaciers that can lend insight to the dynamics of alpine glaciers.
Status and Trend
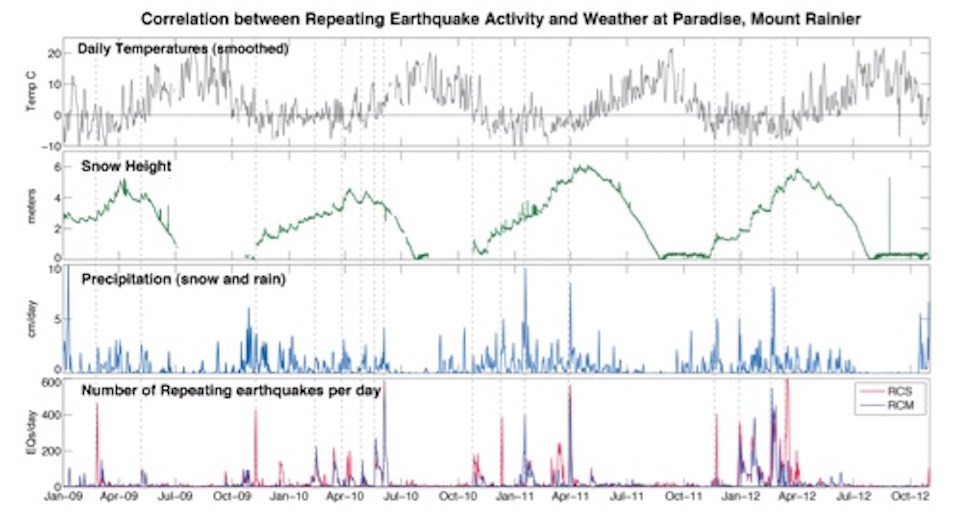
Though we now know that the repeating earthquakes we are investigating have occurred every year for as long as we have continuous seismic data, this type of seismic activity has not previously been documented in detail at Mount Rainier because the earthquakes are too small to be detected automatically by the seismic network. The sources of the repeating earthquakes are primarily located at high glacier-covered elevations (>3 km above sea level). The waveforms of these earthquakes are lower frequency than regular earthquakes of comparable size and closely resemble volcanic earthquakes from a low-frequency source such as resonance of fluid (e.g. gases, magma, or geothermal fluids) in cracks. The strongest indication that the source of these repeating earthquakes is glacial and not volcanic is that the onset of repeating earthquake activity is strongly correlated with intense snowfall at high elevations. A comparison between weather and repeating earthquake occurrence is shown on Figure 1.

Figure 1 Number of repeating earthquakes detected per day detected at seismic stations located at Camp Schurman (RCS) and Camp Muir (RCM) compared with weather data recorded at Paradise. The start of each sequence detected since June 2009 is noted by a dotted line.
Discussion
The focus of our work in 2012 was to test the hypothesis that these repeating earthquakes are generated by stick-slip sliding at the bed of glaciers that occurs when they are loaded with snow. A change in glacier velocity and/or the increased load due to the weight of new snow could cause the sliding behavior of the bed of the glacier to change from smooth (no quakes) to stick-slip sliding (quakes). This would generate the observed repeating earthquakes if the sticky spot was stationary or slowly moving like a patch of boulders or a bedrock bump and could generate observable changes in glacier velocity at the surface.
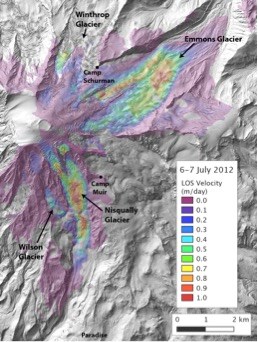
We used the ground-based GAMMA portable radar interferometer (GPRI) developed by GAMMA Remote Sensing, Inc. to monitor for detectable changes in glacier motion before, during, and after these seismic episodes in the late Fall 2012. A July 2012 pilot study conducted at Paradise and Sunrise (imaging the Nisqually, Emmons and Winthrop glaciers) showed that the GPRI could measure spatially-continuous surface displacements at distances greater than 8 km. We measured maximum surface velocities toward the instrument (line-of-sight) of 1.8 and 1.3 m/day for the Nisqually and Emmons glaciers, respectively (Figure 2). We returned in November and December and resurveyed the Nisqually glacier (Emmons was not accessible) before, during, and after a heavy snowfall event and corresponding repeating earthquake swarm occurred. Though we are still processing this data, preliminary analysis shows that glacier velocities did change in response to the added load of snow, becoming slower in some areas and faster in others.

Figure 2: Glacier velocities measured during the pilot study on July 6-7, 2012, using the Gamma Portable Radar Interferometer (GPRI). Velocities are line-of-sight (LOS) meaning they show motion only directly toward or away from the GPRI, which was located near Paradise for the south side of the mountain and off the northeast corner of the map near the Sunrise Visitors Center for the north side of the mountain. The colorscale is saturated at 1 m/day, for best viewing, but maximum measured LOS velocities were 1.3 for m/day and 1.8 m/day for the Emmons and Nisqually glaciers respectively.
