Importance

NPS/J. Pfeiffenberger
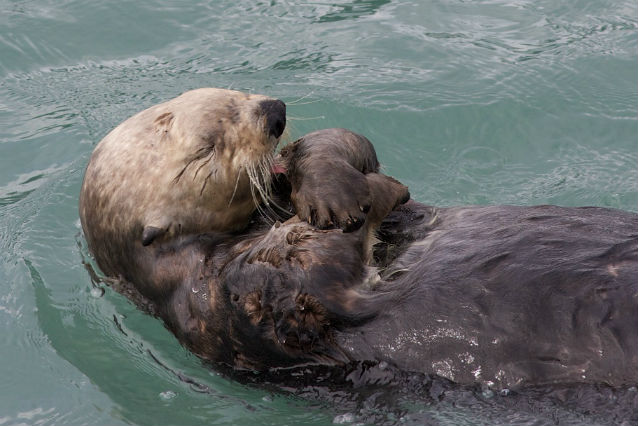
Sea otters (Enhydra lutris) are known as a keystone species. A keystone species dramatically affects the structure and complexity of their environment. For example, when sea otters are present in rocky habitats, they eat sea urchins and urchin density decreases as a result. Lower urchin density reduces grazing pressure on kelps, resulting in a more diverse nearshore ecosystem (Estes and Duggins 1995). In 2005, sea otter populations in the southwest Alaska population segment (which includes coastal habitat of Katmai National Park and Preserve) were listed as threatened under the Endangered Species Act. Further, the U.S. Fish and Wildlife Service designated almost 6,000 miles of coastline in southwest Alaska as critical habitat for the northern sea otter. Critical habitat is habitat that is deemed essential for the conservation of a threatened (or endangered) species. Monitoring sea otter populations, as well as other components related to sea otter status, in nearshore ecosystems will result in important information to better understand population trajectories.
Methods

NPS/J. Pfeiffenberger
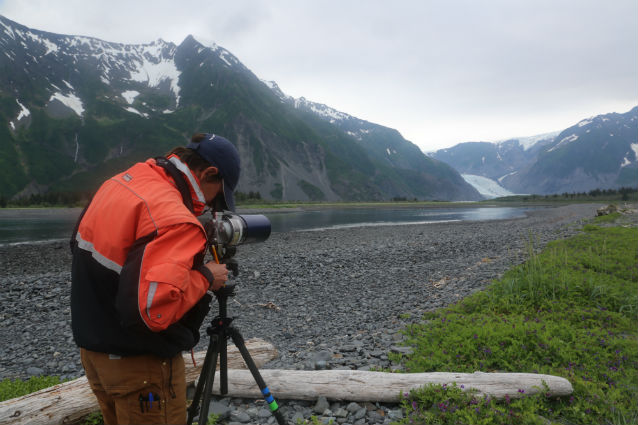
There are three different ways sea otter data are collected: fly aerial surveys to estimate abundance, conduct foraging observations to estimate energy recovery rates, and collect carcasses to estimate the age-class distribution of the dying otters.
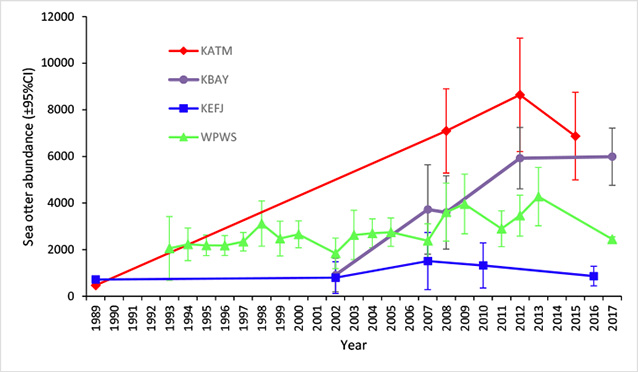
Aerial surveys are conducted in order to calculate sea otter abundance. Surveys were flown in Katmai National Park and Preserve in 2008, 2012, and 2015; Kenai Fjords National Park in 2002, 2007, 2010, and 2016; and western Prince William Sound annually from 1993-2005, 2007-2009, and 2011-2013, and 2017. Surveys were also flown in Kachemak Bay, an area adjacent to Kenai Fjords National Park and across Cook Inlet from Lake Clark National Park and Preserve, in 2002, 2007, 2008, 2012, and 2017.
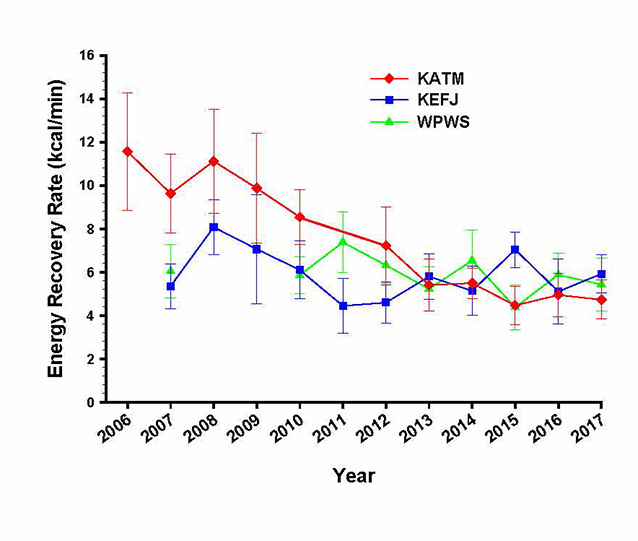
Sea otter foraging data are collected annually in Katmai, Kenai and Prince William Sound to estimate energy recovery rates (kcal/min). These rates are used to indicate population status relative to a food-limited carrying capacity. In biology, carrying capacity is the maximum population size of a particular species that the environment can sustain indefinitely given the food, habitat, and other necessary environmental resources. Beginning in 2018, the U.S. Geological Survey will also be collected foraging data in Kachemak Bay.
Carcass surveys also occur annually. To date, very few carcasses have been found in Kenai Fjords National Park, presumably because of the relatively low density of sea otters in the area and the lack of low sloping beaches that could act as repositories for carcasses. Carcasses are collected every year from Katmai National Park and Preserve and western Prince William Sound. Carcasses from Kachemak Bay are monitored by the U.S. Fish and Wildlife Service.
Findings
In Katmai National Park and Preserve, our data suggest that sea otter numbers increased substantially since the early 1990s and have been at high and stable densities in recent years (Figure 1). This corresponds with declining energy recovery rates, suggesting that otters have reached a food-limited state (Figure 2).
Densities of otters in Kenai Fjords National Park, while relatively low, have been stable since 2002 (Figure 1) with stable energy recovery rates (Figure 2), indicating a population at carrying capacity with low food availability in comparison to Katmai. Unlike Katmai, which has extensive shallow, soft-sediment habitats ideal for clams, Kenai Fjords is predominately a glacial fjord ecosystem. It’s “steep and deep” characteristics can be unfavorable for clams. The low availability of clams likely contributes to the lower density of otters in the park.


Initially, in western Prince William Sound, food was not a limiting factor in sea otter recovery from the Exxon Valdez oil spill. More recently, we have observed a moderate increase in sea otter population density, with a subsequent decline in energy recovery rates. This indicates that the population may be reaching its carrying capacity for this region (Figures 1 and 2).
Kachemak Bay has shown an increase in sea otter abundance and density estimates since surveys began in 2002 (Figure 1). We will initiate foraging observations to estimate energy recovery rates beginning in 2018.
The design and coordination of our monitoring program allows us to infer potential causes and spatial extent of the observed changes in abundance that have occurred through time (Coletti et al. 2016).
For More Information
Contact Heather Coletti, heather_coletti@nps.gov https://www.nps.gov/im/swan/
Estes, J.A. and D.O. Duggins. 1995. Sea otters and kelp forests in Alaska: generality and variation in a community ecology paradigm. Ecological Monographs. 65: 75-100.
Coletti, H. A., J. L. Bodkin, D. H. Monson, B. E. Ballachey and T. A. Dean. 2016. Detecting and inferring cause of change in an Alaska nearshore marine ecosystem. Ecosphere 7 (10): e01489.10.1002/ecs2.1489
Click here to print a copy of this article.
Updated March 2018

Last updated: October 26, 2021
