Last updated: January 29, 2018
Article
Monitoring Permafrost
Permafrost conditions and processes
T.E. Osterkamp
Geophysical Institute, University of Alaska, Fairbanks, Alaska 99775, USA
M.T. Jorgenson
ABR, Inc., Fairbanks, Alaska 99701, USA
Osterkamp, T.E., and Jorgenson, M.T., 2009, Permafrost conditions and processes, in Young, R., and Norby, L., Geological Monitoring: Boulder, Colorado, Geological Society of America, p. 205–227 doi: 10.1130/2009.monitoring(09). For permission to copy, contact editing@geosociety.org. ©2009 The Geological Society of America. All rights reserved.
Introduction
Permafrost and the Rationale for Monitoring
Historical Perspective
Permafrost is ground (soil or rock and included ice and organic material) that remains at or below 0 °C for at least two consecutive years. Permafrost terrain consists of an “active layer” at the surface that freezes and thaws each year, underlain by perennially frozen ground. The top of permafrost is at the base of this active layer. The base of permafrost occurs where the ground temperature rises above 0 °C at depth (Osterkamp and Burn, 2002). In some cases, temperature measurements over a period of two years are required to determine the presence or absence of permafrost. Temperature measurements are also required to determine the status of the permafrost. Permafrost that is warm and/or warming is in danger of thawing.
Approximately 25% of the exposed land area of Earth and ~80% of Alaska are underlain by permafrost. Mountain permafrost occurs at high elevations in western North America and on Mount Washington in New Hampshire. Permafrost has also been found near the summit of Mauna Kea in Hawaii.
Permafrost is a product of cold climates. The fi rst permafrost on earth must have existed prior to or formed coincidentally with the first glaciation, ~2.3 billion years ago. Permafrost occurrences, distribution, and thicknesses must have increased during periods of cold climates and decreased during warm intervals. Permafrost may have disappeared in the Arctic ~50 million years ago. The current permafrost in Alaska appears to have been initiated during the climatic cooling that began ~2.5 million years ago. During the past million years, there is evidence of repeated glaciations at ~100,000-year intervals, and permafrost thicknesses varied significantly in response to them (Osterkamp and Gosink, 1991). The last glacial period ended ~12–14 thousand years ago. About 8–10 thousand years ago, the climate may have been slightly warmer than present. During the last millennium, there was a warm period in the medieval era, followed by a “little ice age.” Permafrost is currently responding to the global warming since then.
Global air temperatures have increased since the mid-1800s (Hansen and Lebedev, 1987). Increases in air temperatures have resulted in an increase in permafrost temperatures. However, other climatic factors, especially timing, duration and accumulation history of the annual snow cover and site wetness impact permafrost temperatures. These factors modify the effects of changes in air temperatures (Zhang et al., 1996).
The climatic changes of the past century coupled with recent observations of warming and thawing permafrost have caused concern about the future of permafrost (PCCGR, 1983; McBeath, 1984). Thawing permafrost in natural settings has been observed in Alaska (Osterkamp, 1994, 1995; Osterkamp et al., 1998, 2000; Jorgenson et al., 2001a). Warming of the permafrost has continued into the twenty-first century in Alaska, Europe, Svalbard, Canada, Russia, China, and Mongolia (Phillips et al., 2003). There are increasing reports of thawing permafrost and thermokarst terrain (an irregular topography resulting from thawing permafrost containing excess ground ice) in Alaska (Osterkamp et al., 2000; Jorgenson et al., 2001a; Jorgenson and Osterkamp, 2005). Thin permafrost is thawing from the bottom
up at some sites (Osterkamp, 2003a; 2005). Ice wedges are thawing in the Alaskan Arctic where temperatures were thought to be too cold for this to happen (Jorgenson et al., 2006).
Global circulation models predict that air temperatures will increase up to 5 °C in the next half century (Maxwell, 1992). Since continuous permafrost (a region where permafrost occurs everywhere beneath exposed land surfaces) is typically colder than −6 °C, no widespread thawing is expected, although some areas may experience localized thawing, slope instability and ice wedge thawing. Discontinuous permafrost (a region where some areas are free of permafrost) and mountain permafrost (permafrost existing at high altitudes) at low latitudes are much warmer, so any climatic warming will cause thawing. A warming of just a few degrees would cause most of it to begin thawing. Thawing proceeds from the top downward and, eventually, from the bottom upward. Thawing rates are slow, initially on the order of 0.1 m per year near the surface, and theoretically less than 0.02 m per year at the base (Osterkamp, 1983). Thus, times ranging from decades to millennia are required to thaw discontinuous permafrost.
All of the national parks and preserves on mainland Alaska are at least partially underlain by permafrost. Those south of the Yukon River and on the south side of the Seward Peninsula are underlain by warm, discontinuous permafrost, typically within a few degrees of thawing. Recent sparse measurements indicate that much of it is within a degree of thawing (Osterkamp, 1983; 1994; 2005; 2007). These measurements also show that it has warmed significantly during the last quarter century (Osterkamp and Romanovsky, 1999; Osterkamp, 2003a; Osterkamp, 2005; 2007). Thawing permafrost, landslides, and thermokarst terrain have been observed in and around these parks (Osterkamp et al., 2000; Jorgenson et al., 2001a; Jorgenson et al., 2006). An estimated 100,000 km2 of mountain permafrost occurs in the contiguous states at elevations as low as 2200 m (Péwé, 1983). Many of the parks in the western United States have mountainous areas with higher elevations. While there is little information available, mountain permafrost in the contiguous states is also thought to be very warm (within a degree or two of thawing). Because ice helps bond slope deposits, landslides and thaw slumps are expected to occur when these areas thaw (Huscroft et al. 2004). In addition, permafrost impedes subsurface drainage, creating wet to moist conditions that provide good habitat for many alpine plant species. Thawing of the permafrost would increase drainage and dry the soil, thus impacting the vegetation.
The combination of the above observations and conditions and the predicted climatic warming of the twenty-first century are cause for concern about the future condition of permafrost in national parks and preserves in Alaska and in the mountains of the contiguous states. Thus, it is important to determine what changes have already occurred, to determine the current status of the permafrost, and to monitor changes that may occur in the future.
Cause for Concern
Why should there be concern for thawing permafrost? Current climatic scenarios predict up to 5 °C of additional warming of the air temperatures in Alaska and the Bering Sea regions over the next century (Weller et al., 1995). At the low end of the predicted warming (2–3 °C), most of the discontinuous permafrost in Alaska would thaw, creating many attendant problems (Osterkamp, 1983; PCCGR, 1983; Nelson et al., 1994; Osterkamp et al., 1998). Thawing of ice-rich permafrost and creation of thermokarst terrain has been identified as one of the primary problems facing northern ecosystems as a result of climatic warming (Osterkamp et al., 2000; Jorgenson et al., 2001a). While smaller changes are predicted for the contiguous states, any warming there would cause some of the mountain permafrost to thaw.
Boreal forests typically cover discontinuous permafrost in interior Alaska below elevations of 700–1000 m. Sparse data around these parks indicates that permafrost there is usually
within 1–2 °C of thawing. The edges of isolated permafrost bodies are already at the thawing point. If the observed warming of the permafrost underlying boreal forest ecosystems in Alaska continues, then additional permafrost will thaw. Where the permafrost is ice-rich (roughly 50% ice), thawing changes the ice to water, creating a mud slurry that cannot support the weight of overlying soil or vegetation, thereby degrading the physical foundation of terrestrial ecosystems. The observed effects are that the ground subsides, and landslides and thermokarst terrain develop, consisting of channels, pits, troughs, potholes, ponds, lakes, and “drunken forests” (trees leaning in random directions). In addition to these broad-scale climatic effects, thermokarst terrain can also be produced locally by disturbances associated with fires, floods, and human and animal disturbances.
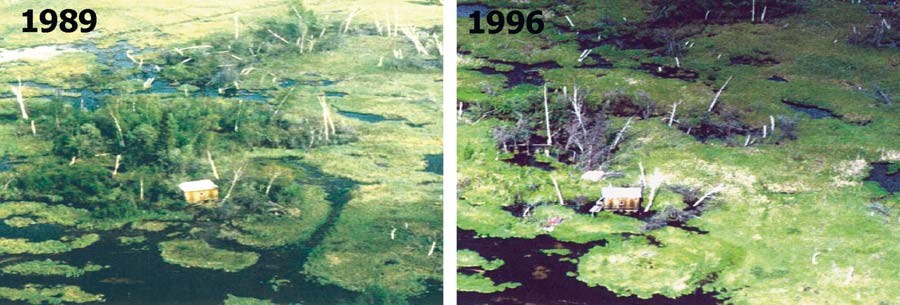
Thermokarst drastically modifi es and remolds the ground surface and alters surface and groundwater hydrology. This process can modify or totally change ecosystems, human activities, infrastructure, and the fluxes of energy, moisture, and gases across the ground surface-air interface. Plant species composition and distribution, plant community productivity, soil chemistry, biological activity, and nutrient supply for plant use can be substantially altered by this geological phenomenon. Drainage conditions determine whether standing water will be present. The affected trees usually die, and vegetation changes significantly (Fig. 1). These changes in the flora have a direct impact on fauna. In lowlands or relatively flat areas, a shift from boreal forests to shrub swamps and wet meadows often occurs with concurrent changes in bird and animal populations (Osterkamp et al., 2000; Jorgenson et al., 2001a, 2006). The new ecosystems often favor aquatic birds and mammals.
Thus, the result of thawing ice-rich permafrost in a boreal forest ecosystem is not just a slight shift in the nature of the ecosystem, but rather partial or total destruction of the ecosystem and replacement with a new ecosystem.
Time scales to create thermokarst terrain are around a decade, but can range from several years to centuries. Time scales for recovery of the ecosystems appear to range from centuries to millennia although, in many cases, recovery may be impossible because of permanent changes in relief, drainage, and other factors.
Need for Monitoring
Although little can be done about the terrestrial and ecological changes associated with natural thermokarst, knowledge about the patterns and processes of thermokarst development is essential for anticipating the potential impacts and for developing rational responses to them. Detailed observations and measurements of the thermal regimes and physical conditions of the permafrost are needed.
Permafrost conditions in the parks and preserves of Alaska and the mountains of the contiguous states depend on a number of factors. Thus, monitoring sites need to be developed in each park to span the range of conditions found there. Accordingly, this chapter makes recommendations for standard methods for observations and measurements that can be applied across a network of parks to determine what changes have already occurred, document current conditions, and monitor future changes.

The permafrost terrain is "inflated" (heaved upwards) nearly 3 m during permafrost formation due to ice growth. The ground surface then settles or compacts a similar amount during thawing of the ice-rich permafrost. (Photo by T.E. Osterkamp.)
Factors Influencing Permafrost
Factors that influence permafrost are those that cause its surface and internal temperatures to vary as a result of changes in the energy balance at its surface (including sides and bottom). These factors can include: climate (air temperature, precipitation as rain or snow, wind); physical terrain (topography, slope, aspect); hydrology (surface drainage and site wetness, proximity of nearby water bodies, presence of underground water, flooding); vegetation (shading, insolation, snow interception); geology (soil and rock, geothermal heat flow, tectonic setting); and disturbances (human, animal, fire). These factors operate at different time (days to millennia) and spatial (local to regional) scales. Our primary concern is with changes in permafrost conditions ranging from annual to multi-decadal periods. Consequently, this chapter is concerned with monitoring factors that vary significantly over these time scales. Annual changes in permafrost temperatures are caused primarily by changes in air temperatures, snow cover, site wetness, and disturbances. In terms of spatial scale, monitoring should address detailed changes at the site level, along with remote sensing to quantify changes at landscape and regional scales.
Mapping Permafrost for Site Selection
As an initial step toward establishing a network for monitoring permafrost conditions, it is necessary to understand the permafrost distribution within a given area or park. Information on permafrost distribution at the landscape level (1:100,000 scale) could include: (1) compilation of information from detailed field soil surveys and mapping; (2) photo-interpretation of Landsat images by an expert knowledgeable in interpreting periglacial and thermokarst features; or (3) spatially explicit thermal modeling of ground temperatures. This information can be used for the design of a monitoring network, park planning, and assessment of regional ecosystems.
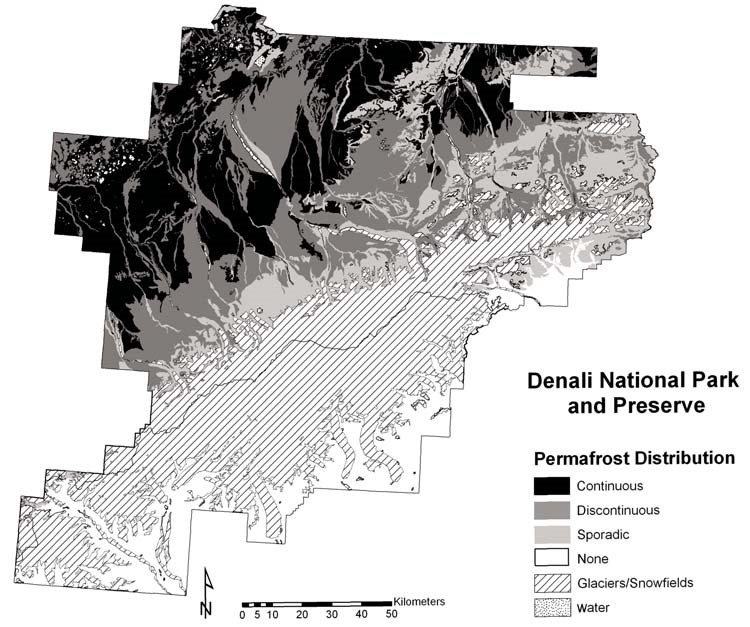
Detailed field soil and ecological inventories have been completed for three parks in Alaska, and the differing mapping products for these parks provide useful examples of how existing soils information could be used to delineate permafrost. In Denali National Park and Preserve, an ecological landscape unit map was created by the National Resource Conservation Service (Clark and Duffy, 2003) that incorporates attributes for surficial geology, soil thermal regime and permafrost abundance (Fig. 2). This map could be used to identify fine-grained lowland deposits with permafrost that would be at high risk for thermokarst, or coarse-grained, stable upland areas where thermokarst potential is low. Similarly, the ecotype map for the Bering Land Bridge National Preserve (BELA) and Cape Krusenstern National Monument (Jorgenson et al., 2004), and the ecological unit map for the Kobuk portion of the Gates of the Arctic National Park and Preserve (Swanson, 2000, 2001a) have units with closely associated soil taxon and permafrost characteristics. In BELA, Lowland Sedge Fen Meadows and Upland Moist Dwarf Birch–Tussock Shrub ecotypes usually are associated with ice-rich permafrost, while the Alpine Alkaline Dry Barrens and Riverine Barrens usually have ice-poor permafrost.
While landscape-level soil mapping for Denali included a specific attribute for permafrost abundance, standard soil maps also are useful because of the incorporation of permafrost soils in the soil taxonomy (NRCS, 2003). When using soil maps, there are certain terms to look for. The Gelisol order is specific to permafrost soils that have permafrost within one meter of the soil surface, or permafrost within two meters of the soil surface if the top meter shows evidence of cryoturbation. Some groups (e.g., Hemic Glacistels) are specific to extremely ice-rich soils. In addition, the Gelepts suborder within the Inceptisols differentiates soils that have permafrost below 2 m. These tend to occur in ice-poor rocky soils in alpine areas.
Modeling is another approach that can be used to predict permafrost distribution. The modeling can employ simple index models based primarily on air temperatures (Nelson, 1986; Anisimov and Nelson, 1996) or more data-intensive models that also incorporate topography, soils, vegetation, and snow (Jorgenson and Kreig, 1988; Wright et al., 2000; Jorgenson et al., 2003). The modeling is particularly helpful for hilly or mountainous terrain. Accurate modeling, however, is dependent on site-specific parameterization of these thermal characteristics. In addition, groundwater is an important factor affecting the distribution of permafrost in the discontinuous permafrost zone, but this is absent from current modeling approaches.
Desirable Site Conditions
Preliminary selection of monitoring sites can be done using existing information such as soil surveys, topographic and surficial geology maps, satellite images, and aerial photographs. However, at least two field trips to proposed major sites (those where multiple observation and measurement methods will be employed) should be made during summer and near the time of maximum snow thickness to determine site conditions and select the precise location of the site. The site conditions discussed below are specific to permafrost observatories (including boreholes) designed to study the effects of climate change on permafrost and thermokarst terrain. Some of the conditions are chosen to make data acquisition and analyses easier for the investigator, such as accessibility and terrain. Sites for thermokarst studies must be selected where thermokarst exists. However, requirements can vary depending on whether the site is for thermal monitoring in deep boreholes, where uniform characteristics are desired, or for thermal and physical monitoring along long transects, where a range of ecological conditions is preferred.
Existence of permafrost. Obviously, permafrost should exist at the site. This can be hard to determine where there are substantial areas with no permafrost or where rocky soils make probing or drilling difficult. In some cases, probing and/or temperature measurements may be necessary to confirm whether or not permafrost exists at a site.
Access. Good access is preferable for intensive monitoring sites, due to the high costs of helicopter or airplane access. This usually dictates placing sites near existing road or trail systems, or in areas that can be reached during winter with over-the-snow transport systems.
Availability of long-term climate data. It is desirable to have major sites near a long-term weather station. The availability of climatological data supplements the site measurements and, after a few years, the measurements can be used to conduct site-specific calibrations of models. Past climatological data can then be used to drive the calibrated models to calculate realistic values for active layer and permafrost conditions for the period of record (Osterkamp and Romanovsky, 1999). The calibrated models can also be used to project permafrost conditions into the future using climate scenarios produced by global climate models.
Terrain. For ease of interpretation and to maximize the usefulness of the data, it is desirable to place sites for deep borehole monitoring in relatively flat, undisturbed terrain (as determined from aerial photographs and topographic maps). The surrounding area should be relatively flat to a distance of at least three times the depth of the hole. However, if the only purpose of the site is to determine change, then sites on slopes and ridges and in hilly terrain can be utilized. For measurements of shallow ground temperatures and physical characteristics, terrain with a range of ecological characteristics is preferable.
Snow cover. The most desirable borehole sites are those where snow cover is relatively uniform and where drifting is not a major consideration. Along transects, snow cover can be expected to vary.
Hydrology. Borehole monitoring sites should be placed far from the influence of water bodies, springs, potential groundwater flow, floods, icings, and areas of unusual ground wetness caused by surface drainage. Seeps can be identified during summer, and icings will be obvious during spring. For physical monitoring along transects, groundwater and surface water can be expected to vary as thermokarst develops.
Geology. Geothermal heat flow and the soil or rock in the vicinity of a deep borehole site should be relatively uniform. This rules out areas with sharp topographical changes and makes those near active volcanoes or mud volcanoes suspect. Variation of soil and surficial deposits along transects is preferable. Locating transects on bedrock is not appropriate.
Vegetation. Areas that have uniform conditions on the surface and in the sub-surface are the most desirable for borehole monitoring. Thus, boundaries between ecosystems, forest edges, and any sharp changes in vegetation should be avoided. Burned areas should also be avoided, except in thermokarst studies. Variations in ecological characteristics along a transect are preferred.
Security. It is necessary that the study sites be secure from human intrusion and disturbance over long time periods (preferably a century or more). This helps to ensure that the sites will remain pristine so that observed changes can be attributed to natural events.
Impacts on Ecosystems
Permafrost in Alaska and mountain permafrost in the contiguous states forms the physical foundation on which terrestrial ecosystems and infrastructure rest. Where the permafrost is ice-rich, the potential problems associated with thawing are illustrated in Figures 1, 4, 5, and 8. Mountain permafrost exists in alpine ecosystems, and the primary problems there are associated with slope instability caused by thawing permafrost (thaw slumps, landslides, rockfalls), thaw settlement (thermokarst), loss of the impermeable layer that impedes drainage in moist to wet ecosystems, and damage to infrastructure. Thus, there are both economic and ecological reasons to monitor permafrost, including mountain permafrost.
VITAL SIGNS MONITORING DESCRIPTIONS
The vital signs (thermal and physical states of permafrost) and study methods discussed below were selected to answer critical questions about the influence of thawing permafrost on ecosystems under a climate-warming scenario. Progression is from simple to more complex methods of study. Only a few methods are described, but several may be available in the literature. Complex and expensive geophysical (Brown, 1985) or remote sensing methods are avoided because they are not practical for widespread, routine monitoring. It is highly recommended that an expert in permafrost studies be made part of any monitoring team from the beginning to provide advice, training, help with the experimental design, and help with the many facets of site selection.
Thermal State
Permafrost is defined by its temperature, which determines its physical condition. The phase equilibrium temperature (0 °C) is critical because warmer ground cannot contain permafrost. The mean surface temperature is of primary interest, since this is the surface boundary condition that influences future thermal states. If the surface temperature warms and stays warm for a long time, the warming will penetrate slowly downward until it reaches the base of the permafrost, whereupon thawing will begin there. Permafrost with mean surface temperature colder than −3 °C is not in immediate danger of thawing. However, under warming climatic conditions, permafrost within a degree or two of thawing may soon begin to do so. Monitoring the full temperature profile of a deep borehole and the corresponding surface temperature history can tell us if the permafrost is warming or cooling, if it is in danger of thawing, if it is thawing, and the rate of thawing at its surface and base (Osterkamp, 2008).
Level 1. Determination of Frozen or Thawed State
A first step in studying permafrost is to determine its presence or absence and its distribution in the park. Initially, soil survey maps, reconnaissance permafrost maps, or spatial modeling should be used to identify areas where permafrost is likely. Field work to confirm the presence of permafrost is done by physically probing the ground with a handheld probe to determine the presence and depth to an underlying frozen layer (permafrost surface). The presence of permafrost is inferred when the probe strikes a hard surface. This can be uncertain in areas with gravel, rock, or hard subsurface layers, or where the permafrost table is deep; thus, a temperature measurement may be required. The presence of permafrost can also be confirmed, where it is shallow, by digging a pit and visually confirming the presence of ice in the soil in late summer. Generally, it is desirable to make temperature measurements at a few selected points to positively establish the presence of permafrost. When coupled with a temperature measurement made at the top of the hard surface, probing in late summer gives the depth to the permafrost surface (active layer thickness). The depth to the top of permafrost in saturated soils is typically less than one meter, although it may reach several meters in coarse dry soils or rock.
Probing is usually done once a year, in late summer or early fall, near the end of the thaw season and just before the time that decreasing ground surface temperatures reach 0 °C. Only one person is necessary, although two are desirable since removing probes from the soil can be strenuous. A tile probe is used, which many researchers fabricate out of metal rod. The tip of the rod should be slightly larger than the shaft to facilitate insertion and removal. In practice, the probe is pushed into the soil using the weight of the observer. Downward motion ceases when the tip reaches the permafrost surface. It may be useful to raise the probe a few centimeters and thrust the tip downward again. Hitting frozen soil makes a dull thud, while rock makes a distinct clinking sound. The depth is then recorded to the nearest centimeter and the probe removed. The error in the measurement is usually a few centimeters, partly because of compressible vegetation at the surface and also because of the potential presence of a somewhat “soft” (partially frozen) layer near the permafrost surface that contains unfrozen water and ice. For areas where the permafrost has already thawed, extensions can be added to the tile probe to reach depths of 3 m or more. This is ore difficult and requires two people to push and retract the probe. Alternatively, a probe
powered by a mechanical driver can be used (Esch, 1982). In cases where permafrost is not found, the observer should record the maximum depth of probing.
A hollow probe may be used to remove uncertainty about the presence or absence of permafrost. Once the maximum depth of penetration has been reached, a temperature sensor (usually a thermistor on the end of a wire attached to a commercial readout) can be lowered inside the rod to the tip. The temperature is then recorded to the nearest 0.1 °C. Alternatively, the probe could be removed and a commercial soil temperature probe inserted to the bottom of the hole. This temperature should be close to 0 °C, unless salts are present that lower the phase equilibrium temperature at the permafrost surface. If desired, a transect can be made by probing at intervals along a tape measure laid on the ground. The recorded data (date, time, location, vegetation, soil type, depth of permafrost, and temperature if measured) need little interpretation. A simple graph of location versus depth to permafrost provides a visual image of the permafrost surface.
The equipment required consists of a probe, tape measure, a method of determining position (e.g., a long tape), and a method for measuring temperature. If the same site is to be probed annually, then a method for returning there needs to be established, such as stakes driven into the ground, or a borehole pipe as a bench mark. Geographical coordinates should be measured for all reference markers with a Global Positioning System (GPS).
The level of expertise required is that of a trained Student Conservation Association member (SCA) or volunteer. On-site training by a scientist (half a day, one time only) is needed. A soil probe and a temperature measuring device would be required. Costs would be low (less than $1,000; all amounts herein in US$) unless a mechanically powered probe was needed and had to be fabricated. A 100 m line, or ~50 points, could be probed in about
half a day. Data reduction, graphics, and archiving requires a scientist for about half a day.
Level 2. Permafrost Surface Temperature
The surface temperature history of permafrost is the upper boundary condition that plays a major role in determining its internal temperatures. Surface temperatures can be measured using relatively simple and inexpensive dataloggers about the size of a match box or cigar. These loggers, which have an accuracy of 0.5 °C or better, are placed near the permafrost surface and programmed to measure temperatures every 2–4 hours. While some dataloggers can be left in place for several years without replacing batteries or retrieving data, the usual procedure is to return once a year in summer to retrieve the data and replace batteries.
The access hole for the dataloggers has to be big enough for the casing in which the logger is to be placed, and should penetrate ~0.3–0.4 m into the permafrost. In fine-grained soils, the hole can be drilled by hand with a soil auger. However, if soils are coarse or the permafrost surface is deep, this can be difficult, and a gasoline powered soil auger should be used. In some cases, this method cannot be used because of difficulties with soil and rock conditions or because the permafrost surface is too deep. An alternative method involves driving a hollow probe to the permafrost surface, leaving it permanently in place, and inserting a temperature sensor attached to a datalogger (Osterkamp and
Harrison, 1982).
Care should be taken to keep the site pristine. This can be done by drilling through a thin piece of plywood (or a very stiff tarp) large enough to stand on, so that the cuttings are deposited onto the plywood. This way, the vegetative mat around the hole is not severely compressed, soiled or torn.
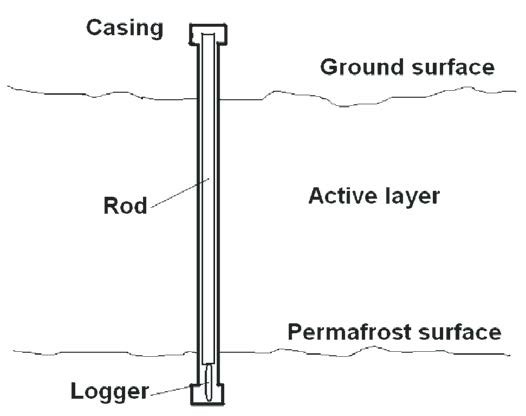
A casing consisting of thin-walled metal tubing or plastic pipe is then installed in the hole (Fig. 3) with the top extending a few tenths of a meter above the ground surface. Cuttings from the hole are used to backfill around the casing. Backfilling should be done slowly and carefully to prevent any air gaps around the casing. Tamping with a small rod is helpful. It is important to provide a flange or cap at the bottom of the casing (Fig. 3) to seal it and to prevent it from being heaved out of the ground during freezing of the active layer.
After it has been prepared according to manufacturer’s directions, the logger is suspended inside the casing ~0.2–0.3 m below the surface of the permafrost on the end of a wooden rod or wire. The purpose of the rod is to prevent air convection in the casing. If a wire is used, pipe insulation that fills the casing should be placed between the logger and top of the casing. A removable waterproof cap should be placed on top of the casing. Water leaking into the casing will freeze the logger into the casing. When the annual data are retrieved, it is processed according to manufacturer’s instructions and usually displayed graphically.
An alternative is to use a multi-channel datalogger to measure both the ground (5 cm depth) and permafrost surface (typically 1 m depth) temperatures. The permafrost surface temperature sensor can be installed by driving a metal rod into the permafrost, removing it, and then inserting the sensor in the hole. The datalogger, which should be waterproof, can be placed under the vegetative mat to shield it from temperature extremes.
The installation of one datalogger at one site can be done by one trained SCA/volunteer in about half a day. Training, consisting of a supervised installation by a scientist (one day, one time only) at one or two sites is needed. A scientist would be needed for preparation of the datalogger, (less than half a day). A soil auger, plywood, casing with caps for both ends, datalogger and readout device, and rod or wire (with insulation) are also needed. The costs for equipment are less than $1,000 per site. Data reduction, graphics, and archiving for the annual data from one site requires a scientist for half a day.
Level 3. Permafrost Temperature Profiles
Vertical temperature profi les measured through the full thickness of the permafrost and into the underlying unfrozen material can be used to determine the annual mean temperature at the permafrost surface; annual amplitude with depth; thermal properties; heat flow (in the permafrost and into the permafrost from below); phase equilibrium temperature at the base of the permafrost; and thawing or freezing rates at the base of the permafrost. A borehole is required for access to the permafrost. Criteria for site selection are discussed in the previous section.
Ideally, sampling should be done in each formation encountered during drilling, as determined from the drill cuttings. However, repeated sampling can quickly drive up drilling costs. Drill cuttings for the relatively shallow holes drilled in parks for permafrost investigations are suffi cient to identify soil and rock types. When the drilling is completed, a galvanized iron water pipe (typically ¾ inches inside diameter) is placed in the hole, which is backfilled with cuttings from the hole. The backfilling must be done slowly and carefully to prevent bridging and air spaces around the pipe. Sand added to the cuttings helps alleviate these problems.
Two methods for measuring temperatures are commonly used. In the first, a single sensor on the end of a cable is lowered into the borehole while temperatures are measured automatically or manually (Osterkamp, 1985). This method is technically sophisticated and capable of accuracy better than 0.001 °C (Clow et al., 1996). In the second method, a commercially calibratedmulti-sensor cable is installed in the borehole. The cable may have an attached datalogger or the sensors can be measured manually with a portable commercial read-out device. While the accuracy is typically much lower, this method is still satisfactory for monitoring change. With a multi-sensor cable, depths are fixed and determined by the spacing of the sensors in the cable. Installation of the cable is done according to manufacturer’s instructions. Care should be taken to reference the sensor depths to the top of the pipe. Nonfreezing fluid (e.g., silicone) should be poured into the pipe to prevent any convection in the pipe, particularly if the cable diameter is much smaller than the pipe diameter. If a datalogger is used, it is necessary to download the data to a storage device according to the manufacturer’s instructions. The data are then returned to the office and transferred to a computer. With a manual read-out, the data are handwritten in the field and entered into a computer later. Examples of the data are shown later in this chapter.
The services of an expert are needed for site selection, drilling, cable installation, and detailed interpretation of the data. The annual data can be obtained by a trained SCA/volunteer or technician in one annual trip to the site (half a day). Data reduction, graphics and archiving for the annual data from one site requires a scientist for one day.
The information developed from permafrost borehole temperatures can be made more useful by adding measurements of air temperatures, ground and permafrost surface temperatures, and snow-cover thicknesses at the site (Osterkamp, 2003b). These supplementary measurements allow prediction of past and future permafrost temperatures using calibrated models.
Physical Conditions
Permafrost provides mechanical support for soil and vegetation development and controls hydrologic movement and, therefore, is fundamental to controlling ecosystem processes in cold environments. The characteristics of primary importance are microtopography, which affects surface-water movement, and the frozen/unfrozen status of the permafrost, which affects permeability and drainage. Changes in the water table or free drainage of the soil, due to microtopographic position or subsurface drainage, affects soil oxygen, decomposition, and nutrient cycling. These physical characteristics of permafrost can be assessed at three levels. First, a qualitative assessment of the presence or absence of various forms of thermokarst provides signifi cant information about ground ice and the potential for large-scale conversion of permafrost-dominated ecosystems into other ecosystems. At the second level, involving simple quantitative measurements, the most important parameters for monitoring are ground surface topography, thaw depths (frozen/unfrozen status), and water surface elevations. At the third level of effort, detailed descriptions and measurements of soil and ice stratigraphy from core samples or bank exposures help to evaluate rates of change and to develop predictions of how terrain and ecosystems are likely to evolve. Finally, remote sensing can be used to develop precise estimates of the extent and rate of permafrost degradation.
Level 1. Thermokarst Features
Observations of the presence or absence of thermokarst features can provide evidence of the nature and rate of change associated with permafrost degradation. These observations are particularly useful in lowland areas with ice-rich, fine-grained soils that are susceptible to thaw settlement, but are of little use in upland areas with coarse-grained, thaw stable soils. In high alpine areas, landslides and rock falls may indicate degrading permafrost. For most permafrost-affected areas, even basic information about the presence of thermokarst features is lacking. Interpretation of the presence and type of thermokarst can be greatly improved by the classifi cation of geomorphic features.
Two sampling designs for observing thermokarst and geomorphic features are appropriate, depending on whether the observations can be incorporated into other studies. The most cost-effective approach is to make the observations part of the sampling protocol for vegetation monitoring. Thus, vegetation changes can be linked to permafrost and geomorphic observations. Alternately, a separate effort can be made to make observations stratified by another environmental variable, preferably using ecosubsection or soil-landscape maps. For areas with road systems, the observations can be made along the road. For more remote areas, the observations can be made by fixed-winged aircraft or helicopter flying a low-level (100 m) flight route designed to sample one-third to one-half of the subsections within each park. The sampling should take one day for each park and should be done once every five years.
The classification of thermokarst features should be done according to the system described by Jorgenson and Osterkamp (2005). Photographs of the various classes are provided in Figure 4, and more detailed descriptions are given in the paper. A photograph should be taken at each location described for consistency review.
The classification of geomorphic features entails components at three scales: landforms (geomorphic units), macrotopography (slope shape and hillslope profile), and microtopography (periglacial features). The observer can use a national system if there is a need for standard terminology for all parks (NSSC, 2002). More concise and relevant systems have been developed for Alaska that are more appropriate for permafrost areas. This classification of landforms (also referred to as geomorphic units, terrain units or engineering geology) should follow the classification of Kreig and Reger (1982), which has been further refined for use in other areas of Alaska (Jorgenson et al., 1999, 2001b, 2004). Macrotopographic classification should follow that of the NSSC (2002). Microtopography should follow that of Washburn (1973), which has been updated by Jorgenson et al. (1999, 2004). A tabular listing of the more common classes is provided in Table 1.
Classification of thermokarst features requires a physical scientist or ecologist with one day of specialized training. The work can be a precursor to assess whether more intensive transect monitoring is required when thermokarst becomes evident. This type of reconnaissance level sampling should be done every five years. The materials needed in the field are a classifi cation protocol, field notebook or forms, shovel, 3 m tape, camera, and GPS. Classification of landforms, however, can be more complicated and requires more experience or specialized training. Classification of macro and microtopography can be done reliably with illustrated guides.

(5) thermokarst gully formed by downslope movement and channelization by water; (6) thermokarst mounds from minor uneven thaw settlement; (7) thermokarst pit filled with water on the Tanana Flats; and (8) the "moat' on the edge of a collapse-scar fen.
Photo trend plots for surface characteristics. More detailed information on topographic, soil, and hydrologic characteristics associated with thermokarst can be obtained at semiquantitative photo-trend plots (Fig. 5). This level of monitoring provides information on the nature, rates, and consequences of change, but sampling is usually insufficient to quantify the extent of change throughout a park. Nevertheless, photographs provide an excellent means of communicating the consequences of permafrost degradation to a broad audience. Photo-trend plots along a transect should have three stakes placed at 0, 10, and 20 m. The photograph should be taken with a moderate-resolution camera (~4 MP) at the 0-m stake, with the picture centered on the 10- and 20-m stakes. The top of the picture should include only a little bit of sky above the horizon; thus, most of the photograph is of the ground. The stakes should be painted with 20 cm graduations for scale. The photos should be labeled with park code, site, year, and photographer’s initials (e.g., DENA00012004mtj). Information collected at the time of the photo should include: Plot ID, date, time, observer, GPS coordinates (NAD83), thermokarst mode, geomorphic unit, macrotopography, microtopography, dominant plant species, thaw depth at each stake, and notes of pertinent observations.

Level 3. Soils and Ground Ice Stratigraphy and Remote Sensing
Stratigraphy. Two types of studies should be undertaken to better quantify the dynamics and distribution of ground ice and permafrost. First, detailed descriptions and sampling of soil and ice characteristics are useful for evaluating thermokarst potential before thermokarst occurs and the response of soils after thermokarst. Second, remote sensing techniques are useful to quantify the nature and extent of permafrost degradation within a park.
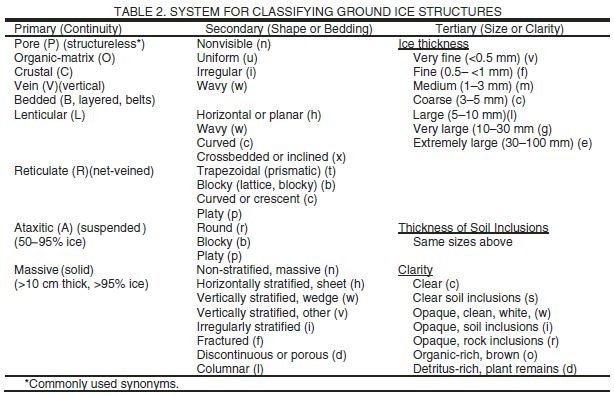
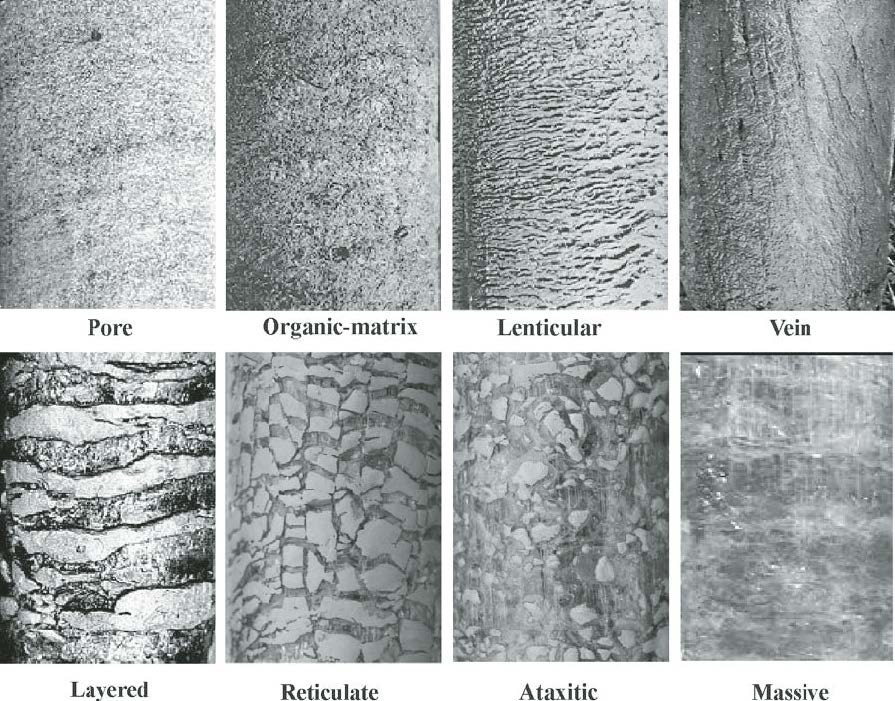
Soil and ice stratigraphy should be described at 4–7 locations representing differing terrain conditions (depending on the number of terrain types) along each survey transect. The stratigraphy of the near-surface soil (i.e., the active layer) should be described from soil pits or cores to assess the depth of thaw, surface organic thickness, and mineral characteristics. Below the active layer, 2–3-m-long frozen cores can be obtained using a 7.5-cm-diameter SIPRE corer with a portable power head. If bank exposures are present nearby, the profiles can be obtained after unfrozen material is removed with a shovel to expose undisturbed frozen sediments. The face of the exposure should be cleaned with a 6″ inshave draw knife, trowel, knife, or other suitable tool. After obtaining the cores or cleaning off the exposure, the soil material should be allowed to thaw for 5–20 minutes to allow the ice features to become more distinct; then, overall and detailed photographs should be taken. A tape measure or other scale should be included in the photos, as well as a site label, boldly written on a yellow “stickynote.” Descriptions for each profile should include the fine and coarse textures of each horizon, peat type, coarse-fragment percentage, boundary conditions, organic-matter depth, thaw depth, and visible ice volume and morphology. Soil texture should be classified according to the Soil Conservation Service system (SSDS, 1993). Ice morphology can be classified using the information provided in Table 2 and Figure 7 (adapted from Murton and French, 1994; Shur and Jorgenson, 1998).
The soil stratigraphy and ground ice descriptions should be done by a permafrost scientist. While a physical or soil scientist can be trained fairly quickly in sampling and description, interpretation of the data requires substantial experience. Data acquisition requires a scientist and one or two technicians for one day per site. Data compilation and analysis requires a scientist, one day per site. Fortunately, the soil sampling needs to be done only once when establishing baseline conditions and is not a routine monitoring requirement.
LIDAR can be used to collect detailed topography of an area and to provide high-resolution imagery for quantifying thaw settlement. LIDAR is best for detecting change over time by subtracting surface elevation over time. However, the cost is high, and analysis is intensive.
High-resolution satellite imagery (e.g., Quickbird, Ikonos) can be obtained for selected areas or entire parks. The images can be manually photo-interpreted to delineate thermokarst features, or a point-sampling system can be used to determine the presence or absence of permafrost features at systematically distributed grid points. The satellite imagery has the advantage over LIDAR in that vegetation patterns on the images are important for identifying thermokarst features, and the images can be used for other purposes, such as vegetation monitoring.
High-resolution aerial photography can be obtained with specialized, high-quality aerial cameras mounted in specialized aircraft or with a small fixed-wing aircraft equipped with a camera mount and a high-resolution (>6 MP) digital camera. Aerial photographs can be obtained at systematically distributed grid points or in dedicated blocks of terrain. The advantages of the aerial photographs and grid sampling approach are that costs are modest ($3,000 to $10,000) for small, fi xed-winged aircraft, resolution is high (pixel <1 m), thermokarst features can be reliably identified, and the probability of capturing the entire photo-set in one season is much higher.
Thermokarst features obtained from small fixed-wing aircraft are illustrated in Figure 8. Sampling of thermokarst features on the photography can be done at two scales. First, the presence or absence of thermokarst features can be photo-interpreted at the center point of each photo (or at multiple points if desired) and frequency of thermokarst features can be tallied to quantify the extent of thermokarst and the modes of permafrost degradation. Second, the presence or absence (or percent cover) of each type of thermokarst mode can be estimated for the entire photograph, or within a set radius around the center point. These data are useful to assess the amount of terrain that could be susceptible to thermokarst. Together, the point sampling provides a precise estimate of thermokarst extent, while the assessment of thermokarst within the larger area of each photograph provides an indication of how much terrain may be susceptible to thermokarst.
Remote sensing of thermokarst abundance and distribution can be done with personnel that have had one day of training. Acquisition of aerial photography requires an experienced fixed-wing pilot, a small plane with a belly mount for the camera, a high resolution digital camera, and a GPS. The photographs should be taken at predetermined locations along transects, with the coordinates uploaded into the GPS. The camera operator should take the pictures as the aircraft reaches the assigned locations. Ideally, the camera should be linked to the GPS to imbed the actual coordinates into the digital file information. Interpretation of the airphotos should be done by an expert, but an entry level scientist can also be trained to interpret airphotos using an airphoto key with illustrated examples. Management of photos and data acquired from a series of photos requires several days. Photo-interpretation of thermokarst features at a sampling point takes less than one hour per photo.

and (8) collapse-scar bogs on the Innoko Flats. These distinct features can readily be identified and mapped or point-smapled from high-resolution airphotso or satellite imagery. (1,2,3,7, and 8 by T. George; 4 by Aeromap; and 5 and 6 by T Jorgenson.)
There are a number of questions that should be addressed in developing a monitoring program for permafrost. While permafrost is common to most of the parks in Alaska, it exists only at high altitude in the contiguous states. Little is known about this high-altitude or mountain permafrost, although some inferences can be made (Péwé, 1983). This temperate latitude mountain permafrost is most likely found where annual mean air temperatures are ~0 °C or negative, snow cover thicknesses are relatively thin, and solar radiation input is low. This suggests high, windswept, north-facing slopes and ridges. An example is Niwot Ridge at an elevation of 3500 m in the Rocky Mountains west of Boulder, Colorado. This permafrost may be expected to be sporadic in distribution, warm (within a degree or two of thawing), and highly susceptible to climatic warming. The questions that a resource manager needs to address are discussed below.
Questions and Priorities
1. Is permafrost present, and is there any evidence (thermokarst terrain, landslides, rock falls) that it has thawed in the past?
The probing method (discussed in this chapter) when coupled with an occasional temperature measurement or an excavated pit provides the necessary information to determine whether permafrost is present. Field work for probing helps discover if there is any thermokarst terrain (including landslides, rock falls) that would indicate that ice-rich permafrost has thawed in the recent past. This information also provides a qualitative indication of the potential for change associated with climatic warming.
2. What is the current thermal state of the permafrost, and what is the current extent of the thawing?
Permafrost surface temperature measurements (discussed in this chapter) provide a partial answer to this question. However, much more detail is provided by borehole temperature measurements even if the hole is shallow (10–20 m). This information, when coupled with the current extent of thermokarst, provides a quantitative assessment of the changes associated with climatic warming since the late 1800s.
3. What is the projected future thermal state of the permafrost, and what are the rates and characteristics of change associated with thermokarst terrain?
Relatively shallow borehole temperature measurements can be used to calibrate thermal models. The calibrated thermal models can then be used to predict the response of the permafrost to climate scenarios such as those generated by global climate models. If there are a number of sites where temperature measurements are being made, and where information on soil ice contents and the rates and characteristics of change in thermokarst terrain are known, then it is possible to determine when and where potential thawing in park ecosystems may occur.
For management of park resources, an important goal of a permafrost monitoring program should be to develop a predictive capability for determining the effects and impacts of climate change on the permafrost. With the information generated by answers to the above questions, thermal models of ground temperature distribution within each type of ecosystem can be developed for the park. The thermal and thermokarst measurements would be used to calibrate the model for each type of ecosystem. The model can then be used to map the spatial distribution of permafrost and its temperatures throughout the park ecosystems and thereby identify those areas of warm permafrost that are most vulnerable to change. Advanced knowledge of areas susceptible to thermokarst can be used to develop management strategies to avoid resource use conflicts.
A comprehensive yet practical sampling design for monitoring permafrost within a park should include: (1) compilation of existing soils and permafrost survey information when available, or a reconnaissance-level survey and satellite image interpretation to assess permafrost occurrence when detailed information is not available; (2) two boreholes at easily accessible lowland and mountain sites; (3) 5–10 survey transects distributed within riverine, lowland, and mountain ecosubsections (physiographic landscapes); and (4) photo-interpretation of the presence and type of thermokarst at 200–300 points on a large-scale grid, using high-resolution satellite imagery or inexpensive aerial photography obtained with a small aircraft. The reconnaissance surveys would use satellite image interpretation, subsection or soil landscape maps, and limited ground-truthing by probing to identify permafrost areas. Within the permafrost area, boreholes should be placed in both a lowland and a mountain environment to capture the elevational temperature gradient and should be monitored yearly. Survey transects should be established to monitor surface and groundwater elevations, thaw depths, and temperatures at the ground and permafrost surfaces. Temperatures at 5 and 100 cm depths in the ground in two to four ecosystem types along the transect should be measured with inexpensive dataloggers. The transects should be monitored every two to three years. Finally, remote sensing of the extent and type of thermokarst by point sampling of high-resolution imagery should be done every 10 years.
CASE STUDIES
Permafrost is highly variable, both spatially and temporally, so no one site can represent a wide range of permafrost characteristics. We will present examples of results obtained using the methods described above and using data from different sites to provide a more complete illustration of the range of permafrost conditions.
Surface Temperatures
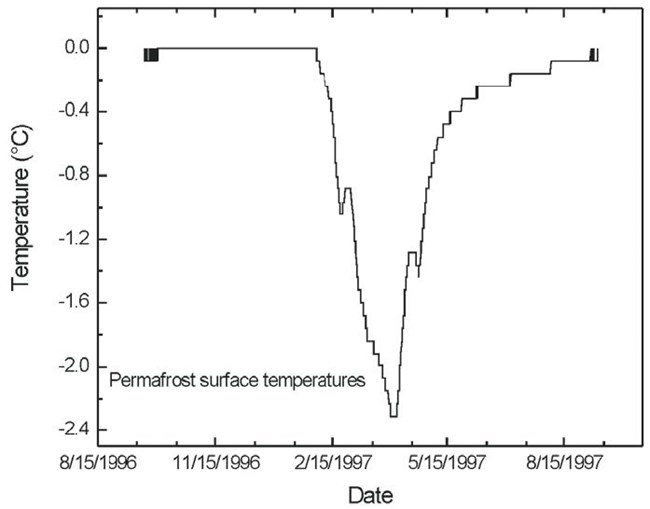
Temperature monitoring at a site near Denali National Park shows that permafrost is present at this site since all temperatures are at or below 0 °C (Fig. 9). There was a period extending through the fall and half-way through winter where temperatures remained at 0 °C. This was the time when the active layer was freezing from the top down. Temperatures at the freezing surface in the active layer and at the top of the permafrost were at 0 °C, so that the intervening unfrozen layer was constrained at 0 °C. This caused the permafrost to “disconnect” from the atmosphere (i.e., the atmosphere could not infl uence permafrost temperatures). Freezing proceeded from the ground surface downwards and the heat of fusion at the freezing interface in the active layer was conducted upwards through the active layer. Freezing also occurred at the permafrost surface, producing a frozen layer that
thickened upwards with the heat of fusion conducted downwards into the permafrost. With complete freezing of the unfrozen layer on 2 February 1997, the permafrost was again connected to the atmosphere and cooled rapidly.
Permafrost surface temperatures continued cooling until the beginning of April when warming began in response to warming air temperatures. Temperatures warmed rapidly during spring and then continued warming slowly through summer until they reached 0 °C about mid-September. At this time, the active layer reached its maximum thickness, air temperatures were cooling and the process was ready to repeat.
The annual mean temperature calculated from the data is −0.4 °C, which is very close to thawing. When a multi-year data set is available, trends in the permafrost surface temperature can be determined. If air and ground surface temperatures and snow cover thicknesses are measured, then a more complete interpretation of permafrost conditions, trends, and reasons for change can be conducted.
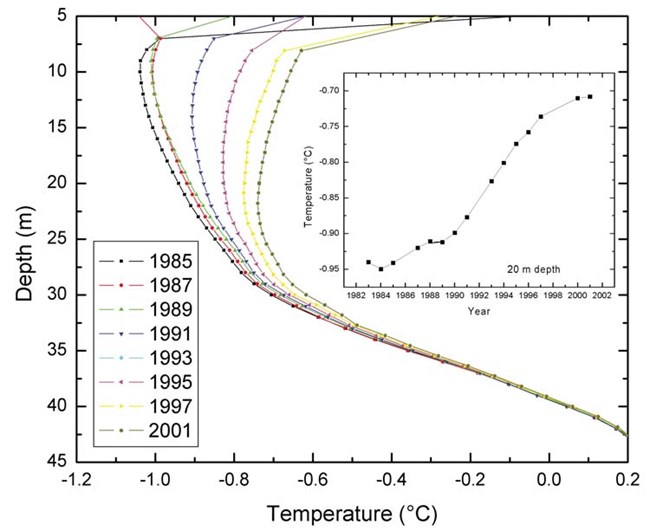
While detailed interpretation of the data requires an expert, some information can be obtained by anyone with scientific training. Figure 10 shows a temperature profile from a site in Interior Alaska. Permafrost here is warm, with a mean surface temperature near −1 °C, estimated by projecting the 10–20 m temperatures in a straight line upward to the permafrost surface. Permafrost depth is ~39.4 m, and there is a slight break in the slope of the profile that may indicate a freezing point depression of about −0.16 °C at the base of ice-bearing permafrost. The strong change in slope at 29 m is caused by a change in lithology from sand to clay, as verified from drilling records. The gradual change below 40 m is caused by a change from sand with gravel grading into claystone. Active-layer depth next to the pipe is over a meter. Curvature in the top 22 m in fine-grained soils indicates that a recent surface warming has occurred. Heat flow could be calculated from the linear portion of the profile below 30 m, but this profile is not an equilibrium one and the heat flow would not be representative.
If a time series of temperature profiles are available, these can be used to show how permafrost temperatures are changing (Fig. 10). This hole was drilled in 1983 and permafrost temperatures have warmed consistently since 1985, with the rate of warming increasing significantly after 1995.
Survey Transects for Surface Characteristics and Thaw Settlement
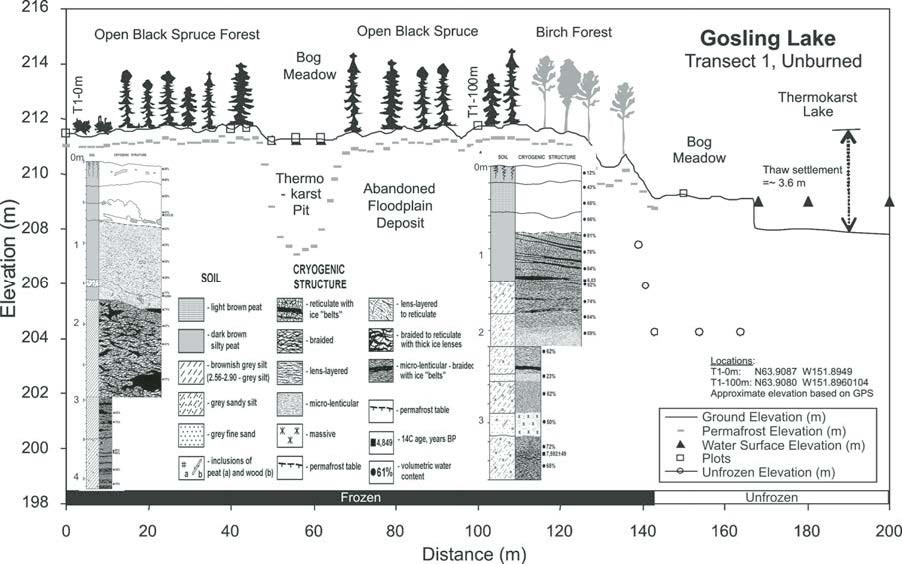
A monitoring transect established near Gosling Lake in northwest Denali National Park (Fig. 6) shows that it has ice-rich, abandoned floodplain deposits that are undergoing widespread thermokarst, resulting in extensive development of thermokarst lakes and bogs. The initial surveys of ground and water surface elevations have established the baseline conditions for thawing along the edge of the thermokarst lake and for the beginning stages of a bog. A floating shore bog surrounds the margin of the lake, and the surface stays slightly above the level of the lake water. Water in the bog, however, is confined by the permafrost and remains isolated from groundwater conditions. Active-layer depths above the permafrost mostly vary between 40 and 60 cm along stable portions of the transect, but probing in the bog indicates that permafrost has thawed up to 4 m below the surface, and a talik (perennially thawed zone) has developed above the permafrost. As a result of thawing, the ground surface is now 0.5 m below the original ground surface elevation, although a floating mat of Sphagnum mosses covers the bog and masks the original ground surface. Permafrost is absent at the margin of the thermokarst lake. Probing revealed the presence of a thaw bulb underneath the adjacent shoreline. Also of interest is the shallow depression 40 m back from the lake edge, formed as a result of the thin-surface permafrost layer above the thaw bulb that has cracked and settled above the thawing subsurface material. A repeat survey of the transect in 5–10 years will provide data for quantifying the rate of subsurface thawing and lateral expansion of the thaw lake and bog.
Soils and Ground Ice Stratigraphy
Information on the stratigraphy of soils and ground ice can greatly aid in the interpretation of the dynamics of permafrost degradation. On the Tanana Flats, where the surface topography, groundwater, and thaw depths have been monitored since 1994 (Jorgenson et al. 2001a), subsurface conditions were sampled through coring and deep probing (Fig. 11). The stratigraphy included thick organic horizons at the surface, a moderately thick silt layer, cross-bedded fine sands, and finally gravel at about the 4 m depth. The bottom of the organic layer had a calibrated radiocarbon age of 7.7–8.8 ka B.P. (thousands of years before present). This indicates that the area was initially covered by glacial outwash from the Alaska Range during deglaciation in the early Holocene. The area was then blanketed by eolian silt and eventually covered by organic material around 3.0–5.2 ka BP. This stratigraphy is important because the gravel provides a porous material for movement of water to a downward freezing front during permafrost aggradation, and the silt texture is highly susceptible to formation of segregated ice and frost heaving.
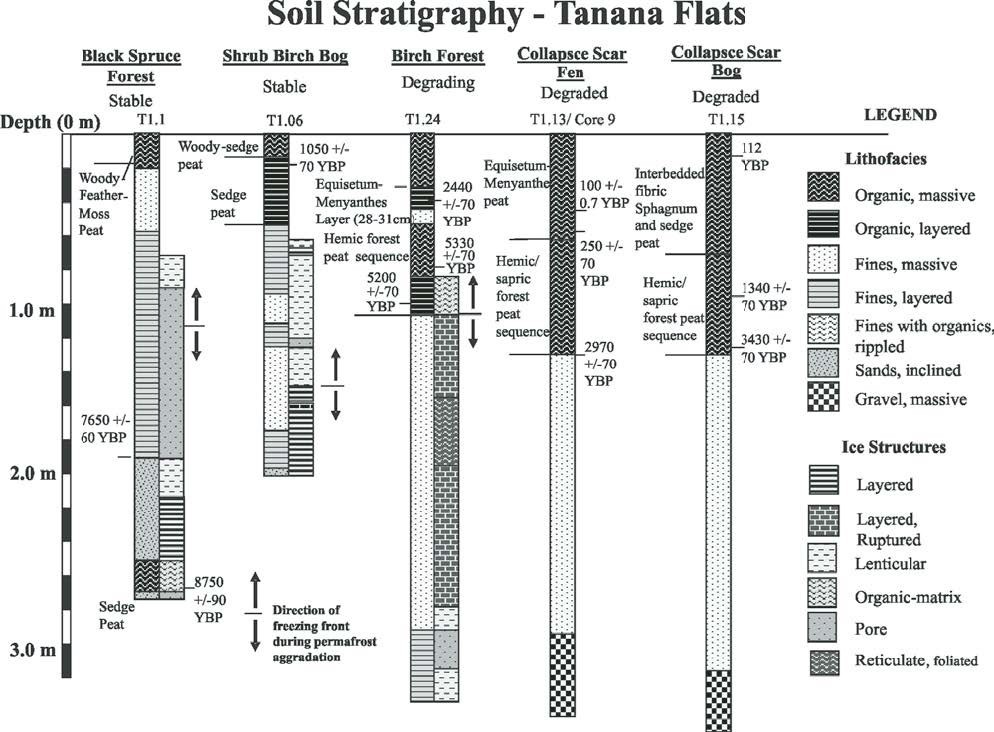
Pore and lenticular ice is associated with alluvial layered very fine sand and crossbedded sand, and layered and ruptured layered ice is associated with a massive eolian silt deposit.
Remote Sensing
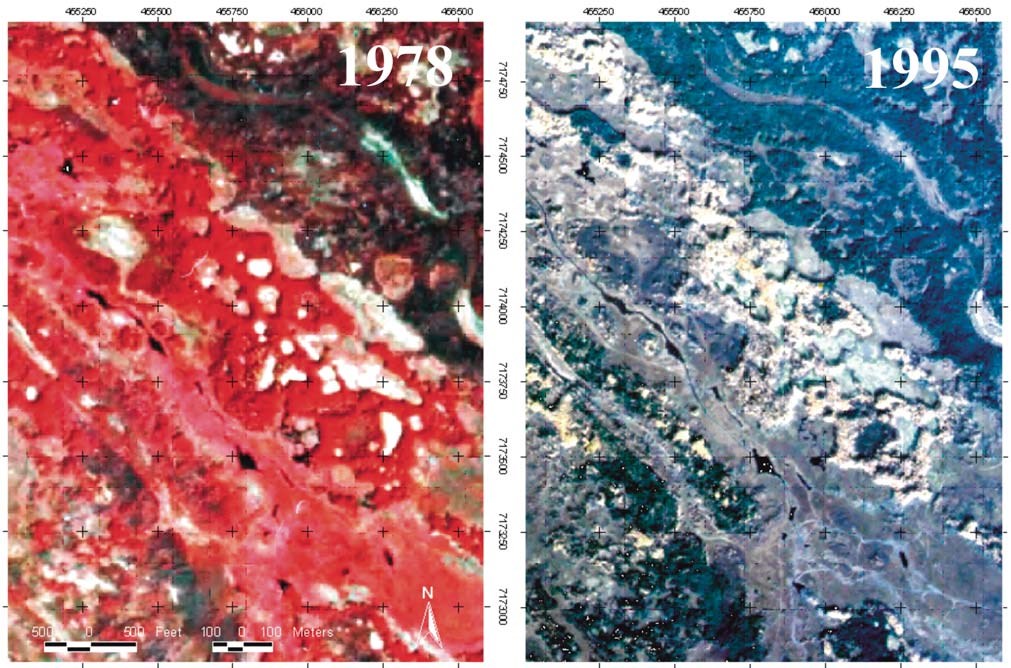
Time-series analyses of high-resolution, historical aerial photography were used to assess long-term rates of permafrost degradation on the Tanana Flats in central Alaska (Jorgenson et al., 2001a) and on the coastal plain in northern Alaska (Jorgenson et al., 2006). Both polygon mapping and point-sampling methods were used to quantify the rate of permafrost degradation. The more intensive boundary delineation provides information on the change in areal extent of permafrost, rates of lateral change along the permafrost boundaries, and visual features for interpreting degradation patterns and ecological relationships. The point-sampling method provides a rapid means for quantifying the changes in permafrost extent and allows analyses of successional relationships by comparing changes in ecosystem types at each point (Fig. 12). For this area of the Tanana Flats, the percent of the area where permafrost has totally degraded has increased from 39% in 1949 to 47% in 1995. The point-sampling approach has also been used in a statewide effort to quantify the extent of thermokarst featuresa cross the discontinuous and continuous zones of northern Alaska (Jorgenson et al., 2005, 2008).
Global air temperatures have warmed since the late 1800s, and this warming has been pronounced during the last quarter century. There has been a concurrent warming of permafrost. Much of the discontinuous permafrost in Alaska is within a degree or two of thawing, as is the temperate-latitude mountain permafrost of the contiguous states. Global climate models predict continued warming of several degrees during the next century. If this occurs, then much of the discontinuous and mountain permafrost is expected to thaw. Widespread thawing of permafrost is already occurring in some areas. Where the permafrost is ice-rich, thawing produces thermokarst terrain consisting of channels, pits, troughs, potholes, ponds, lakes, “drunken forests” (trees leaning in random directions), landslides, and rock falls. Thawing of ice-rich permafrost with the creation of thermokarst terrain is one of the primary problems facing northern and alpine ecosystems as a result of climatic warming.
Thermokarst drastically modifies ecosystems, human activities, infrastructure, and the fluxes of energy, moisture, and gases across the ground surface-air interface. Vascular and nonvascular plant composition and distribution, plant community productivity, soil chemistry, biological activity, and nutrient supply for plant use can be substantially altered by this geological phenomenon. Drainage conditions determine whether standing water will be present or not. The affected trees usually die, and vegetation changes significantly. These changes in the flora have a direct impact on the fauna. In lowlands or relatively flat areas, a shift from boreal forests to lakes, shrubby wetlands or grasslands often occurs with concurrent changes in bird and animal populations. The new ecosystems usually favor aquatic birds and mammals. Thus, the result of thawing ice-rich permafrost is not just a slight shift in the nature of the ecosystem but rather partial or total destruction of the ecosystem, and its replacement by a new ecosystem.
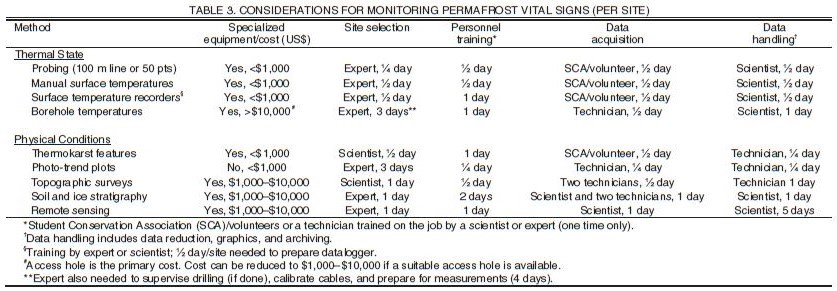
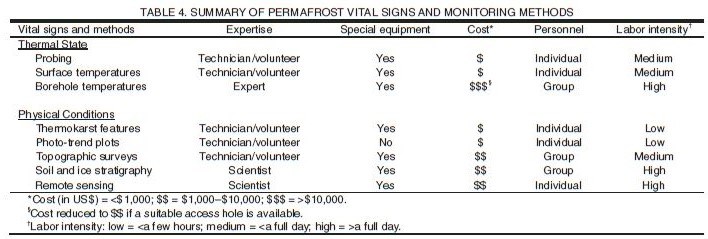
The combination of the above observations and conditions and the predicted climate warming of the twenty-first century are cause for concern about the future condition of permafrost in national parks and preserves in Alaska and in the mountains of the contiguous western states. Given the sensitivity of ecosystems to permafrost degradation, a well-designed program is needed to monitor the thermal and physical state of permafrost within national parks. The monitoring should assess past changes, determine the current status, and monitor future changes. The thermal aspect of this monitoring effort can be done at three levels of effort, depending on personnel and funding: (1) probing to assess the presence and distribution of permafrost with inexpensive equipment;( 2) measuring permafrost surface temperatures with inexpensive data recorders; and (3) measuring vertical temperature profiles in boreholes. For physical monitoring, the three levels of effort should include: (1) reconnaissance-level observations or photo-trend plots to track occurrence of permafrost degradation; (2) detailed measurements of the relative elevations of the ground surface, permafrost table, and water levels across representative transects; and (3) remote sensing of the nature and extent of the various modes of permafrost degradation. Information (manpower, equipment, costs, etc.) for accomplishing these tasks are summarized in Tables 3 and 4.
We thank Yuri Shur and Michael Kanevskiy for discussions on describing permafrost cryostructures. Support for evaluating field and remote sensing techniques was provided by Guy Adema, National Park Service, Alaska. This material is partially based upon work supported by the National Science Foundation under grant nos. ARC-0454939 and ARC-0454985. Any opinions, findings, and conclusions or recommendations expressed in this material are those of the authors and do not necessarily reflect the views of the National Science Foundation.
REFERENCES CITED
Anisimov, O.A., and Nelson, F.E., 1996, Permafrost distribution in the northern hemisphere under scenarios of climatic change: Global and Planetary Change, v. 14, p. 59–72, doi:10.1016/0921-8181(96)00002-1.
Brown, J., ed., 1985, Workshop on permafrost geophysics: Hanover, New Hampshire, U.S. Army Cold Regions Research and Engineering Laboratory, Special Report 85-5.
Brown, J., Ferrians, O.J., Heginbottom, J.A., Jr., and Melnikov, E.S., 1997, Circum-Arctic map of permafrost and ground ice conditions: U.S. Geological Survey Map CP-45.
Brown, R.J.E., and Péwé, T.L., 1973, Distribution of permafrost in North America and its relation to the environment, a review, 1963–1973, in Permafrost: the North American contribution to the Second International
Conference on Permafrost, Yakutsk, USSR: Washington, D.C., National Academy of Sciences, p. 71–100.
Camill, P., 1999, Patterns of boreal permafrost peatland vegetation across environmental gradients sensitive to climate warming: Canadian Journal of Botany, v. 77, p. 721–733, doi: 10.1139/cjb-77-5-721.
Clark, M.H., and Duffy, M.S., 2003, Soil Survey of Denali National Park Area, Alaska: Palmer, Alaska, Natural Resource Conservation Service, 822 p.
Clow, G.D., Saltus, R.W., and Waddington, E.D., 1996, A new high-precision borehole temperature logging system used at GISP2, Greenland and Taylor Dome, Antarctica: Journal of Glaciology, v. 42, p. 576–584.
Crampton, C.B., and Rutter, N.W., 1973, A geoecological terrain analysis of discontinuously frozen ground in the upper MacKenzie River Valley, Canada in Permafrost: The North American Contribution to the Second International Conference, Yakutsk, USSR: Washington, D.C., National Academy of Sciences, p. 101–105.
Esch, D.C., 1982, Portable powered probe for permafrost: Fairbanks, Alaska, Alaska Department of Transportation and Public Facilities, Report FHWA-AK-RD-83-12, 13 p.
Ferrians, O.J., and Hobson, G.D., 1973, Mapping and predicting permafrost in North America: A review, 1963–1973, in Permafrost: The North American Contribution to the Second International Conference, Yakutsk, Siberia, USSR: Washington, D.C., National Academy of Sciences, p. 479–498.
Frost, R.E., McLerran, J.H., and Leighty, R.D., 1973, Photointerpretation in the arctic and sub-arctic, in Proceedings Second International Permafrost Conference: Washington, D.C., National Academy of Sciences, National Research Council Publication No. 1287, p. 343–348.
Hansen, J., and Lebedev, S., 1987, Global trends of measured surface air temperatures: Journal of Geophysical Research, v. 92, D11, p. 13,345–13,372, doi:10.1029/JD092iD11p13345.
Huscroft, C.A., Lipovsky, P.S., and Bond, J.D., 2004, A regional characterization of landslides in the Alaska Highway corridor, Yukon: Yukon Geological Survey Open-File Report 2004-18.
Jorgenson, M.T., 2001, Landscape-level mapping of ecological units for the Bering Land Bridge National Preserve. Final Report for National Park Service: Fairbanks, Alaska, ABR, Inc., 45 p.
Jorgenson, M.T., and Kreig, R.A., 1988, A model for mapping permafrost distribution based on landscape component maps and climatic variables, in Proceedings of Fifth International Conference on Permafrost: Trondheim, Norway, TAPIR Publishers, p. 176–183.
Jorgenson, M.T., and Osterkamp, T.E., 2005, Response of boreal ecosystems to varying modes of permafrost degradation: Journal Canadian Forest Research, v. 35, p. 2100–2111, doi: 10.1139/x05-153.
Jorgenson, M.T., Roth, J.E., Raynolds, M., Smith, M.D., Lentz, W., Zusi-Cobb, A., and Racine, C.H., 1999, An ecological land survey for Fort Wainwright, Alaska: Hanover, New Hampshire, U.S. Army Cold Regions Research and Engineering Laboratory Report 99-9, 83 p.
Jorgenson, M.T., Racine, C.H., Walters, J.C., and Osterkamp, T.E., 2001a, Permafrost degradation and ecological changes associated with a warming climate in central Alaska: Climatic Change, v. 48, p. 551–579, doi: 10. 1023/A:1005667424292.
Jorgenson, M.T., Roth, J.E., Smith, M.D., Schlentner, S., Lentz, W., and Pullman, E.R., 2001b, An ecological land survey for Fort Greely, Alaska: Hanover, New Hampshire, U.S. Army Cold Regions Research and Engineering Laboratory Report ERDC/CRREL TR-01–04, 85 p.
Jorgenson, M.T., Roth, J.E., Schlentner, S.F., and Cater, T.C., 2003, Ecological land evaluation for the Yukon Training Area on Fort Wainwright: permafrost and disturbance, Final Report for U.S. Army Cold Regions Research and Engineering Laboratory: Fairbanks, Alaska, ABR, 55 p.
Jorgenson, M.T., Roth, J.E., Emers, M., Davis, W., Schlentner, S.F., and Macander, M.J., 2004, Landcover mapping for Bering Land Bridge National Preserve and Cape Krusenstern National Monument, Northwestern Alaska, Final Report for National Park Service: Fairbanks, Alaska, ABR, 129 p.
Jorgenson, M.T., Shur, Y., Osterkamp, T.E. and George, T., 2005, Nature and extent of permafrost degradation in the discontinuous zone in Alaska (abstract): Eos (Transactions, American Geophysical Union) Fall Supplement, v. 86, no. 52.
Jorgenson, M.T., Pullman, E.R., and Shur, Y., 2006, Abrupt increase in permafrost degradation in Arctic Alaska: Geophysical Research Letters, v. 33, p. L02503, doi: 10.1029/2005GL024960.
Jorgenson, M.T., Shur, Y., and Osterkamp, T.E., 2008, Thermokarst in Alaska, in Kane, D.L. and Hinkel, K.M., eds., Proceedings of the 9th International Conference on Permafrost: Fairbanks, Alaska, INE, University of Alaska, p. 869–876.
Karle, K.F., and Jorgenson, M.T., 2004, Review of existing permafrost monitoring projects, with application and recommendations for the central Alaska network ecological monitoring program, Final Report for National Park Service: Healy, Alaska, Hydraulic Mapping and Modeling, 49 p.
Kreig, R.A., and Reger, R.D., 1982, Air-photo analysis and summary of landform soil properties along the route of the Trans-Alaska Pipeline System: Alaska Division of Geological and Geophysical Surveys Geologic Report 66, 149 p.
Maxwell, B., 1992, Arctic climate: potential for change under global warming, in Chapin, F.S., III, Jeffries, R.L., Reynolds, J.F., Shaver, G.R., and Svoboda, J., eds., Arctic Ecosystems in a Changing Climate: San Diego, Academic Press, p. 11–34.
McBeath, J.H., ed., 1984, Conference proceedings: Potential effects of carbon dioxide-induced climatic changes in Alaska: Fairbanks, Alaska, University of Alaska Miscellaneous Publication 83-1.
Murton, J.B., and French, H.M., 1994, Cryostructures in permafrost, Tuktoyaktuk coastlands, western arctic Canada: Canadian Journal of Earth Sciences, v. 31, p. 737–747.
National Soil Service Center (NSSC), 2002, Field Book for Describing and Sampling Soils: Lincoln, Nebraska, Natural Resources Conservation Service, Ver. 2.
Natural Resource Conservation Service (NRCS), 2003, Keys to Soil Taxonomy, Ninth Edition: Washington, D.C., U.S. Department of Agriculture, 332 p.
Nelson, F.E., 1986, Permafrost distribution in central Canada: applications of a climate-based predictive model: Annals of the Association of American Geographers, v. 76, p. 550–569, doi: 10.1111/j.1467-8306.1986. tb00136.x.
Nelson, F.E., Lachenbruch, A.H., Woo, M.K., Koster, E.A., Osterkamp, T.E., Gavrilova, M.K., and Chang, G.O., 1994, Permafrost and changing climate, in Permafrost: Sixth International Conference Proceedings: Wushan, Guangzhou, PRC, South China University of Technology Press, v 2, p. 987–1005.
Osterkamp, T.E., 1983, Response of Alaskan permafrost to climate, in Proceedings of Fourth International Conference on Permafrost: Washington D.C., National Academy of Sciences, p. 145–152.
Osterkamp, T.E., 1985, Temperature measurements in permafrost: Fairbanks, Alaska, Alaska Department of Transportation and Public Facilities Report FHWA-AK-RD-85-11, 87 p.
Osterkamp, T.E., 1994, Evidence for warming and thawing of discontinuous permafrost in Alaska: Eos (Transactions, American Geophysical Union), v. 75, no. 44, p. 85.
Osterkamp, T.E., 1995, Further evidence for warming and thawing of permafrost in Alaska: Eos (Transactions, American Geophysical Union), v. 76, no. 46, p. F244.
Osterkamp, T.E., 2003a, A thermal history of permafrost in Alaska, in Phillips, M., Springman, S.M., and Arenson, L.U., eds., Proceedings of the 8th International Conference on Permafrost: Lisse, The Netherlands, A.A. Balkema, v. 2, p. 863–868.
Osterkamp, T.E., 2003b, Establishing long-term permafrost observatories for active layer and permafrost investigations in Alaska: 1977–2002: Permafrost and Periglacial Processes, v. 14, p. 331–342, doi: 10.1002/ppp.464.
Osterkamp, T.E., 2005, The recent warming of permafrost in Alaska: Global and Planetary Change, v. 49, p. 187–202, doi: 10.1016/j.gloplacha.2005. 09.001.
Osterkamp, T.E., 2007, Characteristics of the recent warming of permafrost in Alaska: Journal of Geophysical Research, Earth Surface, v. 112, p. F02S02, doi:10.1029/2006JF000578.
Osterkamp, T.E., 2008, Thermal state of permafrost in Alaska during the fourth quarter of the twentieth century, in Kane, D.L. and Hinkel, K.M., eds., Proceedings of the 9th International Conference on Permafrost: Fairbanks, Alaska, INE, University of Alaska, v. 2, p. 1333–1338.
Osterkamp, T.E., and Burn, C.R., 2002, Permafrost, in Holton, J.R., Pyle, J., and Curry, J.A., eds., Encyclopedia of Atmospheric Sciences: New York, Academic Press, p. 1717–1729.
Osterkamp, T.E., and Gosink, J.P., 1991, Variations in permafrost thickness in response to changes in paleoclimate: Journal of Geophysical Research, v. 96, B3, p. 4423–4434, doi: 10.1029/90JB02492.
Osterkamp, T.E., and Harrison, W.D., 1982, Temperature measurements in subsea permafrost off the coast of Alaska, in French, H.M., ed., Proceedings of the Fourth Canadian Permafrost Conference, Calgary, Alberta, 2–6 March 1981: Ottawa, Canada, National Research Council, p. 238–248.
Osterkamp, T.E., and Romanovsky, V.E., 1999, Evidence for warming and thawing of discontinuous permafrost in Alaska: Permafrost and Periglacial Processes, v. 10, p. 17–37, doi: 10.1002/(SICI)1099-1530(199901/03) 10:1<17::AID-PPP303>3.0.CO;2-4.
Osterkamp, T.E., Esch, D.C., and Romanovsky, V.E., 1998, Permafrost, in Implications of Global Change in Alaska and the Bering Sea Regions, Proceedings of a Workshop, Fairbanks, Alaska, 1997: Fairbanks, Alaska, University of Alaska, Center for Global Change, p. 115–127.
Osterkamp, T.E., Viereck, L., Shur, Y., Jorgenson, M.T., Racine, C.H., Doyle, A.P., and Boone, R.D., 2000, Observations of thermokarst in boreal forests in Alaska: Arctic, Antarctic, and Alpine Research, v. 32, p. 303–315, doi: 10.2307/1552529.
Panel on Climate Change and Geothermal Regime (PCCGR), 1983, Proceedings of Fourth International Conference on Permafrost: Washington D.C., National Academy of Sciences, p. 137–160.
Péwé, T.L., 1975, Quaternary geology of Alaska: Washington, D.C., U.S. Geological Survey Professional Paper 835, 145 p.
Péwé, T.L., 1983, Alpine permafrost in the contiguous United States: A review: Arctic and Alpine Research, v. 15, p. 145–156, doi: 10.2307/1550917.
Phillips, M., Springman, S.M., and Arenson, L.U., eds., 2003, Proceedings of the Eighth International Conference on Permafrost, 21–25 July, Zurich, Switzerland: Lisse, The Netherlands, A.A. Balkema, v. 1 and 2, 1319 p.
Shur, Y., and Jorgenson, M.T., 1998, Cryostructure development on the floodplain of the Colville River Delta, northern Alaska, in Proceedings of the Seventh International Permafrost Conference, Université Laval, Sainte-Foy, Quebec, Collection Nordicana, no. 57., p. 993–1000.
Soil Survey Division Staff (SSDS), 1993, Soil Survey Manual: Washington, D.C., U.S. Department of Agriculture Handbook No. 18437, 437 p.
Stoeckler, E.G., 1949, Identifi cation and evaluation of Alaskan vegetation from airphotos with reference to soil, moisture, and permafrost conditions: St. Paul, Minnesota, St. Paul District, U.S. Army Corps of Engineers.
Swanson, D.K., 2000, Landscape ecosystems of the Kobuk Preserve Unit, Gates of the Arctic National Park, Alaska: Anchorage, Alaska, National Park Service Technical Report NPS/ARRNR/NRTR-95/22, 291 p.
Swanson, D.K., 2001a, Ecological units of Kobuk Valley National Park, Alaska: Fairbanks, Alaska, National Park Service.
Swanson, D.K., 2001b, Ecological units of Wrangell–St. Elias National Park and Preserve, Alaska: Fairbanks, Alaska, National Park Service.
Thie, J., 1974, Distribution and thawing of permafrost in the southern part of the discontinuous zone in Manitoba: Arctic, v. 27, p. 189–200.
Washburn, A.L., 1973, Periglacial Processes and Environments: London, Edward Arnold, 320p.
Weller, G.A., Lynch, A., Osterkamp, T.E., and Wendler, G., 1995, Climate change and its effects on the physical environment of Alaska, in Proceedings of the 46th Science Conference of the Arctic Division, American Association for the Advancement of Science, September, Fairbanks, Alaska: University of Alaska, p. 5–13.
Wright, J.F., Smith, M.W., and Taylor, A.E., 2000, Potential changes in permafrost distribution in the Fort Simpson and Norman Wells Areas, in Dyke, L.D., and Brooks, G.R., eds., The physical environment of the Mackenzie Valley: a baseline for the assessment of environmental change: Geological Survey of Canada Bulletin 547, Chapter 20.
Zhang, T., Osterkamp, T.E., and Stamnes, K., 1996, Infl uence of the depth hoar layer of the seasonal snow cover on the ground thermal regime: Water Resources Research, v. 32, p. 2075–2086, doi: 10.1029/96WR00996.
Zoltai, S.C., and Pettapiece, W.W., 1973, Terrain, vegetation, and permafrost relationships in the northern part of the Mackenzie River valley and northern Yukon: Ottawa, Canada, Environmental-Social Committee Northern Pipelines, Task Force on Northern Oil Development, Report 73-4, 105 p.
