Last updated: March 21, 2021
Article
Mine tailings reclamation project improves water quality in Yellowstone’s Soda Butte Creek
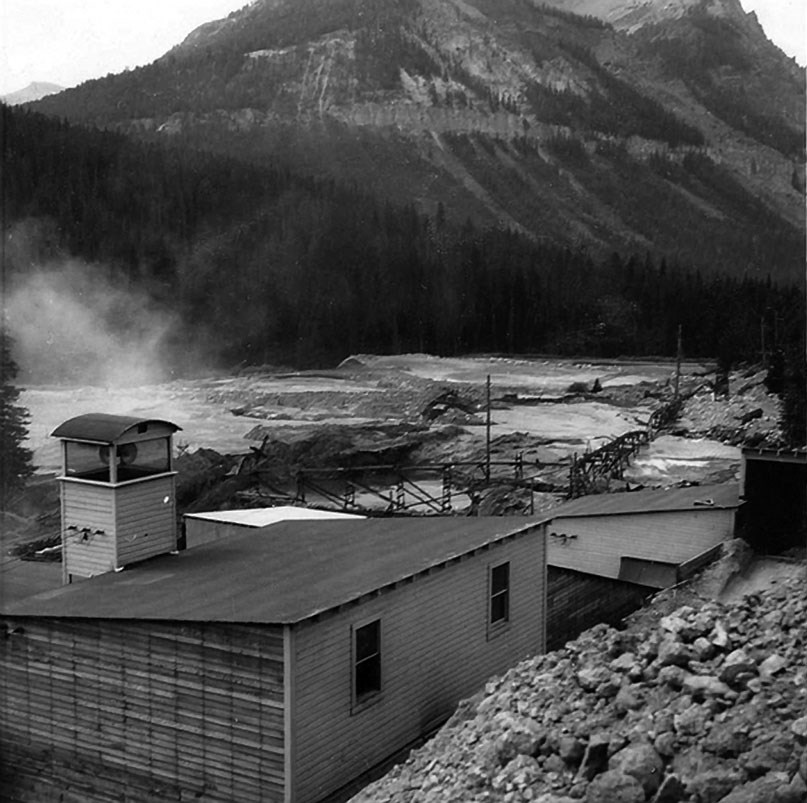
Photo courtesy of Cooke City Montana Museum
Mining-related disturbances are the primary source of increased metals loading above natural background conditions in the Soda Butte Creek drainage straddling the northeastern boundary of Yellowstone National Park (Boughton 2001). Tailings on the McLaren Mill and Tailings site (hereafter McLaren site), bordering Soda Butte Creek near the town of Cooke City, Montana, were the most significant of these anthropogenic sources (Boughton 2001; MTDEQ 2002b). The segment of Soda Butte Creek downstream to the Montana-Wyoming border is an impaired water body identified under Section 303(d) of the Clean Water Act and is the only Clean Water Act–impaired water body entering Yellowstone National Park (O’Ney et al. 2011). In 2014, the Montana Department of Environmental Quality (DEQ) completed the McLaren Tailings Reclamation Project, culminating five years of environmental construction work. (See “Reclamation work at McLaren Mill and Tailings” for more of the reclamation story.) In collaboration with the National Park Service’s (NPS) Natural Resource Stewardship and Science Directorate Water Resources Division, this work was performed to remove the potentially unstable tailings impoundment, mitigate the metal loading to improve water quality, and enhance the ecological health of Soda Butte Creek. The reclamation project was preceded by 80 years of environmental impacts from the milling operation and discharges from the tailings impoundment (fig. 1). In 2015, NPS and Montana DEQ scientists initiated longitudinal studies of water quality in Soda Butte Creek to document water quality downstream of the reclaimed tailings site and during the initial phase of recovery.
Setting and hydrology
Soda Butte Creek is an active, unregulated cobble- and gravel-dominated stream located in the Absaroka and Beartooth Mountains of Montana and Wyoming. It flows from the high mountains situated east of Yellowstone National Park west to meet the Lamar River; the creek enters the park at its northeast entrance (fig. 2). Within the watershed of Soda Butte Creek exist the small gateway communities of Cooke City and Silver Gate, Montana. Today, this region offers seasonal lodging and services to visitors of Yellowstone National Park. Outdoor enthusiasts and residents enjoy the mountainous setting year-round.
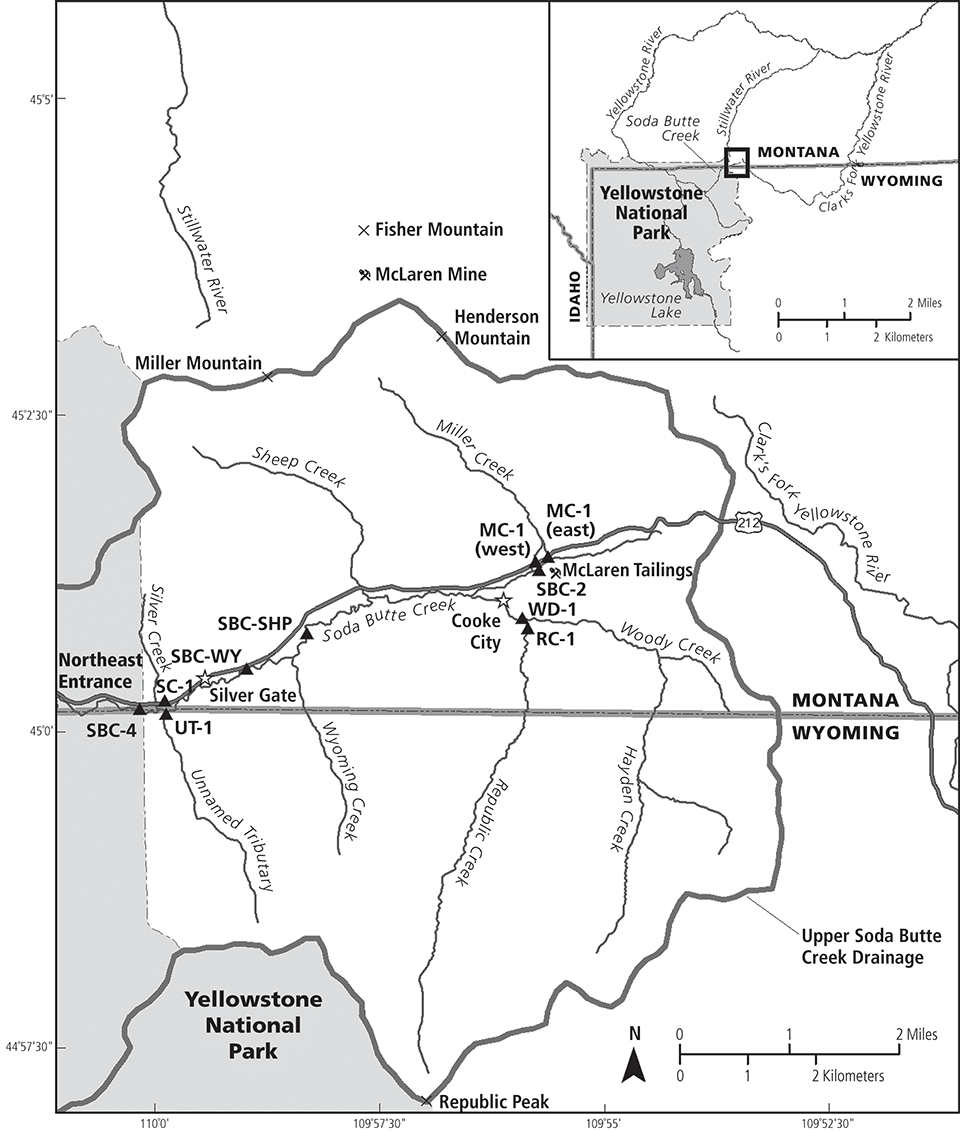
Figure 2. The map depicts the upper Soda Butte Creek watershed including tributary streams. Cooke City and Silver Gate are indicated by open stars, water quality sampling locations by black triangles. Sampling locations include MC-1 east and MC-1 west (the two forks of Miller Creek above the Soda Butte Creek confluence), SBC-2 (Soda Butte Creek below McLaren site), WD-1 (Woody Creek above Republic Creek confluence), RC-1 (Republic Creek above Woody Creek confluence), SBC-SHP (Soda Butte Creek below Sheep Creek), SBC-WY (Soda Butte Creek below Wyoming Creek), UT-1 (an unnamed tributary near the Yellowstone park boundary), SC-1 (Silver Creek), and SBC-4 (Soda Butte Creek at the Yellowstone National Park boundary).
More than 150 years ago (and before the establishment of Yellowstone National Park in 1872) trappers and prospectors discovered gold, copper, and silver deposits in this region. At the time, the area was part of the Crow Reservation but reservation boundaries were redrawn in 1882 to the east, in part to support access to the region that later became part of the New World Mining District (Glidden 1982). Some of the place-names surrounding Cooke City and within the Soda Butte Creek watershed still bear the names given by early prospectors (e.g., Mineral Mountain and Silver Creek; fig. 2) and draw attention to the deposits that attracted miners to the region. (See “Mining history of the region” for more information.)
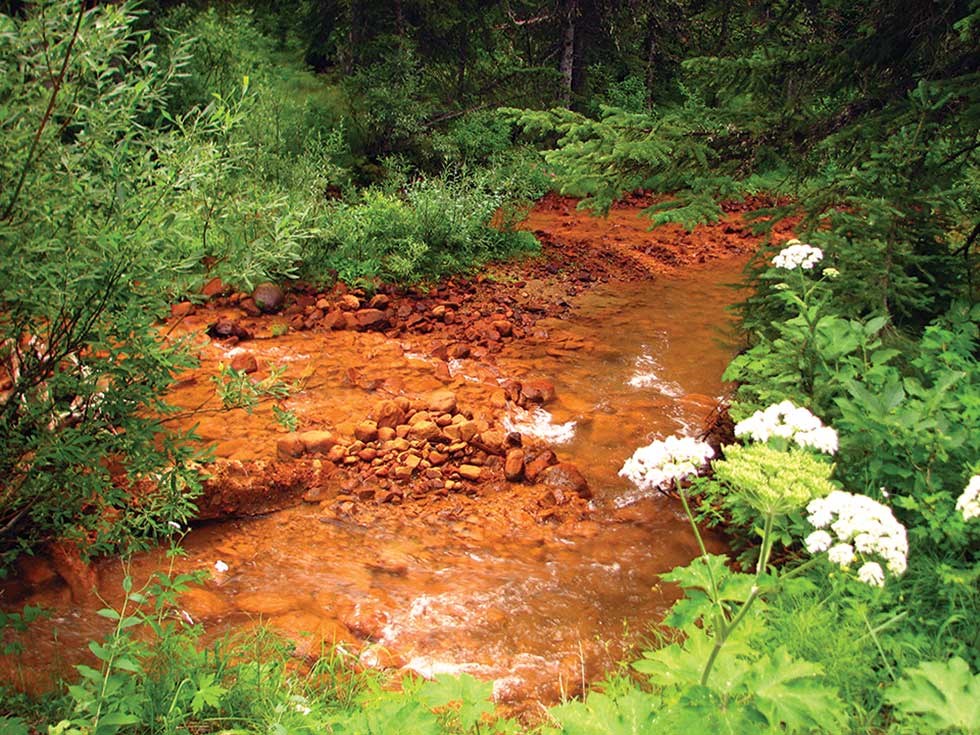
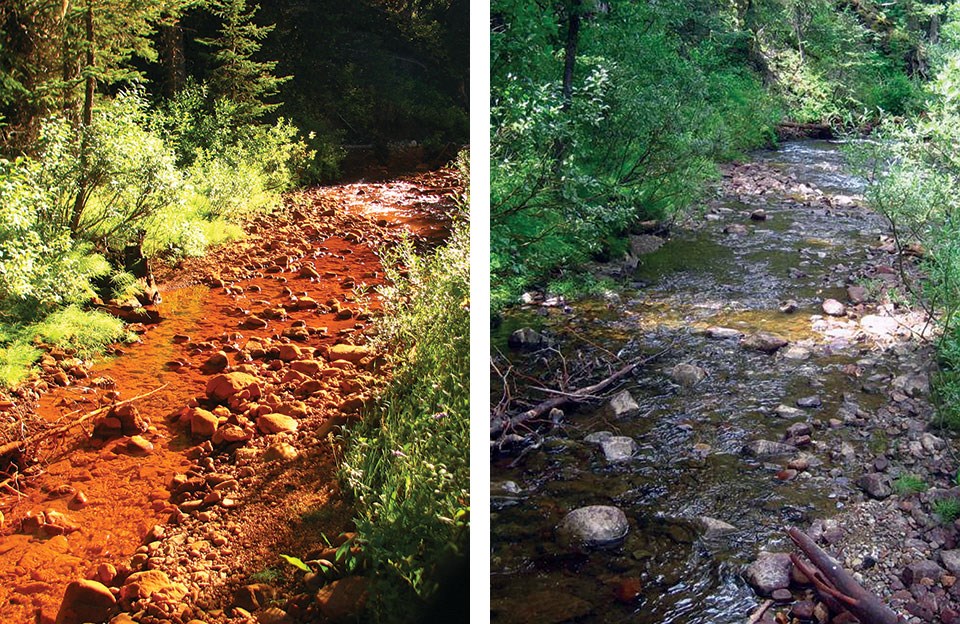
Although mining in this metal-rich region has largely been abandoned, the legacy of mining contributed to the inclusion of a 5-mile (8 km) segment of Soda Butte Creek on Montana’s list of impaired waters (i.e., 303(d) list). (See “Environmental legacy” for further information.) On this list, Soda Butte Creek from Cooke City to the Montana-Wyoming border near the Yellowstone National Park boundary (see fig. 2) was determined to be impaired because of elevated levels of copper, iron, lead, and manganese (MTDEQ 1996). Elevated concentrations of these metals were attributed to Soda Butte Creek’s contact with mine tailings from a gold processing facility, the McLaren site, located just east of Cooke City (Hill 1970; Duff 1972; Meyer 1993; Boughton 2001; fig. 1). Elevated metals also contributed to the stream’s red appearance near Cooke City (fig. 3) where oxidized iron deposits blanketed the stream bottom (MTDEQ 2002b). This once-prized fishery was reported as having “fast-fishing and large trout” in the 1800s, but by 1931 the fishery was categorized as “fair to poor” (cited in USFWS 1979). Surveys of the reach in the early 1970s indicated that no trout were detected in surveys below the influent of tailings waters (Duff 1972; Chadwick 1974). In addition, an instream bioassay documented 80% mortality of fingerling trout following 48-hour exposure to Soda Butte Creek water collected downstream of McLaren site (Chadwick 1974). Based on this and other important work (see Nimmo et al. 1998), evidence overwhelmingly showed that reclamation activities were necessary to remove contributing sources of pollution. Following these recommendations, the US Forest Service (USFS) completed extensive mine reclamation work in the New World Mining District between 2000 and 2008 (USFS 1999b; USFS 2012). USFS-led work in the Soda Butte Creek drainage included waste removal and reclamation of the Great Republic Smelter site near Cooke City and reclamation of a portion of the McLaren Mill site. Both projects were completed in 2005 (USFS 2006). Reclamation of the McLaren site began in June 2010 and was completed in October 2014. The project included pumping and treating contaminated groundwater, removal of the tailings impoundment, and reconstruction of segments of Soda Butte Creek and Miller Creek, which had been impacted by the impoundment (MTDEQ 2009; MTDEQ 2015).
Montana Department of Environmental Quality
Investigation objectives
In spring 2015, the NPS Water Resources Division, Greater Yellowstone Inventory and Monitoring Network, and Yellowstone National Park teamed up with the Montana DEQ to conduct a longitudinal characterization of water quality in upper Soda Butte Creek including the characterization of conditions in tributaries from the McLaren site to the Yellowstone National Park boundary (fig. 2). Our overarching goal of this work was to assess the water quality during the initial phase of recovery and post-reclamation. To that end, we had the following specific objectives: (1) compare metal concentrations from a location downstream of the McLaren site before and after the completion of reclamation work, (2) inventory metals throughout the upper Soda Butte Creek drainage and assess basin-wide water quality, and (3) document benthic sediment chemistry post-reclamation to consider how it aligns with current water quality data from Soda Butte Creek’s main stem and tributaries.
Methods
Basin-wide water quality and sediment chemistry characterization was completed using samples collected from the following locations: Miller Creek above the Soda Butte Creek confluence (MC-1 east and MC-1 west are the two forks of Miller Creek), Soda Butte Creek below McLaren site (SBC-2), Woody Creek above the Republic Creek confluence (WD-1), Republic Creek above the Woody Creek confluence (RC-1), Soda Butte Creek below the confluence of Sheep Creek (SBC-SHP), Soda Butte Creek below the confluence of Wyoming Creek (SBC-WY), an unnamed tributary near the Yellowstone National Park boundary (UT-1), Silver Creek (SC-1), and Soda Butte Creek at the Yellowstone National Park Boundary (SBC-4). For this summary, results from MC-1 east and MC-1 west were averaged for each sampling date and reported as MC-1 in the results. Yellowstone National Park, US Forest Service (USFS), and US Geological Survey (USGS) scientists have completed sampling at these and additional main stem Soda Butte Creek sites over the last two decades (see USFS 1999a; Boughton 2001).
Discharge patterns in Soda Butte Creek are dynamic in time and space. To reconstruct flows for the Soda Butte Creek below the McLaren site (SBC-2) sampling location, we first developed an empirical log-log relationship between discrete discharge measurements (n = 12) collected at SBC-2 and the USGS Soda Butte Creek gage (USGS 06187915) located at the Yellowstone National Park Boundary (SBC-4) between June 2015 and June 2016. We calculated discharge estimates at the SBC-2 sampling location since 2000 using the following statistically significant linear relationship:
log SBC-2 discharge (cfs) = −0.526 +
(0.864 x log SBC-4 discharge [cfs]; R2 = 0.932, P < 0.001)
Water collection (2000–2010)
The US Forest Service contracted with Tetra Tech (formerly Maxim Technologies) to monitor surface water quality during implementation of the New World Response and Restoration Project. Water quality samples were collected using grab techniques from the thalweg (interval exhibiting the largest flow or highest velocity) in accordance with the project water monitoring plan (USFS 1999a). Sample bottles provided by the analytical laboratory were triple rinsed with native water prior to sample collection, preserved as necessary, and placed into coolers with ice for shipment to the laboratory (Pace Analytical, Billings, Montana).
Water collection (2015–2016)
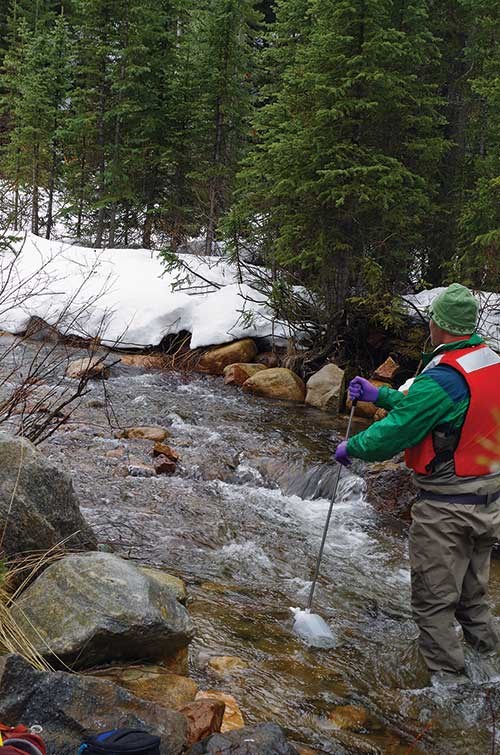
We used depth- and width-integrated sample collection techniques to gather representative water samples from each location. Samples were collected using a DH-81 sampler (Federal Interagency Sedimentation Project, Vicksburg, Mississippi; fig. 4) and composited and homogenized in a 2 gal (8 l) churn sample splitter. All sample collection and splitting equipment was triple rinsed with native water prior to sample collection. Sample bottles provided by the laboratory were triple rinsed from the churn prior to filling. Once rinsed, water was dispensed from the churn into bottles. Metal samples were preserved in the field using concentrated nitric acid (HNO3). Sample containers were shipped to one of two analytical laboratories (ChemTech Ford, Sandy, Utah, or Energy Laboratories, Billings, Montana) over the course of the study; submitted water was analyzed for total metals. Split samples offered opportunities to look at congruence among laboratory results.
National Park Service
We also characterized field water quality physiochemical parameters (e.g., NPS core parameters; Rosenlieb et al. 2002) including temperature, specific conductance, dissolved oxygen concentration, and pH in situ using multiparameter water quality meters at a minimum of three locations on the cross section during all sampling events. This data set is not shown here but is available upon request.
Sediment collection and analysis
We collected benthic sediment samples in the stream cross section at seven sites throughout the upper Soda Butte Creek watershed on 4 and 5 August 2015. Approximately 5 ounces (150 ml) of material was collected at the water-sediment interface from three locations (0.25, 0.50, and 0.75 times the total cross-sectional length). All benthic samples were transported to the Mineralogy Lab at Montana State University in Bozeman, Montana, for processing. To remove moisture and organic materials, samples were first baked at 160–180°F (70–80°C) for three hours. Dried samples were then crushed to a fine powder (grain was ≤10 µm in diameter). Once powdered, each sample was placed into an X-ray fluorescence pellet and sealed with an X-ray penetrable plastic film. Individual samples were placed in the powder X-ray fluorescence analyzer for 122 seconds and the elemental composition of sediments was estimated.
Results
Water quality pre- and post-reclamation below McLaren site
Monitoring location SBC-2 is located in the main stem of Soda Butte Creek immediately downstream of the location of the McLaren site. A branch of Miller Creek discharges to Soda Butte Creek upstream of this monitoring location (fig. 2). Pre-reclamation water quality was characterized using the USFS water quality data set compiled from April 2000 through April 2010 and using the same sampling reaches.
Water quality results from monitoring location SBC-2 (fig. 2) reveal that exceedances of iron (fig. 5) and copper occurred annually from 2000 to 2010. During this period, iron exceeded the Montana water quality standard (1.0 mg/l) in 20 of the 31 samples collected (65%). These iron exceedances generally occurred during low flow conditions. From the 11 samples collected between June 2015 and June 2016 and following the completion of reclamation activities, no exceedances of iron were documented immediately downstream from McLaren site (fig. 5).
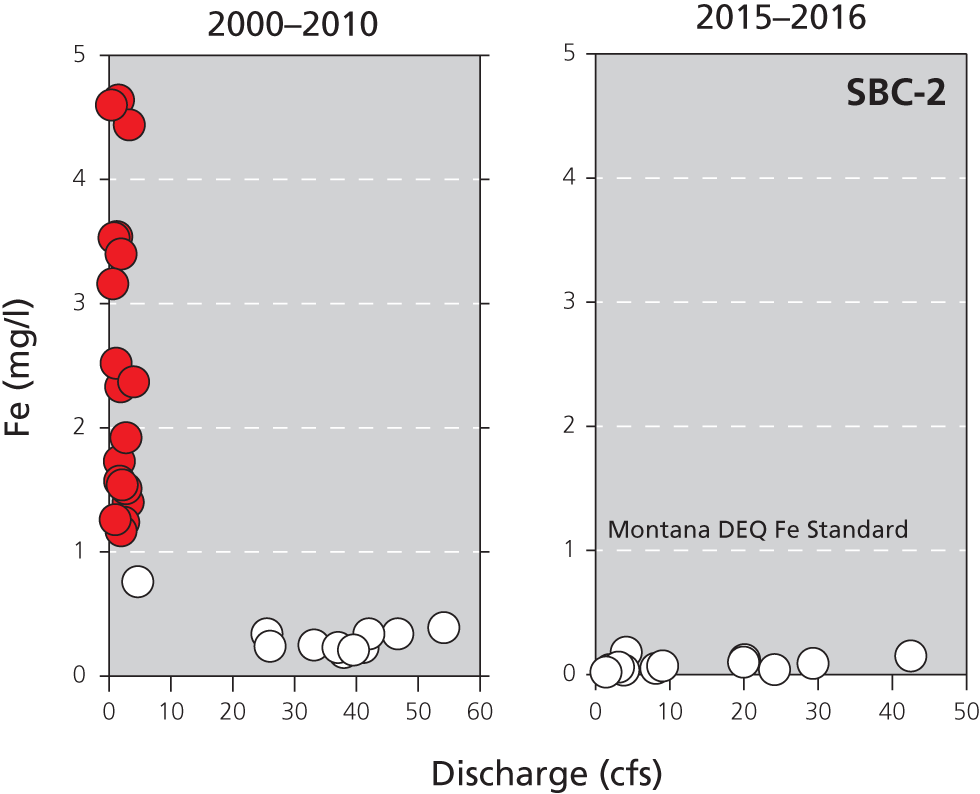
Figure 5. Historical and current iron concentrations from quarterly (2000–2010; pre-reclamation) and monthly (2015 and 2016; post-reclamation) water samples collected from Soda Butte Creek below McLaren site (SBC-2). Water samples meeting the Montana iron standard are shown in white and those exceeding the standard are shown in red. Excluded from this figure (for presentation reasons) was a low flow water sample collected pre-reclamation on 9 April 2009 that had an iron concentration of 27.4 mg/l (result that was 5 times higher than the next highest pre-reclamation sample). Discharge at SBC-2 was estimated using an empirical relationship (see methods) between discharge measured at SBC-2 and discharge measured at the USGS Soda Butte Creek gage (USGS 06187915) located at the Yellowstone National Park boundary (SBC-4). Water samples collected pre-reclamation regularly exceeded the Montana iron standard during low flows. Samples collected post-reclamation met the standard across all discharge levels. (See data for the graphs below.)
| Project Phase | Date | Iron Concentration (mg/l) | Discharge (cfs) |
|---|---|---|---|
| Before Reclamation (2000Ð2010) | 4/14/2000 | 3.16 | 0.59 |
| 7/7/2000 | 0.34 | 25.53 | |
| 10/10/2000 | 2.33 | 1.87 | |
| 4/19/2001 | 4.64 | 1.52 | |
| 6/25/2001 | 0.24 | 26.04 | |
| 10/12/2001 | 2.52 | 1.13 | |
| 4/22/2002 | 3.54 | 1.24 | |
| 7/1/2002 | 0.19 | 37.98 | |
| 10/9/2002 | 1.54 | 2.12 | |
| 4/23/2003 | 2.37 | 3.96 | |
| 6/30/2003 | 0.34 | 46.69 | |
| 9/30/2003 | 1.73 | 1.66 | |
| 4/7/2004 | 4.44 | 3.26 | |
| 6/30/2004 | 0.23 | 41.08 | |
| 10/7/2004 | 0.76 | 4.63 | |
| 4/4/2005 | 3.53 | 0.79 | |
| 6/27/2005 | 0.34 | 42.02 | |
| 9/28/2005 | 1.40 | 3.09 | |
| 4/26/2006 | 1.92 | 2.73 | |
| 6/26/2006 | 0.25 | 33.14 | |
| 9/25/2006 | 1.24 | 2.36 | |
| 4/12/2007 | 1.57 | 1.70 | |
| 6/14/2007 | 0.23 | 37.02 | |
| 9/19/2007 | 1.17 | 1.93 | |
| 4/15/2008 | 1.26 | 0.99 | |
| 7/16/2008 | 0.21 | 39.53 | |
| 9/23/2008 | 1.51 | 2.73 | |
| 6/22/2009 | 0.39 | 54.14 | |
| 9/29/2009 | 3.40 | 1.93 | |
| 4/6/2010 | 4.60 | 0.37 | |
| Project Phase | Date | Iron Concentration (mg/l) | Discharge (cfs) |
| After Reclamation (2015Ð2016) | 6/28/2015 | 0.04 | 24.12 |
| 7/15/2015 | 0.05 | 8.13 | |
| 8/4/2015 | 0.18 | 4.13 | |
| 9/9/2015 | 0.04 | 1.93 | |
| 9/16/2015 | 0.04 | 3.79 | |
| 10/21/2015 | 0.06 | 3.09 | |
| 11/18/2015 | 0.02 | 1.40 | |
| 4/25/2016 | 0.07 | 9.04 | |
| 5/17/2016 | 0.12 | 20.08 | |
| 6/2/2016 | 0.09 | 29.31 | |
| 6/13/2016 | 0.15 | 42.49 | |
| 6/28/2016 | 0.10 | 19.95 |
Notes: Before is pre-2010; after is post-2014. Discharge before was estimated using empirical relationships between SBC-2 and SBC-4; discharge after was from actual measurement. Fe concentrations are in mg/L, discharge in cfs. The Montana Fe standard = 1 mg/L.
Copper and lead water quality standards are a function of measured water hardness. Copper exceedances of the Montana hardness-based water quality standard were less common than iron exceedances prior to reclamation activities, but occurred in 8 of the 31 samples (26%) and typically during high flows. In contrast, only a single copper exceedance was documented in 2015 and 2016 following reclamation. Prior to reclamation, one lead exceedance was documented in 2003. There were no documented lead exceedances below McLaren site after reclamation activities.
Current Montana water quality standards do not include a numeric standard for manganese (MTDEQ 2012). However, the US Environmental Protection Agency (EPA) has established a National Secondary Maximum Contaminant Level (SMCL) for manganese at 0.05 mg/l (USEPA 2017). Prior to reclamation, manganese concentrations exceeded the EPA SMCL in 14 of the 31 samples (45%) collected from 2000 through 2010. None of the 11 post-reclamation samples contained manganese above the SMCL.
Water quality pre- and post-reclamation at the Yellowstone National Park boundary
At the park boundary (SBC-4), exceedances of iron and copper were not as common as they were below McLaren site (SBC-2). From 2000 to 2010 a total of 6 iron, 3 copper, and 4 lead exceedances were documented at SBC-4 from the 31 sampling events conducted during the decade before reclamation. In addition, one sampling event indicated manganese exceeded the EPA SMCL. Post-reclamation, we documented only 2 iron exceedances during 11 scheduled sampling events. There were no documented exceedances of copper, lead, or manganese. Median iron concentration at the park boundary prior to reclamation was 0.62 mg Fe/l; post-reclamation we documented a median concentration of 0.53 mg Fe/l.
Current assessment of water quality in the Soda Butte Creek drainage
Between June 2015 and June 2016, we completed 11 water quality sampling visits to main stem and tributary locations in the Soda Butte Creek watershed (see fig. 2 for sampling locations). An additional tributary location (Miller Creek, MC-1) was added in 2016 and five samples were collected from that site from April to June 2016. Over the 13-month period, we collected samples during multiple high, intermediate, and low flow events.
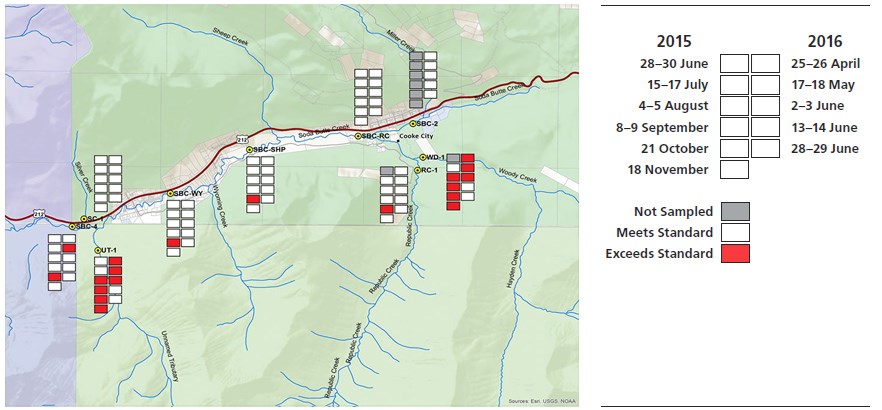
Iron concentrations were low (median = 0.13 mg/l; range 0.02 to 0.42 mg/l) directly below McLaren site (SBC-2) compared to all other monitoring locations (fig. 6A). From June 2015 to June 2016 median iron concentrations were highest in two tributaries: Woody Creek (WD-1, median = 1.16 mg/l; range 0.46 to 2.48 mg/l) and an unnamed (and undeveloped) Soda Butte Creek tributary (UT-1, median = 1.47 mg/l; range 0.65 to 4.04 mg/l) just east of the Yellowstone National Park boundary (fig. 2). Iron concentrations in Woody Creek and the unnamed tributary exceeded water quality standards on 70% and 64% of sampling visits, respectively (fig. 7). Concentrations of iron at the park boundary were strongly positively correlated (Spearman Rank R = 0.773, P = 0.004) with concentrations in the unnamed tributary just outside the park boundary.
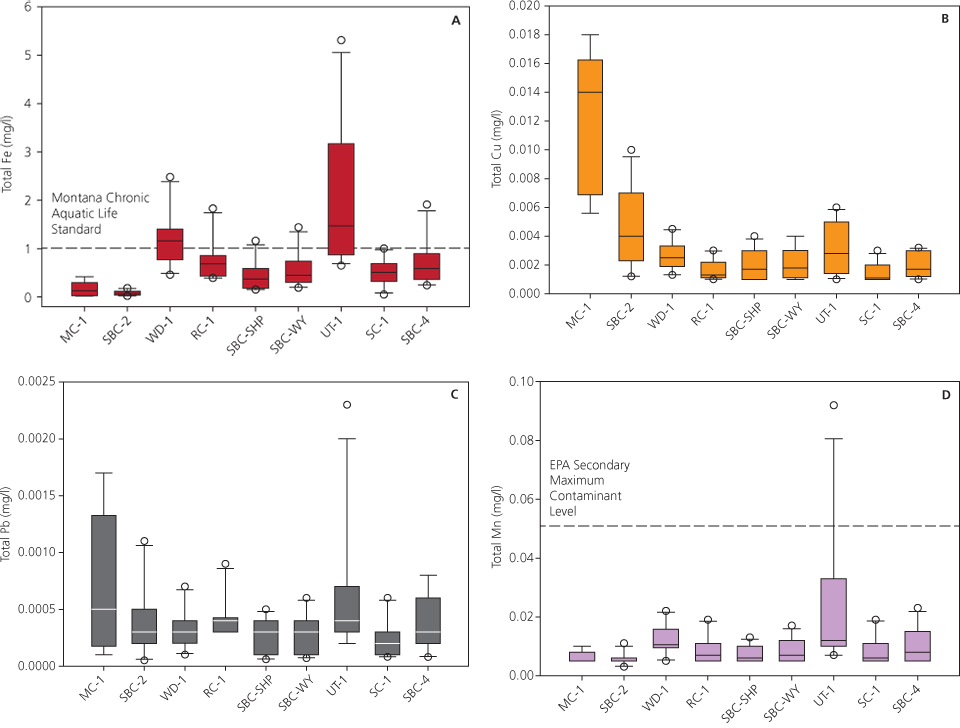
Figure 6. Box whisker plots show total iron (A), copper (B), lead (C), and manganese (D) concentrations from water samples collected from nine sampling locations in the upper Soda Butte Creek watershed (see fig. 2 for sampling location descriptions) from June 2015 through June 2016. Median iron and manganese concentrations were highest in Woody Creek (WD-1) and the unnamed tributary (UT-1); the Montana Chronic Aquatic Life Standard of 1 mg/l and the EPA’s National Secondary Maximum Contaminant Level for manganese of 0.05 mg/l are shown. Copper and lead water quality standards are a function of measured water hardness. Median copper concentrations were highest in Miller Creek (MC-1). Lead concentrations were variable across sites but lead concentrations in Woody Creek and the unnamed tributary exceeded the Montana standard during runoff in 2016. (See data for the graphs below.)
| Iron (Fe) concentrations measured in water 2015 and 2016; expressed in mg/L | |||||||||
|---|---|---|---|---|---|---|---|---|---|
| Contaminant | Site | ||||||||
| MC-1 | SBC-2 | WD-1 | RC-1 | SBC-SHP | SBC-WY | UT-1 | SC-1 | SBC-4 | |
| Iron (Fe) (mg/l) | 0.0200 | 0.0400 | 0.7300 | 0.4300 | 0.3700 | 0.4700 | 0.6500 | 0.3200 | 0.3600 |
| 0.4200 | 0.0500 | 1.3600 | 0.7200 | 0.2300 | 0.2500 | 0.8400 | 0.2200 | 0.2900 | |
| 0.1300 | 0.1800 | 1.2000 | 0.4300 | 0.1700 | 0.4500 | 3.1700 | 0.9000 | 0.8300 | |
| 0.1750 | 0.0400 | 2.4800 | 1.8300 | 0.1800 | 0.1900 | 1.4600 | 0.0500 | 0.2400 | |
| 0.0350 | 1.3700 | 0.9700 | 1.1600 | 1.4400 | 4.0400 | 0.6900 | |||
| 0.0600 | 1.5100 | 0.4300 | 0.1500 | 0.3000 | 2.2400 | 0.3900 | 1.9100 | ||
| 0.0200 | 1.1200 | 0.8200 | 0.3300 | 0.3900 | 1.4700 | 0.5100 | 0.5900 | ||
| 0.0700 | 1.0200 | 0.8200 | 0.5600 | 0.5400 | 1.9400 | 0.6400 | 0.5300 | ||
| 0.1200 | 0.7800 | 0.6500 | 0.7500 | 0.9900 | 5.3100 | 1.0000 | 1.2800 | ||
| 0.0900 | 0.4600 | 0.3900 | 0.5900 | 0.7400 | 0.8950 | 0.5200 | 0.8950 | ||
| 0.1500 | 0.4200 | 0.4300 | 0.8700 | 0.3300 | 0.8100 | ||||
| 0.1000 | 0.3800 | ||||||||
| Copper (Cu) concentrations measured in water 2015 and 2016; expressed in mg/L | |||||||||
| Contaminant | Site | ||||||||
| MC-1 | SBC-2 | WD-1 | RC-1 | SBC-SHP | SBC-WY | UT-1 | SC-1 | SBC-4 | |
| Copper (Cu) | 0.0056 | 0.0044 | 0.0016 | 0.0010 | 0.0014 | 0.0017 | 0.0010 | 0.0010 | 0.0017 |
| 0.0180 | 0.0023 | 0.0025 | 0.0011 | 0.0011 | 0.0011 | 0.0013 | 0.0010 | 0.0011 | |
| 0.0140 | 0.0038 | 0.0024 | 0.0011 | 0.0010 | 0.0012 | 0.0036 | 0.0012 | 0.0016 | |
| 0.0145 | 0.0013 | 0.0045 | 0.0028 | 0.0010 | 0.0010 | 0.0023 | 0.0010 | 0.0010 | |
| 0.0082 | 0.0025 | 0.0012 | 0.0021 | 0.0025 | 0.0053 | 0.0011 | |||
| 0.0076 | 0.0031 | 0.0014 | 0.0010 | 0.0010 | 0.0028 | 0.0011 | 0.0032 | ||
| 0.0012 | 0.0040 | 0.0030 | 0.0019 | 0.0018 | 0.0032 | 0.0011 | 0.0012 | ||
| 0.0032 | 0.0030 | 0.0020 | 0.0040 | 0.0040 | 0.0050 | 0.0030 | 0.0021 | ||
| 0.0040 | 0.0020 | 0.0020 | 0.0030 | 0.0030 | 0.0060 | 0.0020 | 0.0030 | ||
| 0.0070 | 0.0013 | 0.0012 | 0.0030 | 0.0040 | 0.0020 | 0.0020 | 0.0030 | ||
| 0.0100 | 0.0017 | 0.0020 | 0.0014 | 0.0010 | 0.0030 | ||||
| 0.0057 | 0.0015 | ||||||||
| Lead (Pb) concentrations measured in water 2015 and 2016; expressed in mg/L | |||||||||
| Contaminant | Site | ||||||||
| MC-1 | SBC-2 | WD-1 | RC-1 | SBC-SHP | SBC-WY | UT-1 | SC-1 | SBC-4 | |
| Lead (Pb) | 0.0001 | 0.0002 | 0.0002 | 0.0003 | 0.0004 | 0.0004 | 0.0002 | 0.0001 | 0.0003 |
| 0.0017 | 0.0001 | 0.0004 | 0.0004 | 0.0001 | 0.0001 | 0.0002 | 0.0001 | 0.0001 | |
| 0.0005 | 0.0011 | 0.0004 | 0.0003 | 0.0001 | 0.0002 | 0.0007 | 0.0006 | 0.0003 | |
| 0.0010 | 0.0001 | 0.0004 | 0.0009 | 0.0001 | 0.0001 | 0.0003 | 0.0005 | 0.0001 | |
| 0.0003 | 0.0002 | 0.0004 | 0.0003 | 0.0003 | 0.0007 | 0.0002 | |||
| 0.0002 | 0.0003 | 0.0003 | 0.0001 | 0.0001 | 0.0004 | 0.0001 | 0.0006 | ||
| 0.0005 | 0.0003 | 0.0004 | 0.0002 | 0.0003 | 0.0004 | 0.0002 | 0.0002 | ||
| 0.0003 | 0.0007 | 0.0005 | 0.0004 | 0.0004 | 0.0008 | 0.0003 | 0.0003 | ||
| 0.0004 | 0.0003 | 0.0004 | 0.0003 | 0.0005 | 0.0023 | 0.0003 | 0.0008 | ||
| 0.0003 | 0.0001 | 0.0003 | 0.0005 | 0.0006 | 0.0003 | 0.0003 | 0.0004 | ||
| 0.0009 | 0.0003 | 0.0004 | 0.0003 | 0.0001 | 0.0008 | ||||
| 0.0005 | 0.0002 | ||||||||
| Manganese (Mn) concentrations measured in water 2015 and 2016; expressed in mg/L | |||||||||
| Contaminant | Site | ||||||||
| MC-1 | SBC-2 | WD-1 | RC-1 | SBC-SHP | SBC-WY | UT-1 | SC-1 | SBC-4 | |
| Manganese (Mn) | 0.0050 | 0.0050 | 0.0080 | 0.0050 | 0.0080 | 0.0080 | 0.0070 | 0.0060 | 0.0070 |
| 0.0100 | 0.0050 | 0.0180 | 0.0070 | 0.0050 | 0.0050 | 0.0070 | 0.0050 | 0.0050 | |
| 0.0050 | 0.0110 | 0.0100 | 0.0050 | 0.0050 | 0.0060 | 0.0330 | 0.0190 | 0.0150 | |
| 0.0060 | 0.0050 | 0.0220 | 0.0190 | 0.0050 | 0.0050 | 0.0120 | 0.0050 | 0.0050 | |
| 0.0050 | 0.0110 | 0.0080 | 0.0100 | 0.0120 | 0.0330 | 0.0110 | |||
| 0.0060 | 0.0100 | 0.0050 | 0.0050 | 0.0050 | 0.0190 | 0.0050 | 0.0170 | ||
| 0.0050 | 0.0130 | 0.0070 | 0.0050 | 0.0050 | 0.0120 | 0.0050 | 0.0080 | ||
| 0.0050 | 0.0150 | 0.0140 | 0.0080 | 0.0090 | 0.0350 | 0.0110 | 0.0050 | ||
| 0.0030 | 0.0100 | 0.0100 | 0.0130 | 0.0170 | 0.0920 | 0.0170 | 0.0230 | ||
| 0.0040 | 0.0050 | 0.0050 | 0.0100 | 0.0120 | 0.0100 | 0.0090 | 0.0140 | ||
| 0.0060 | 0.0060 | 0.0070 | 0.0100 | 0.0060 | 0.0140 | ||||
| 0.0050 | 0.0050 | ||||||||
Copper levels were highest in Miller Creek (MC-1), a tributary that drains from the mineral-rich region (New World Mining District) north of the project site, directly into the reclamation site. Median copper levels in Miller Creek were 3.5 to >10 times higher than median levels of copper for all other sites including the main stem Soda Butte Creek (fig. 6B). Copper concentrations in the unnamed tributary also exceeded Montana’s hardness-based standard for copper on five sampling occasions.
Lead concentrations for all main stem Soda Butte Creek sites were below Montana’s hardness-based water quality standards. Lead concentrations in Woody Creek and the unnamed tributary exceeded the water quality standard during runoff in 2016; the unnamed tributary also exceeded the lead standard during a rain-generated runoff event in August 2015 (fig. 6C). Manganese was detected above the EPA SMCL only in the unnamed tributary during a single sampling event (2 June 2016; fig. 6D).
Key
Gray: Not Sampled
White: Meets Standard
Red: Exceeds Standard
Figure 7. Map of the upper Soda Butte Creek watershed showing total iron exceedances from 11 sampling occasions and nine locations (see fig. 2 for sampling location descriptions) between June 2015 and June 2016. Red boxes indicate an exceedance of the Montana Chronic Aquatic Life Standard of 1 mg/l. White boxes indicate iron concentrations were below the Montana standard. Iron concentrations exceeded the standard on most occasions in two tributaries: Woody Creek (WD-1) and an unnamed tributary (UT-1). Elsewhere, iron exceedances were uncommon (RC-1, SBC-SHP, SBC-WY, and SBC-4) or not detected (MC-1, SBC-2, and SC-1). Gray boxes indicate a site was not sampled on a given date.
Benthic sediment chemistry
Sediment iron levels were significantly lower in Soda Butte Creek below the former McLaren site (SBC-2; 2.64% or 26,384 ppm iron), but similar (averaging 4.5% or 45,046 ppm iron across sites) in main stem and tributary reaches downstream of that location (fig. 9A). In general, there was a positive relationship between iron in benthic sediments and median concentrations of iron documented in water samples collected from June 2015 to June 2016 (fig. 8).
In contrast to patterns for iron, copper and lead concentrations associated with benthic sediments were highest in the main stem of Soda Butte Creek immediately below McLaren site at SBC-2. While benthic sediments were not collected from Miller Creek (MC-1), this tributary contributes significantly to the total copper and lead loads documented in waters at SBC-2 (fig. 9B and 9C) and in downstream reaches of Soda Butte Creek that were sampled below McLaren site.
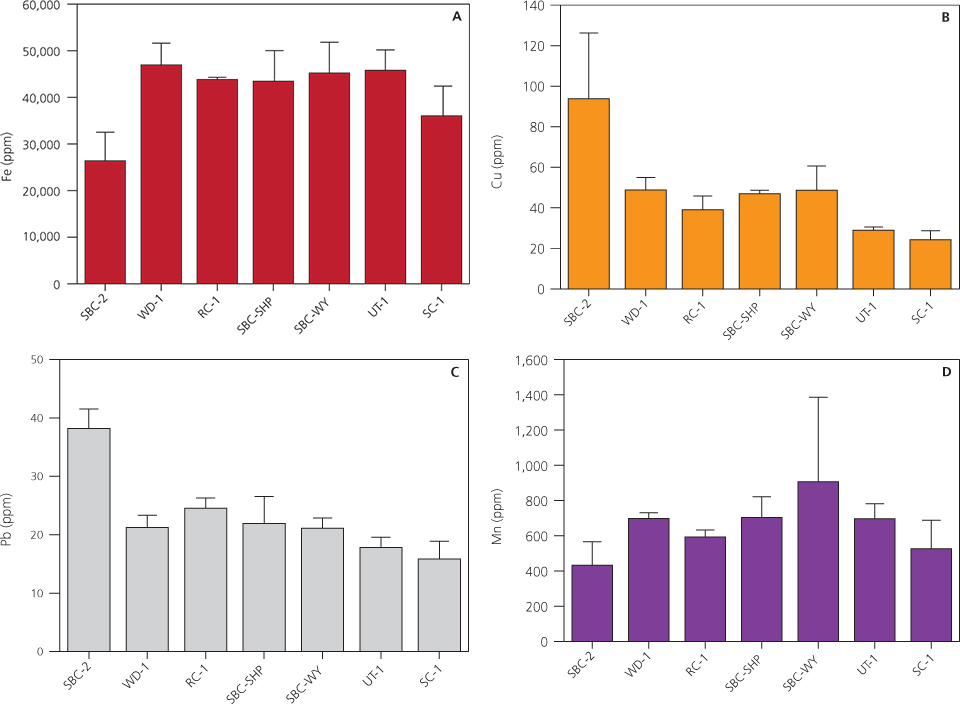
Figure 8. In the upper Soda Butte Creek watershed, benthic sediment iron and water iron concentrations are positively related. Sampling sites with higher average sediment iron concentration (e.g., Woody Creek [WD-1]) tended to have higher concentrations of iron in surface water. See fig. 2 for sampling location descriptions. (See data for the four graphs below).
| Site | Fe ppm | Fe (SE) |
|---|---|---|
| RC-1 | 4.64 | 0.69 |
| SBC-WY | 4.66 | 0.45 |
| WD-1 | 4.67 | 1.16 |
| SBC-SHP | 4.64 | 0.37 |
| UT-1 | 4.66 | 1.47 |
| SBC-2 | 4.42 | 0.07 |
| SC-1 | 4.56 | 0.51 |
Notes: Relationship between August 2015 log of average sediment (Fe) and median Fe in water sampled at same sites between 2015 and 2016.
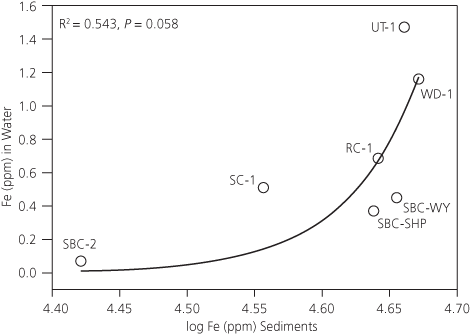
Figure 9. The bar graphs show concentrations of benthic sediment iron (A), copper (B), lead (C), and manganese (D) (in ppm [mg/kg equivalent]) for seven sampling locations (see fig. 2 for sampling location descriptions). Sediment iron was lowest in Soda Butte Creek below the McLaren site (SBC-2). Sediment copper and lead were highest at SBC-2.
| Site | Iron | Copper | Lead | Manganese | ||||
|---|---|---|---|---|---|---|---|---|
| ppm | SD | ppm | SD | ppm | SD | ppm | SD | |
| SBC-2 | 26,384.197 | 6,119.910 | 93.783 | 32.472 | 38.167 | 3.351 | 432.723 | 133.271 |
| WD-1 | 46,936.410 | 4,650.831 | 48.780 | 6.205 | 21.223 | 2.111 | 697.877 | 32.892 |
| RC-1 | 43,813.730 | 485.078 | 39.060 | 6.762 | 24.513 | 1.786 | 593.407 | 39.664 |
| SBC-SHP | 43,466.973 | 6,543.589 | 46.897 | 1.733 | 21.910 | 4.651 | 703.077 | 118.794 |
| SBC-WY | 45,211.853 | 6,576.985 | 48.673 | 11.957 | 21.107 | 1.756 | 906.353 | 479.235 |
| UT-1 | 45,799.043 | 4,371.040 | 28.893 | 1.697 | 17.813 | 1.756 | 696.213 | 85.622 |
| SC-1 | 36,024.233 | 6,389.915 | 24.243 | 4.400 | 15.857 | 3.028 | 525.800 | 161.594 |
Notes: Concentrations in ppm from powder X-ray fluorescence analyzer. Original figure caption: The bar graphs show concentrations of benthic sediment iron (A), copper (B), lead (C), and manganese (D) (in ppm [mg/kg equivalent]) for seven sampling locations (see fig. 2 for sampling location descriptions). Sediment iron was lowest in Soda Butte Creek below the McLaren site (SBC-2). Sediment copper and lead were highest at SBC-2.
Discussion
Previous studies identified both natural and anthropogenic sources contributing to metal loads measured in Soda Butte Creek upstream of Yellowstone National Park. These studies identified the highest concentrations of metals in the watershed below the tailings of the former McLaren Mill and Tailings site. For example, Boughton (2001) documented concentrations of iron, copper, and lead (418 mg/l Fe, 6.08 mg/l Cu, and 0.603 mg/l Pb, respectively) in a seep below the tailings dam that exceeded Montana water quality standards by two to three orders of magnitude. USFS data from 2000 to 2010 confirm that exceedances of iron and copper were common in Soda Butte Creek below McLaren site prior to reclamation. Using this and other historical water quality data (Hill 1970; Chadwick 1974; Nimmo et al. 1998), the Montana DEQ estimated that a 99% reduction in total metal loads from the McLaren site was needed to restore beneficial uses (i.e., designated goals, societal values, or fish and wildlife benefits associated with a water body) in Soda Butte Creek (MTDEQ 2002b).
The current investigation shows that reclamation of McLaren site effectively eliminated this known anthropogenic source of iron, copper, lead, and manganese in the drainage. Water quality test results indicate that tributaries, rather than the main stem of Soda Butte Creek below McLaren site, now introduce waters with the highest concentrations of metals. Woody Creek and the unnamed tributary both regularly exceeded Montana’s water quality standards for metals. Importantly, exceedances of metal standards were rare at main stem sites and occurred only at sampling locations downstream of these tributary inputs.
Benthic iron levels below McLaren site measured in 2015 (2% to 3% iron) are near background levels for floodplain and benthic sediments of this region (Meyer 1993; Hren 2001; fig. 5). More importantly, current levels of iron are significantly lower than those in the former McLaren tailings impoundment (21% iron) and pre-reclamation sediments downstream of the former mill site (8% to 16% iron; Meyer 1993). However, copper and lead levels in sediments below McLaren site were generally higher than at other monitoring locations. While sediments were not measured from Miller Creek, that tributary discharges to Soda Butte Creek from the north and above our SBC-2 sampling location (fig. 2). Natural erosion of the ore-bearing region to the north of the project site produces metal-rich waters that have contributed to regional water chemistry since the Pleistocene (Furniss et al. 1999; Hren et al. 2001). Sediments transported in these flashy, high-gradient streams may have deposited in the main stem of Soda Butte Creek and contributed to the elevated copper and lead levels documented. It is also possible the elevated copper and lead concentrations in sediments documented at SBC-2 are attributable to pre-reclamation discharges from McLaren site. The latter interpretation, however, is inconsistent with the low concentration of iron detected in sediments at this location (fig. 9).
Taken as a whole, the investigation reveals significant improvements in the Soda Butte Creek water below the McLaren site (see fig. 10). Current water quality exceedances at the Yellowstone National Park boundary appear to be limited to iron. Iron in Soda Butte Creek is readily traced to two tributaries neither of which has any identified mine-land disturbances. At least one of these tributaries (the unnamed tributary) has no evidence of significant anthropogenic activity such as from roads or trails. As a result, water quality conditions in Soda Butte Creek now appear to be dominated by non-anthropogenic sources of metals.
(2) Montana Department of Environmental Quality
Concluding remarks
The reclamation of the McLaren site represents a milestone in the assessment and restoration of Soda Butte Creek from mining-related impacts and culminates 15 years of coordinated work between the National Park Service and the Montana DEQ. The improvement in water quality has facilitated the return of beneficial uses to the Greater Yellowstone Ecosystem. For example, the multiagency Soda Butte Creek Yellowstone Cutthroat Trout Conservation Project was initiated in 2015 to protect and secure habitat for Yellowstone cutthroat trout (Oncorhynchus clarkii bouvieri) in the Soda Butte Creek drainage and the greater Lamar River watershed (MTFWP 2015). The return of salmonids and inclusion of Soda Butte Creek in this conservation plan offer testament to the fact that the ecological recovery of Soda Butte Creek is advancing.
The collaboration between the Montana DEQ and the National Park Service was critical to the planning and execution of the McLaren Tailings Reclamation Project. This group venture also made possible the current inventory of water quality in the upper Soda Butte Creek drainage and those data led to a determination in November 2017 by the Montana DEQ Water Quality Bureau that metals conditions in Soda Butte Creek support all designated beneficial uses. At the time of this writing, the EPA has concurred with this recommendation. As a result, the Montana DEQ has recommended removing Soda Butte Creek from the 303(d) Impaired Waters List. For the Montana DEQ and its project partners, this marks the first time in Montana that a water body has been proposed for delisting from the 303(d) Impaired Waters List for metals following the successful implementation of abandoned mine cleanup.
UPDATE: July 2019
Montana DEQ published its 2018 Integrated Report on water quality in November 2018 and highlighted the delisting of metals in Soda Butte Creek as one of the state’s success stories. The successful clean-up of this abandoned mine site and Soda Butte Creek was celebrated by all partners and the local communities of Cooke City and Silver Gate, Montana in July 2019. During this celebration, we also honored Tom Henderson, who passed away unexpectedly in October 2018. Many in Yellowstone worked with and knew Tom for his leadership role in the reclamation and clean-up of the abandoned McLaren Mill and Tailings site on Soda Butte Creek. While Tom worked on mine clean-ups across Montana, he always remarked that his work on Soda Butte Creek was the highlight of his career. Tom will be sorely missed by his National Park Service friends and colleagues, but his legacy will live on through his great work and passion for collaboration.
Literature cited
Boughton, G. K. 2001. Metal loading in Soda Butte Creek upstream of Yellowstone National Park, Montana and Wyoming: A retrospective analysis of previous research; and quantification of metal loading, August 1999. Water Resources Investigations Report 01-4170. US Geological Survey, Cheyenne, Wyoming, USA. 68 pages. Available at https://pubs.usgs.gov/wri/wri014170/pdf/wri004170.pdf.
Chadwick, J. W. 1974. The effects of iron on the macroinvertebrates of Soda Butte Creek. MS Thesis. Montana State University, Bozeman, Montana, USA.
Duff, D. A. 1972. Reconnaissance survey of aquatic habitat conditions affected by acid mine pollution in the Cooke City area, Custer and Gallatin National Forests, Montana, and Shoshone National Forest, Wyoming. Unpublished report by the US Fish and Wildlife Service, Division of Range and Wildlife, Northern Region, USA. 18 pages.
Furniss, G., N. W. Hinman, G. A. Doyle, and D. D. Runnells. 1999. Radio carbon–dated ferricrete provides a record of natural acid rock drainage and paleoclimatic changes. Environmental Geology 37:102–106.
GCM Services, Inc. 1985. Cultural resource inventory and evaluation of the McLaren Mill Site, Cooke City, Montana. Prepared for Montana Department of State Lands, Abandoned Mine Reclamation Bureau, Butte, Montana, USA.
———. 1998. Cultural resource inventory and evaluation for the Republic Smelter (24PA971). Prepared for Montana Department of Environmental Quality, Mine Waste Cleanup Bureau, Butte, Montana, USA.
Glidden, R. 1982. Exploring the Yellowstone high country: A history of the Cooke City Area. Second edition. Cooke City Store, Cooke City, Montana, USA. 120 pages.
———. 2001. Old mine waste threatens Yellowstone’s Soda Butte Creek. Practical Failure Analysis 1:25–29.
Hill, R. D. 1970. McLaren mine tailings mine drainage. Unpublished report. Federal Water Quality Administration, Taft Water Research Center, Cincinnati, Ohio, USA.
Hren, M., C. Chamberlain, and F. Magilligan. 2001. A combined flood surface and geochemical analysis of metal fluxes in a historically mined region: A case study from the New World Mining District, Montana. Environmental Geology 40:1334–1346.
Johnson, M. S. 16 June 1949. Memorandum for the Chief Ranger. Re: Pollution of Soda Butte Creek. Yellowstone National Park Archives File 650-05. Yellowstone National Park, Mammoth, Wyoming, USA.
———. 27 June 1950. Memorandum for the Chief Ranger. Re: Pollution of Soda Butte Creek. Yellowstone National Park Archives File 650-05. Yellowstone National Park, Mammoth, Wyoming, USA.
Kauf, M., and M. W. Williams. 2004. Soda Butte Creek and Reese Creek: Vital Signs Monitoring Program final report for the Greater Yellowstone Network. University of Colorado, Boulder, Colorado, USA.
Krohn, D. H., and M. M. Weist. 1977. Principal information on Montana mines. Montana Bureau of Mines and Geology Special Publication 75. Montana College of Mineral Science and Technology, Butte, Montana, USA.
Lovering, T. F. 1929. The New World or Cooke City Mining District, Park County, Montana. U.S. Geological Survey Bulletin 811-A:1–87.
Meyer, G. 1993. A polluted flash flood and its consequences. Yellowstone Science 2:2–6.
MTDEQ (Montana Department of Environmental Quality). 1996. Montana list of waterbodies in need of total maximum daily load development. Montana Department of Environmental Quality, Helena, Montana, USA.
———. 2002a. Draft Final Expanded Engineering Evaluation/Cost Analysis (EEE/CA) for the McLaren Tailings Site, Cooke City, Montana. Pioneer Technical Services, Inc., Butte, Montana, USA.
———. 2002b. Water Quality Restoration Plan for the Cooke City TMDL Planning Area. Montana Department of Environmental Quality, Helena, Montana, USA.
———. 2009. Final Reclamation Design Report for the McLaren Tailings Abandoned Mine Site, Cooke City, Montana. Pioneer Technical Services, Inc., Butte, Montana, USA.
———. 2012. Montana Numeric Water Quality Standards. Circular DEQ-7. Planning, Prevention, and Assistance Division, Water Quality Standards Section, Helena, Montana, USA.
———. 2015. Final Construction Completion for the McLaren Tailings Abandoned Mine Site. Pioneer Technical Services, Inc., Butte, Montana, USA.
MTFWP (Montana Fish, Wildlife, and Parks). 2015. Soda Butte Creek Yellowstone Cutthroat Trout Conservation Project. Draft Environmental Assessment. MTFWP Region 5 Office, Billings, Montana, USA.
Nimmo, D. R., M. J. Willox, T. D. Lafrancois, P. L. Chapman, S. F. Brinkman, and J. C. Greene. 1998. Effects of metal mining and milling on boundary waters of Yellowstone National Park, USA. Environmental Management 22:913–926.
O’Ney, S., J. Arnold, C. Bromely, K. Hershberger, and W. A. Sigler. 2011. Greater Yellowstone Network water quality monitoring annual report: January 2009–December 2009. Natural Resource Data Series NPS/GRYN/NRDS—2011/310. National Park Service, Natural Resource Stewardship and Science, Fort Collins, Colorado, USA.
Reed, G. C. 1950. Mines and mineral deposits (except fuels), Park County, Montana. Information Circular No. 7546. US Bureau of Mines, Washington, DC, USA.
Rosenlieb, G., P. Penoyer, B. Jackson, and D. Kimball. 2002. Recommendations for core water quality monitoring parameters and other key elements of the NPS Vital Signs Program water quality monitoring component. National Park Service, Freshwater Workgroup Subcommittee, Fort Collins, Colorado, USA. Accessed 20 October 2017 at https://www.nature.nps.gov/water/vitalsigns/assets/docs /COREparamFINwSIGpg.pdf.
USEPA (US Environmental Protection Agency). 2017. Secondary drinking water standards: Guidance for nuisance chemicals. Website. Accessed 16 March 2017 at https://www.epa.gov/dwstandardsregulations/secondary-drinking-water-standards-guidance-nuisance-chemicals.
USFWS (US Fish and Wildlife Service). 1979. Fishery and aquatic management program in Yellowstone National Park. Technical Report for Calendar Year 1978. Yellowstone National Park, Mammoth, Wyoming, USA.
USFS (US Forest Service). 1999a. Long-Term Surface Water Quality Monitoring Plan, New World Mining District Response and Restoration Project. Prepared by Maxim Technologies, Inc., Helena, Montana, USA.
———. 1999b. Overall project work plan, New World Mining District Response and Restoration Project. Prepared by Maxim Technologies, Inc., Helena, Montana, USA.
———. 2006. Project summary, New World Mining District Response and Restoration Project. Prepared by Maxim Technologies, Inc., Helena, Montana, USA.
———. 2012. New World Project Long-Term Operations and Maintenance Plan, New World Mining District Response and Restoration Project. Prepared by Tetra Tech, Bozeman, Montana, USA.
About the authors
Tom Henderson is a senior environmental project officer with the Montana DEQ Abandoned Mine Lands Program. Andrew Ray (e-mail us; 406-994-7498) is an ecologist with the NPS Greater Yellowstone Inventory and Monitoring Network. Pete Penoyer is a hydrologist with the NPS Natural Resource Stewardship and Science Directorate Water Resources Division. Ann Rodman is a physical scientist with the Yellowstone Center for Resources at Yellowstone National Park. Mary Levandowski is a hydrologic technician with the NPS Greater Yellowstone Inventory and Monitoring Network. Alysa Yoder was a hydrologic intern with the Montana Institute on Ecosystems at the time of this work and is now an MS candidate in the Hydrologic Sciences Graduate Group at the University of California, Davis. Shane Matolyak is an environmental scientist with Tetra Tech. Mary Beth Marks is a geologist and on-scene coordinator with the USFS Custer, Gallatin, and Beaverhead-Deerlodge National Forests. Autumn Coleman is the program manager for the Montana DEQ Abandoned Mine Lands Program.
