Last updated: February 15, 2026
Article
Sea-level rise and inundation scenarios for national parks in South Florida
By Joseph Park, Erik Stabenau, and Kevin Koutun
The National Park Service (NPS) is tasked with the unimpaired preservation of the natural and cultural resources of the National Park System for the enjoyment, education, and inspiration of current and future generations. This mission and perspective positions the National Park Service as a leader in the recognition of and adaptation to changes in Earth’s climate. It is now unequivocal that the climate is warming, and since the 1950s many of the observed changes are unprecedented over decades to millennia. The atmosphere and oceans have warmed, snow and ice have diminished, sea level has risen, and concentrations of greenhouse gases have increased (Steffan et al. 2015; IPCC 2013).
One of the most robust indicators of climate change is rising sea level driven by thermal expansion of ocean water and addition of land-based ice-melt to oceans. Sea-level rise is not evenly distributed around the globe, and the response of a regional coastline is highly dependent on local natural and human settings (Cazenave and Le Cozannet 2014). Nowhere is this more evident than in the national parks and national preserve located at the southern end of the Florida peninsula—Dry Tortugas, Biscayne, and Everglades National Parks and Big Cypress National Preserve—where low elevations and exceedingly flat topography provide an ideal setting for encroachment of the sea.
The physical and ecological impacts of sea-level rise on these parks will be pronounced, and in some cases, such as the distribution of mangrove forests, change has already been observed (Krauss et al. 2011). The natural ecological capacity for adaptation and resilience to these changes will be enhanced through the timely implementation of the Comprehensive Everglades Restoration Plan (CERP), simultaneously protecting the regional water supply for both natural and urban needs (NRC 2014).
Given these current and anticipated changes, it is prudent to define expectations for sea-level rise and the associated physical responses over the coming decades. This article is intended to inform the current state of science regarding these expectations.
Sea-level rise
The Intergovernmental Panel on Climate Change (IPCC) is composed of leading scientists from around the world whose mission is to review and assess the most recent scientific, technical, and socioeconomic information relevant to the understanding of climate change. Its most recent assessment, published in 2013, is the Fifth Assessment Report (AR5), which includes projections of global sea-level rise based on different representation concentration pathway (RCP) scenarios reflecting possible scenarios for future concentrations of greenhouse gases. RCP 8.5 is the highest emission and warming scenario under which greenhouse gas concentrations continue to rise throughout the 21st century, while RCP 6 and RCP 4.5 expect substantial emission declines to begin near 2080 and 2040, respectively.
The IPCC sea-level rise scenarios are comprehensive, but do not include contributions from a potential collapse of Antarctic ice sheets. However, recent evidence suggests that such a collapse may be under way (Holland et al. 2015; Wouters et al. 2015). In addition, the IPCC projections do not account for local processes such as land uplift or subsidence and ocean currents, and do not provide precise estimates of the probabilities associated with specific sea-level rise scenarios, which are a crucial decision support metric in the development and assessment of risk.
A contemporary estimate of local effects and comprehensive probabilities for the RCP scenarios is provided by Kopp et al. (2014). This work is based on a synthesis of tide gauge data, global climate models, and expert elicitation, and includes consideration of the Greenland ice sheet, West and East Antarctic ice sheets, glaciers, thermal expansion, regional ocean dynamic effects, land water storage, and long-term, local, nonclimatic factors such as glacial isostatic adjustment, sediment compaction, and tectonics. Following a review of scientific literature, we have adopted the work of Kopp et al. (2014) as the basis for sea-level rise scenarios at the four South Florida national parks.
Datums and mean sea level
A tidal datum provides a geodetic link between ocean water level and a land-based elevation reference such as the North American Vertical Datum of 1988 (NAVD88). The National Tidal Datum Epoch (NTDE) in the United States is a 19-year period over which tidal datums specific to each tide gauge are determined. The current NTDE for the United States is 1983–2001 and sea-level rise projections are referenced to the midpoint of this period (1992), consistent with procedures for sea-level rise design determined by the U.S. Army Corps of Engineers (USACE) and the National Oceanic and Atmospheric Administration’s (NOAA) National Climate Assessment (USACE 2014). Common tidal datums include mean sea level (MSL), mean high-higher water (MHHW), and mean low-lower water (MLLW) as defined by NOAA (Center for Operational Oceanographic Products and Services 2013). As sea level rises, tidal datum elevations also rise, and a new tidal datum is established every 20 to 25 years to account for sea-level change and vertical adjustment of the local landmass (Center for Operational Oceanographic Products and Services 2000).
Kopp et al. (2014) use a local mean sea-level reference starting in the year 2000 instead of the NTDE MSL datum centered on 1992. To convert these projections to NTDE we estimate mean sea-level rise over the 1992 to 2000 period at Vaca Key with a nonlinear trend analysis and add the resulting value of 1.4 cm (0.6 in) to their projections. All projected water levels are then converted to NAVD88 by subtraction of the 25.3 cm (10.0 in) NAVD88 to NTDE MSL offset at the Vaca Key tide station.
Projection
Examination of local sea-level rise projections around South Florida finds small differences among Naples, Virginia Key, Vaca Key, and Key West, which are geographically closest to Big Cypress National Preserve, Biscayne National Park, Everglades National Park, and Dry Tortugas National Park, respectively. We chose the Vaca Key station sea-level data as representative of all four natural areas since it best reflects local oceanographic processes that influence coastal sea levels around South Florida.
Regarding selection of greenhouse gas emission scenarios, we employ RCP 8.5, also known as the “business-as-usual” scenario in which greenhouse gas emissions continue to rise. Although significant rhetoric is aimed at global emissions reduction, emissions continue to escalate and presently there is no clear socioeconomic driver to depart from a carbon-based energy infrastructure. More specifically, recent assessments of global energy production and population conclude that the RCP 4.5 emission scenario is unobtainable, and there is significant uncertainty as to whether the RCP 6.0 scenario can be realized (Jones and Warner 2016).
Each emission scenario and geographic location will have a spectrum of projections that span the possible ranges of sea-level rise, and this range is expressed as a probability of occurrence. A probability is commonly understood as the chance or likelihood of an event happening out of a large pool of possible events, and in this case the probability refers to occurrence of a specific sea-level rise curve out of the many possible curves under a particular climate scenario. Many different curves are possible for each scenario since there are uncertainties in the observable data (e.g., ice sheets and thermal expansion) as well as limitations in the models from which the projections are derived. The median projection (50th percentile) is in the middle of the projections (one-half of the projections are lower, one-half are higher) and can be considered a likely scenario given the current state of knowledge. A high percentile projection such as the 99th percentile is one with only a 1% chance that sea levels would exceed it, and is considered a worst-case scenario.
Since this projection is intended to inform authorities of sea-level rise for adaptation and planning purposes, and in light of the significant uncertainties inherent in generation of the projections and future dynamics of the climate, it is prudent to consider the upper percentile range of projections. In evaluating these factors we select the RCP 8.5 median (50th percentile) as the lower boundary of the projection, and the 99th percentile as the upper boundary. We are therefore conservatively biasing the projections to lie between a lower bound of likely sea-level rise and a high projection representing an upper limit to be considered in risk assessments for highly vulnerable, costly, or risk-averse applications. We emphasize that the high projection is deemed to have only a 1% chance of occurrence under current climate conditions, but in the event of Antarctic ice sheet collapse, its projected sea-level rise is consistent with estimates that include Antarctic ice melt contribution (DeConto and Pollard 2016).
The sea-level rise projection for South Florida referenced to the NAVD88 datum for the RCP 8.5 emission scenario and occurrence probabilities of 50% and 99% is shown in figure 1, and is tabulated in tables 1A and 1B. These projections have been offset to match currently observed mean sea level in Florida Bay over the period 2008–2015 shown in figure 2 and tabulated in appendix 1. These projections do not include tides or storm surges. Water levels will be both higher and lower than mean sea level depending on the tidal, weather, and storm conditions.
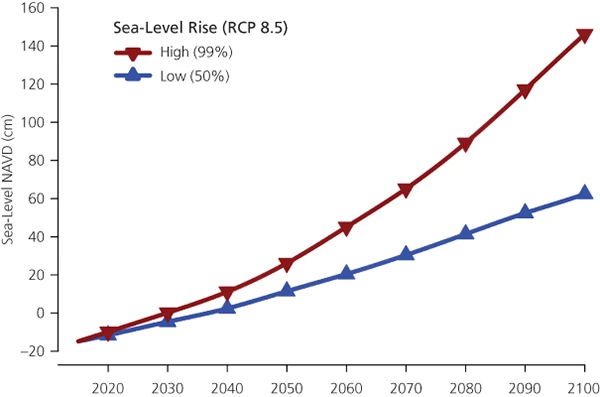
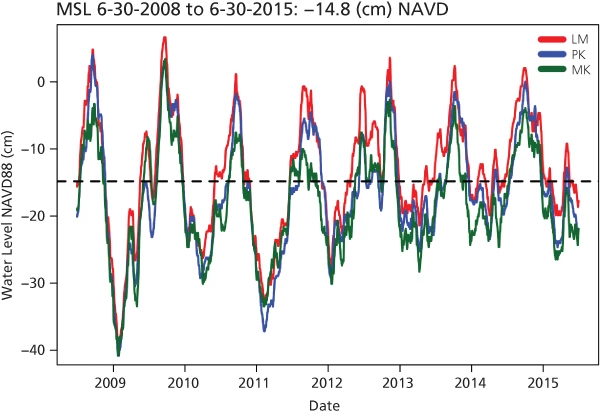
Table 1A. Sea-level rise projection: NAVD88 (cm) |
|||||||||||
| Year | Low | High | Year | Low | High | Year | Low | High | Year | Low | High |
|---|---|---|---|---|---|---|---|---|---|---|---|
| 2015 | −14.8 | −14.8 | 2045 | 6.8 | 18 | 2075 | 35.8 | 76.6 | 2105 | 68.3 | 159.9 |
| 2016 | −14.2 | −13.8 | 2046 | 7.7 | 19.6 | 2076 | 36.9 | 79 | 2106 | 69.5 | 162.7 |
| 2017 | −13.6 | −12.8 | 2047 | 8.6 | 21.1 | 2077 | 38 | 81.5 | 2107 | 70.8 | 165.4 |
| 2018 | −12.9 | −11.8 | 2048 | 9.6 | 22.8 | 2078 | 39.2 | 84 | 2108 | 72 | 168.3 |
| 2019 | −12.3 | −10.8 | 2049 | 10.5 | 24.4 | 2079 | 40.3 | 86.5 | 2109 | 73.2 | 171.2 |
| 2020 | −11.6 | −9.8 | 2050 | 11.4 | 26.2 | 2080 | 41.4 | 89.2 | 2110 | 74.4 | 174.2 |
| 2021 | −10.9 | −8.9 | 2051 | 12.3 | 27.9 | 2081 | 42.6 | 91.8 | 2111 | 75.6 | 177.2 |
| 2022 | −10.2 | −7.9 | 2052 | 13.2 | 29.7 | 2082 | 43.7 | 94.5 | 2112 | 76.7 | 180.3 |
| 2023 | −9.5 | −6.9 | 2053 | 14.1 | 31.6 | 2083 | 44.8 | 97.2 | 2113 | 77.9 | 183.5 |
| 2024 | −8.8 | −5.9 | 2054 | 15 | 33.5 | 2084 | 45.9 | 100 | 2114 | 79 | 186.8 |
| 2025 | −8.1 | −4.9 | 2055 | 15.9 | 35.4 | 2085 | 47.1 | 102.8 | 2115 | 80.1 | 190.1 |
| 2026 | −7.4 | −3.9 | 2056 | 16.8 | 37.3 | 2086 | 48.2 | 105.6 | 2116 | 81.2 | 193.4 |
| 2027 | −6.7 | −2.9 | 2057 | 17.7 | 39.3 | 2087 | 49.3 | 108.5 | 2117 | 82.2 | 196.8 |
| 2028 | −6 | −1.9 | 2058 | 18.6 | 41.2 | 2088 | 50.3 | 111.3 | 2118 | 83.3 | 200.2 |
| 2029 | −5.3 | −0.9 | 2059 | 19.5 | 43.2 | 2089 | 51.4 | 114.2 | 2119 | 84.4 | 203.7 |
| 2030 | −4.6 | 0.2 | 2060 | 20.4 | 45.2 | 2090 | 52.4 | 117.2 | 2120 | 85.4 | 207.2 |
| 2031 | −3.9 | 1.2 | 2061 | 21.4 | 47.1 | 2091 | 53.4 | 120.1 | |||
| 2032 | −3.2 | 2.2 | 2062 | 22.3 | 49 | 2092 | 54.4 | 123 | |||
| 2033 | −2.6 | 3.2 | 2063 | 23.3 | 51 | 2093 | 55.4 | 125.9 | |||
| 2034 | −1.9 | 4.3 | 2064 | 24.3 | 52.9 | 2094 | 56.3 | 128.9 | |||
| 2035 | −1.2 | 5.3 | 2065 | 25.3 | 54.9 | 2095 | 57.3 | 131.8 | |||
| 2036 | −0.5 | 6.4 | 2066 | 26.3 | 56.9 | 2096 | 58.3 | 134.7 | |||
| 2037 | 0.2 | 7.6 | 2067 | 27.3 | 58.9 | 2097 | 59.3 | 137.6 | |||
| 2038 | 0.9 | 8.7 | 2068 | 28.3 | 60.9 | 2098 | 60.3 | 140.5 | |||
| 2039 | 1.6 | 9.9 | 2069 | 29.4 | 63 | 2099 | 61.3 | 143.3 | |||
| 2040 | 2.4 | 11.2 | 2070 | 30.4 | 65.2 | 2100 | 62.4 | 146.2 | |||
| 2041 | 3.2 | 12.4 | 2071 | 31.5 | 67.3 | 2101 | 63.5 | 148.9 | |||
| 2042 | 4.1 | 13.8 | 2072 | 32.6 | 69.6 | 2102 | 64.7 | 151.7 | |||
| 2043 | 5 | 15.1 | 2073 | 33.6 | 71.8 | 2103 | 65.9 | 154.4 | |||
| 2044 | 5.9 | 16.6 | 2074 | 34.7 | 74.2 | 2104 | 67.1 | 157.1 | |||
| Notes: Sea-level rise in centimeters NAVD88 from Kopp et al. (2014) at Vaca Key, Florida. Values between decades (e.g., 2010, 2020) have been interpolated with a third-order polynomial fit. Low is the 50th percentile of the RCP 8.5 projection, high the 99th percentile. An offset of 1.4 cm (0.6 in) has been added to account for sea-level rise from 1992 to 2000 to convert the Kopp projections starting in 2000 to the NTDE MSL datum of 1992. The NAVD88 datum is 25.3 cm (10.0 in) above the NTDE MSL so that 25.3 cm has been subtracted to convert NTDE MSL to NAVD88. The projections have been offset to match observed mean sea level over the period 2008–2015 in Florida Bay of −14.8 cm (−5.8 in) NAVD88 (see appendix 1). | |||||||||||
Table 1B. Sea level rise projection: NAVD88 (ft) |
|||||||||||
| Year | Low | High | Year | Low | High | Year | Low | High | Year | Low | High |
|---|---|---|---|---|---|---|---|---|---|---|---|
| 2015 | −0.49 | −0.49 | 2045 | 0.22 | 0.59 | 2075 | 1.17 | 2.51 | 2105 | 2.24 | 5.25 |
| 2016 | −0.47 | −0.45 | 2046 | 0.25 | 0.64 | 2076 | 1.21 | 2.59 | 2106 | 2.28 | 5.34 |
| 2017 | −0.45 | −0.42 | 2047 | 0.28 | 0.69 | 2077 | 1.25 | 2.67 | 2107 | 2.32 | 5.43 |
| 2018 | −0.42 | −0.39 | 2048 | 0.31 | 0.75 | 2078 | 1.29 | 2.76 | 2108 | 2.36 | 5.52 |
| 2019 | −0.40 | −0.35 | 2049 | 0.34 | 0.80 | 2079 | 1.32 | 2.84 | 2109 | 2.40 | 5.62 |
| 2020 | −0.38 | −0.32 | 2050 | 0.37 | 0.86 | 2080 | 1.36 | 2.93 | 2110 | 2.44 | 5.72 |
| 2021 | −0.36 | −0.29 | 2051 | 0.40 | 0.92 | 2081 | 1.40 | 3.01 | 2111 | 2.48 | 5.81 |
| 2022 | −0.33 | −0.26 | 2052 | 0.43 | 0.97 | 2082 | 1.43 | 3.10 | 2112 | 2.52 | 5.92 |
| 2023 | −0.31 | −0.23 | 2053 | 0.46 | 1.04 | 2083 | 1.47 | 3.19 | 2113 | 2.56 | 6.02 |
| 2024 | −0.29 | −0.19 | 2054 | 0.49 | 1.10 | 2084 | 1.51 | 3.28 | 2114 | 2.59 | 6.13 |
| 2025 | −0.27 | −0.16 | 2055 | 0.52 | 1.16 | 2085 | 1.55 | 3.37 | 2115 | 2.63 | 6.24 |
| 2026 | −0.24 | −0.13 | 2056 | 0.55 | 1.22 | 2086 | 1.58 | 3.46 | 2116 | 2.66 | 6.35 |
| 2027 | −0.22 | −0.10 | 2057 | 0.58 | 1.29 | 2087 | 1.62 | 3.56 | 2117 | 2.70 | 6.46 |
| 2028 | −0.20 | −0.06 | 2058 | 0.61 | 1.35 | 2088 | 1.65 | 3.65 | 2118 | 2.73 | 6.57 |
| 2029 | −0.17 | −0.03 | 2059 | 0.64 | 1.42 | 2089 | 1.69 | 3.75 | 2119 | 2.77 | 6.68 |
| 2030 | −0.15 | 0.01 | 2060 | 0.67 | 1.48 | 2090 | 1.72 | 3.85 | 2120 | 2.80 | 6.80 |
| 2031 | −0.13 | 0.04 | 2061 | 0.70 | 1.55 | 2091 | 1.75 | 3.94 | |||
| 2032 | −0.10 | 0.07 | 2062 | 0.73 | 1.61 | 2092 | 1.78 | 4.04 | |||
| 2033 | −0.09 | 0.10 | 2063 | 0.76 | 1.67 | 2093 | 1.82 | 4.13 | |||
| 2034 | −0.06 | 0.14 | 2064 | 0.80 | 1.74 | 2094 | 1.85 | 4.23 | |||
| 2035 | −0.04 | 0.17 | 2065 | 0.83 | 1.80 | 2095 | 1.88 | 4.32 | |||
| 2036 | −0.02 | 0.21 | 2066 | 0.86 | 1.87 | 2096 | 1.91 | 4.42 | |||
| 2037 | 0.01 | 0.25 | 2067 | 0.90 | 1.93 | 2097 | 1.95 | 4.51 | |||
| 2038 | 0.03 | 0.29 | 2068 | 0.93 | 2.00 | 2098 | 1.98 | 4.61 | |||
| 2039 | 0.05 | 0.32 | 2069 | 0.96 | 2.07 | 2099 | 2.01 | 4.70 | |||
| 2040 | 0.08 | 0.37 | 2070 | 1.00 | 2.14 | 2100 | 2.05 | 4.80 | |||
| 2041 | 0.10 | 0.41 | 2071 | 1.03 | 2.21 | 2101 | 2.08 | 4.89 | |||
| 2042 | 0.13 | 0.45 | 2072 | 1.07 | 2.28 | 2102 | 2.12 | 4.98 | |||
| 2043 | 0.16 | 0.50 | 2073 | 1.10 | 2.36 | 2103 | 2.16 | 5.07 | |||
| 2044 | 0.19 | 0.54 | 2074 | 1.14 | 2.43 | 2104 | 2.20 | 5.15 | |||
| Notes: Sea-level rise in feet NAVD88 from Kopp et al. (2014) at Vaca Key, Florida. Values between decades (e.g., 2010, 2020) have been interpolated with a third-order polynomial fit. Low is the 50th percentile of the RCP 8.5 projection, high the 99th percentile. An offset of 0.55 inch (1.40 cm) has been added to account for sea-level rise from 1992 to 2000 to convert the Kopp projections starting in 2000 to the NTDE MSL datum of 1992. The NAVD88 datum is 0.83 feet (0.25 m) above the NTDE MSL so that 0.83 feet has been subtracted to convert NTDE MSL to NAVD88. The projections have been offset to match observed mean sea level over the period 2008–2015 in Florida Bay of −0.49 feet (−0.15 m) NAVD88 (see appendix 1). | |||||||||||
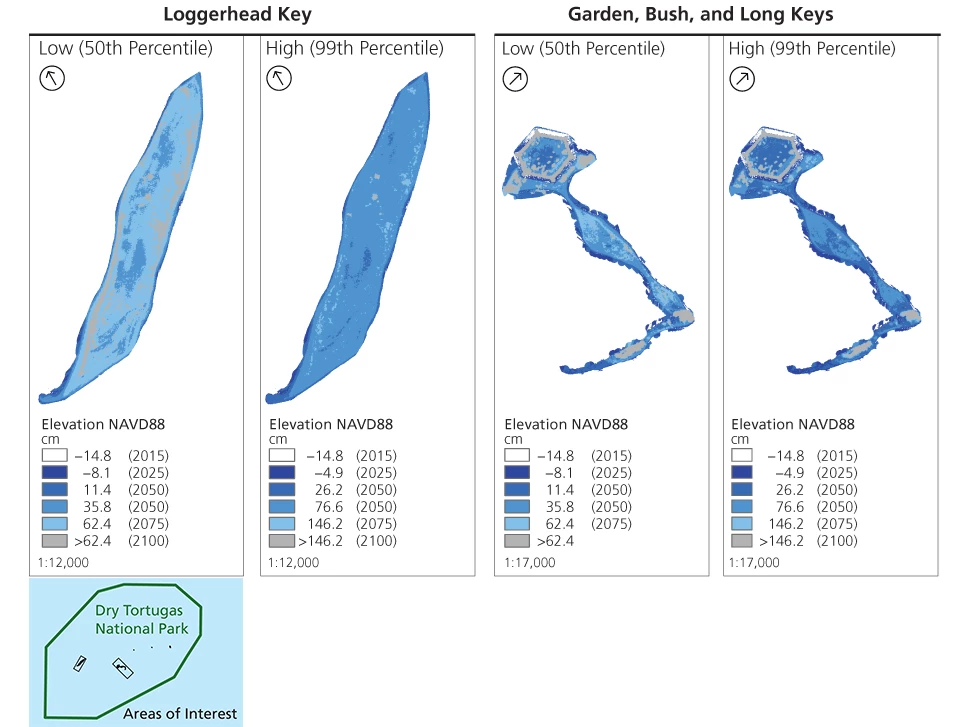
Hypsographic maps
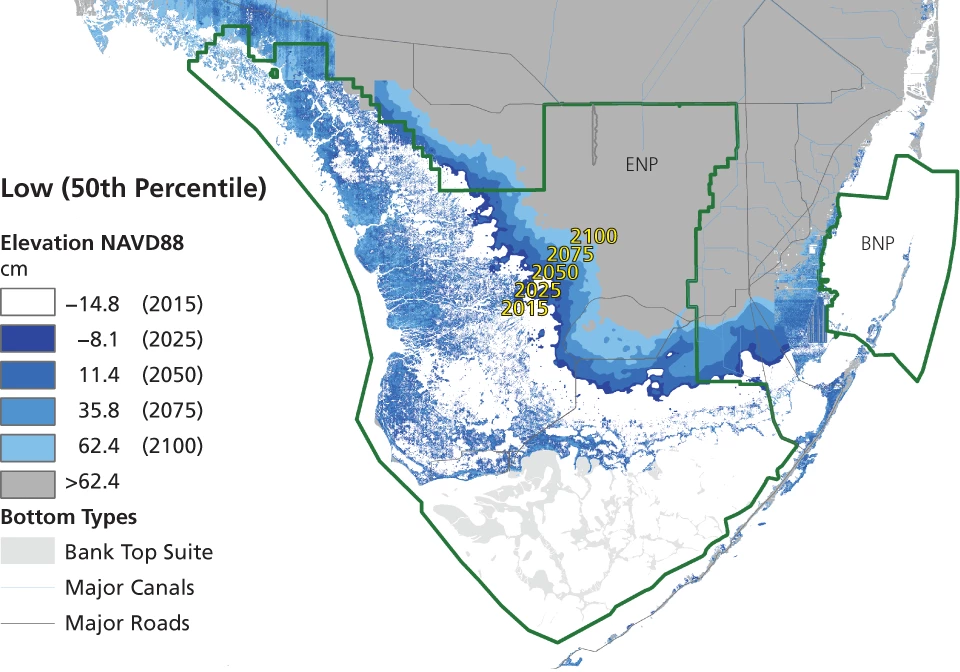
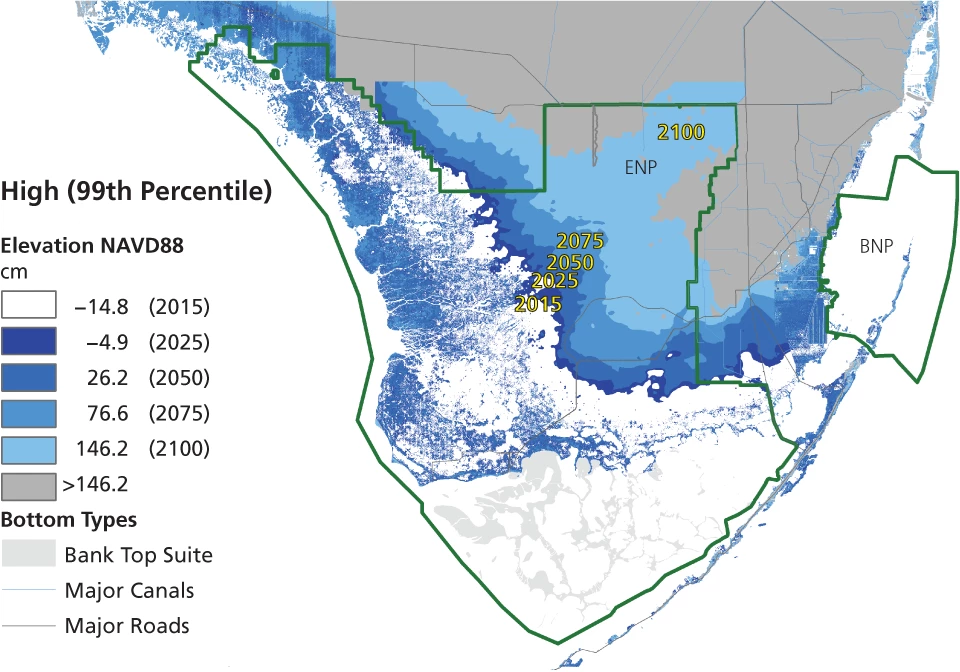
The impact of sea-level rise on a landscape is largely controlled by topography. In southwestern Florida, Everglades National Park contains a broad, flat, freshwater slough (Shark River Slough) that connects to the coastal ocean by rivers along the west coast, and by small passes through a slightly elevated marl ridge on the southern coast. Directly south of this coastal ridge is Florida Bay, a basin formed approximately 4,000 years ago as rising sea level flooded the region. In southeastern Florida, Biscayne National Park contains a mangrove fringe bordered by canals and developed properties, and islands within the park are typically less than 2 m (6.6 ft) above sea level. Not far away are the low-lying islands of Dry Tortugas National Park, located about 113 km (70 mi) west of Key West. Each of these areas will be affected by sea-level rise in different ways as shown in figures 3 and 4, which are water-level elevation maps based on the sea-level rise projections through 2100 overlaid on a digital elevation model of the region (Fennema et al. 2013). These projections do not include tides or storm surge and are available online at http://nps.maps.arcgis.com (Alarcón 2016).
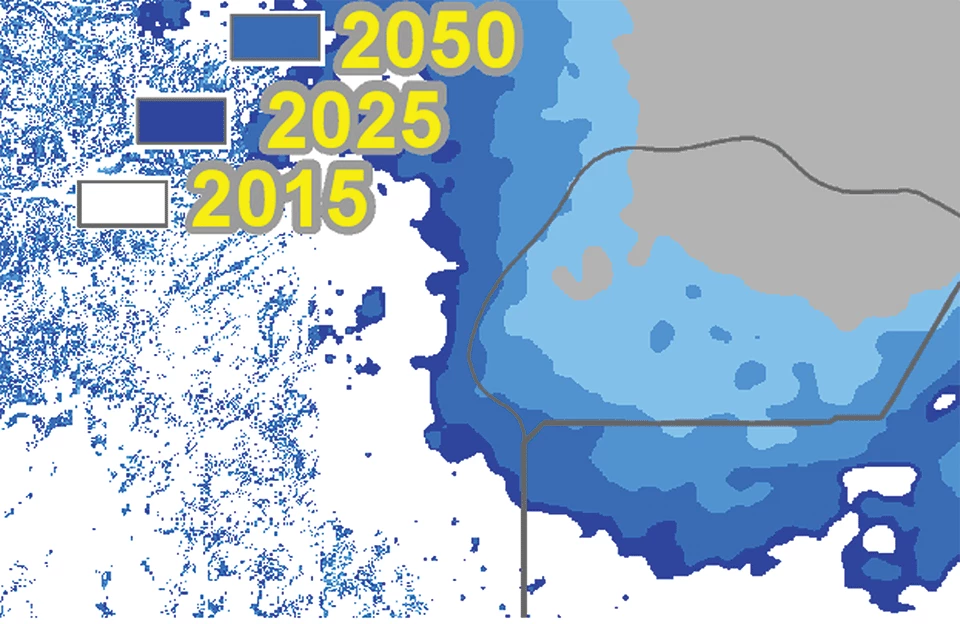
Comparison of 50th and 99th percentile sea-level rise projections
Left image
Credit: NPS/Everglades National Park
Right image
Credit: NPS/Everglades National Park
NPS
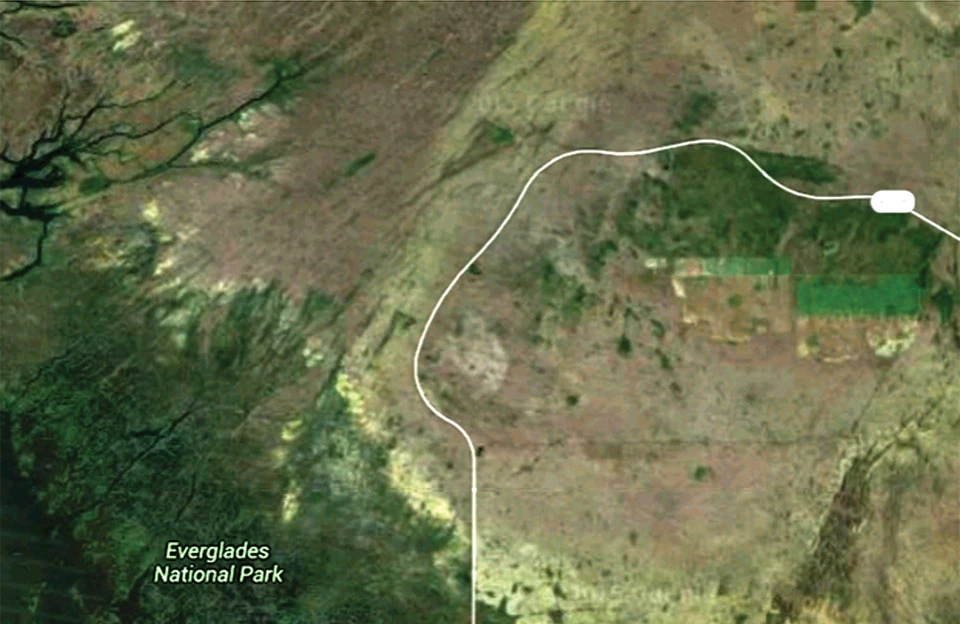
As previously noted, the projections are adjusted to match mean sea level in Florida Bay over the period 2008–2015 (−14.8 cm NAVD88), which is represented in the maps with a white color level. This could be misleading since it indicates that southern Everglades National Park is currently at mean sea level and possibly inundated with seawater. However, these regions are freshwater marsh and freshwater to salt-tolerant transition zones. It is important to realize there is a dynamic equilibrium between freshwater flowing from the Everglades and the sea, and with sufficient freshwater elevation the seawater is effectively kept at bay. Another important factor is the buttonwood and mangrove ridge defining the boundary between Florida Bay and freshwater marsh that serves as a hydraulic barrier allowing the freshwater to maintain elevations above mean sea level, thus limiting saltwater intrusion. This ridge will eventually be permanently inundated, allowing seawater to flow freely inland, but even then as Florida Bay expands, freshwater flowing downstream will serve to mitigate the extent of saltwater intrusion. As a result, mean sea-level elevations on the maps may not correspond to a marine environment. For example, figure 5 compares the current and projected sea-level elevations at the 50th percentile with an aerial photograph of the region near the Ingraham Highway in Everglades National Park. Although the current mean sea-level elevation dominates the lower portion of the region, this is not a marine environment but a transition zone between mangroves and freshwater marsh.
Comparison of sea-level elevations—map and aerial photo
Left image
Credit: NPS/Everglades National Park
Right image
Credit: NPS/Everglades National Park
Influences of sea-level rise
Over the next 10 years, represented by the 2025 estimates, dramatic change in sea level is not anticipated. The expected sea-level rise is 7 cm (3 in) for the low scenario and 10 cm (4 in) for the high projection. These changes will result in more frequent tidal inundation along coastal regions; however, the buttonwood ridge located along the north shore of Florida Bay will remain above sea level. This modest increase is not likely to have an impact on the terrestrial portions of Dry Tortugas or Biscayne National Parks; however, the increased sea level will likely reduce freshwater flow from the Biscayne Bay coastal wetlands into Biscayne National Park.
By 2050 sea level is expected to increase between 26 and 41 cm (10 to 16 in). The effect on Shark Slough is similar for both projections with an increase in perennially inundated areas. It is difficult to project ecological impacts here since the amount of freshwater exerts important influence over the ecological response. Taylor Slough appears to experience significant impact under both scenarios with increasing pressure from sea level advancing up the slough perhaps as far as the Old Ingraham Highway. The eastern panhandle of the park is more heavily impacted by the high estimate than the low estimate simply because the high estimate exceeds the land surface elevation in this area and begins to overtop the buttonwood ridge.
By 2075 sea-level elevations are expected to increase by 51 and 91 cm (20 and 36 in) for the low and high projections, respectively. Assuming that the buttonwood ridge does not increase in elevation from accretion or deposition, it appears that sometime between 2050 and 2075 much of the buttonwood ridge will be permanently inundated. This could signal an important tipping point in the ecological response of freshwater marshes since freshwater basins delineated by the ridge will no longer be viable. It appears likely that these impacts will extend to the Ingraham Highway.
By 2100 the projected sea-level rise is 77 cm (30 in) for the low projection and 161 cm (63 in) for the high scenario. It is likely that widespread ecological changes will be evident around the coastal Everglades as Florida Bay expands. In the case of the low-lying islands of Biscayne and Dry Tortugas National Parks, many of these can be expected to become submerged.
One important caveat is that these inundation projections do not account for land elevation changes, either positive or negative, as may be observed as water level and salinity change over time. It is well understood that increased freshwater flow, as expected with Everglades restoration efforts, will help to protect against freshwater peat collapse by maintaining soil elevation and reducing the extent of saltwater intrusion (NRC 2014).
Park infrastructure
In addition to natural system ecological changes as sea level rises, visitor facilities and park infrastructure will also accrue impacts. For example, figure 6 presents application of the two sea-level rise scenarios to the Everglades National Park main entrance and Ernest F. Coe Visitor Center. These are comparisons of projected mean sea level with the best available land elevations surrounding the infrastructure and do not represent the actual finished floor elevations of the structures, which are likely higher than the surrounding land elevation. It is also important to note that mean sea level in Florida Bay fluctuates by approximately 30–40 cm in a yearly oceanographic cycle, as well as monthly and daily cycles from tides, so that effects of tidal inundation will be observed before the projected dates when mean sea level reaches a specific land elevation.
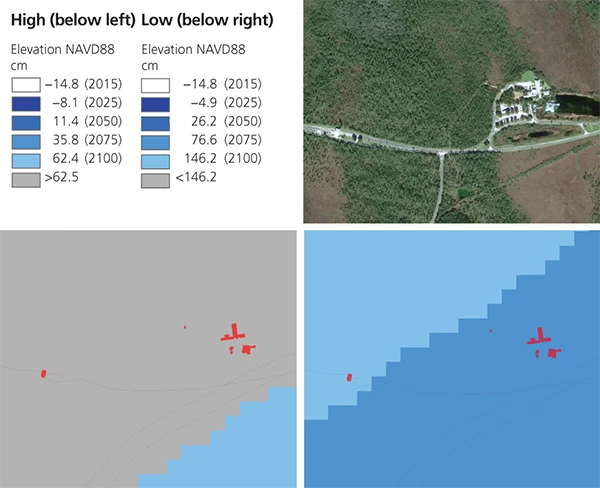
NPS/Everglades National Park
While some Everglades infrastructure such as the Ernest F. Coe Visitor Center, main park entrance, and Daniel Beard and Robertson Centers are projected to be unaffected by the low sea-level rise scenario out to 2100, all of these locations would be tidally inundated under the high sea-level rise projection at horizons from 2075 to 2100. Everglades central receiving, the Royal Palm Visitor Center, and the Nike missile silos are expected to be at mean sea level by 2100 under the low projection and by 2075 under the high scenario. Conditions at Flamingo are mixed, with the low projection forecasting the housing and visitor center to remain above mean sea level out to 2100, but with the boat basin, maintenance yard, and water plant reaching mean sea level by 2100. Under the high projection the housing area is at mean sea level by 2100, the visitor center will be partially inundated by 2050, and the maintenance yard and water plant will be tidally inundated by 2075.
At Dry Tortugas National Park the projections indicate that as early as 2075 or as late as 2100 Loggerhead Key will be tidally submerged. At Fort Jefferson the north coal docks and campground remain above mean sea level to 2100 while areas around the ferry dock and the isthmus to Bush and Long Keys are expected to be at mean sea level by 2075 under the low sea-level rise projection. Under the high projection much of the north coal dock and campground will be at mean sea level by 2075, as will much of the land between the ferry dock and moat, although a portion of this will be at sea level by 2050. The isthmus to Bush Key will be at mean sea level by 2050.
Florida Current
These mean sea-level estimates represent the contemporary state of the art in local sea-level rise projection. However, knowledge of all processes and feedbacks driving sea levels is limited, and the models on which these projections are based are necessarily incomplete. The models do not have the spatial resolution required to resolve significant fine-scale oceanographic processes such as variability in the Florida Current. The Florida Current is one of the strongest and most climatically important ocean currents and forms the headwater of the Gulfstream (Gyory et al. 1992). As the Florida Current fluctuates in intensity, sea levels along the Atlantic coast of Florida respond by falling when the current increases, and rising when current decreases (Montgomery 1938).
The Gulfstream and Florida Current are components of the Atlantic meridional overturning circulation (AMOC), a component of the global ocean conveyor belt. Climate models agree that as the ocean warms and fresh meltwater is added, there will be a decline in the strength of the AMOC (Rahmstorf et al. 2015). If the Florida Current decreases in strength, then sea levels will rise along the Florida east coast and in Florida Bay, which is the southernmost extent of Everglades National Park. The extent of this change is difficult to forecast, but recent evidence suggests that a 10% decline in transport has contributed 60% of the roughly 7 cm (2.8 in) increase in sea level at Vaca Key over the last decade (Park and Sweet 2015). It is therefore plausible that a drastic slowdown of the AMOC and Florida Current could contribute an additional 10–15 cm (3.9–5.9 in) of sea-level rise to South Florida over this century. This potential is not reflected in the sea-level rise projections, but should be acknowledged by authorities and planners who use them.
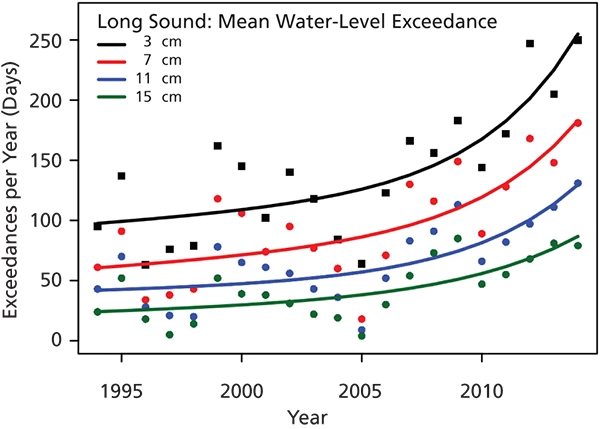
Inundation and nuisance (recurrent) flooding
Sea-level rise is slow and difficult to discern when compared to the dynamic impacts of changing seasons and storms. Though a drastic change in sea level requires centuries or millennia, pronounced changes in the frequency and heights of coastal inundation along low-lying coastlines can occur in decades, and such changes are now evident around the United States over the last few decades as sea levels rise (Sweet and Park 2014). For example, the number of daily water-level exceedances per year above the 1993–2011 mean water level in Long Sound of Florida Bay within Everglades National Park is shown in figure 7. The curves show best-fit models based on general linear and geometric growth, suggesting that in the last decade the frequency of low-level inundations has transitioned from a slow, steady increase to one of escalating occurrences. These changes are a consequence of sea-level rise transitioning high water-level exceedances from low-chance events to common events, and this change is accelerating.
NPS/Everglades National Park
Infrequent high-impact flooding (storm surge)
Although sea-level rise and the associated increases in recurrent flooding are important physical stresses on South Florida natural areas, it is the infrequent but high-impact storm surge events that drastically change the landscape over the course of a few hours. For example, Hurricane Wilma in 2005 had a profound impact on the ecology of the Cape Sable region of Everglades National Park (Smith et al. 2009; Whelan et al. 2009), producing extensive damage at the Flamingo Visitor Center and permanently closing the Flamingo Lodge and Buttonwood Cafe.
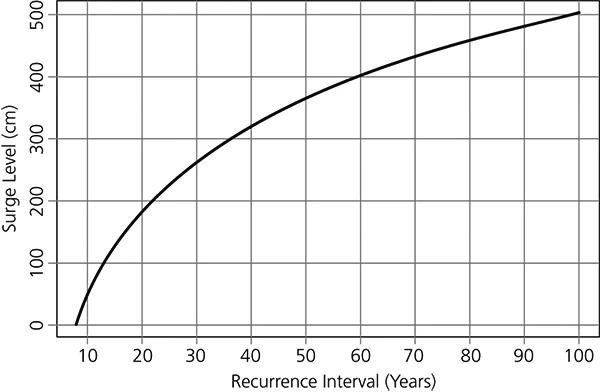
Storm surge is highly dependent on the severity and path of the storm, as well as the local bathymetric and topographic features of the coast, and since it occurs infrequently it is difficult to develop robust predictions of these rare events. A popular approach is to fit an extreme-value probability distribution to the highest water levels observed at a water-level monitoring gauge. However, gauges have short periods of record, typically a few decades at most, and they fail or are destroyed during extreme storms such that peak water levels are not recorded. A predictive storm surge database, SurgeDat, was developed in part to address this shortcoming by providing a statistical combination of data from multiple events in an area of interest (Needham et al. 2013). SurgeDat records storm surge water levels from all available sources, often from post-event high-water marks where gauge data are not available. SurgeDat then applies a statistical regression to estimate storm surge recurrence intervals. A recurrence interval is the length of time over which one can expect a storm surge to meet or exceed a specific inundation level. A familiar example is the 100-year flood level, which is really a 100-year recurrence interval at the specified flood level. In other words, in any one year there is a 1/100 or 1% chance that the flood level will be matched or exceeded. An excellent discussion of this can be found at the following US Geological Survey webpage: https://water.usgs.gov/edu/100yearflood.html.
Relevant to South Florida, a subset of SurgeDat was selected within a 40 km (25 mi) radius of 25.2° N, 80.7° as listed in table 2. Based on these events, the SurgeDat projection for storm surge recurrence intervals shown in figure 8 and table 3 suggests that a 180 cm (6 ft) surge event can be expected every 20 years. This same level of sea-level rise is not expected to occur until at least 2100.
Table 2. Hurricane storm surge inundation observations around Florida Bay from the SurgeDat database |
||||||
| Storm | Year | Longitude | Latitude | Surge (m) | Datum | Location |
|---|---|---|---|---|---|---|
| Katrina | 2005 | −81.0369 | 25.1294 | 1.22 | Extreme SW Florida | |
| Inez | 1966 | −80.5297 | 24.9976 | 1.10 | Above Normal | Plantation Key |
| Alma | 1966 | −80.5135 | 25.0110 | 0.30 | Above Normal | Tavernier |
| Gordon | 1994 | −80.5139 | 25.0108 | 1.22 | Above Sea Level | Upper Florida Keys |
| Betsy | 1965 | −80.5148 | 25.0096 | 2.35 | Mean Low Water | Tavernier |
| Donna | 1960 | −80.6353 | 24.9133 | 4.11 | Upper Matecumbe Key | |
| Andrew | 1992 | −80.9120 | 25.1431 | 1.50 | Flamingo | |
| Rita | 2005 | −80.7200 | 24.8605 | 1.22 | NGVD 29 | Middle and Upper Keys |
| Unnamed | 1929 | −80.3885 | 25.1848 | 2.68 | Mean Sea Level | Key Largo |
| Wilma | 2005 | −81.0352 | 25.3523 | 2.50 | Shark River 3 | |
| Gladys | 1968 | −80.5135 | 25.0110 | 0.15 | Above Normal | Tavernier |
| David | 1979 | −80.6263 | 24.9231 | 0.61 | Above Normal | Islamorada |
| Labor Day | 1935 | −80.7375 | 24.8516 | 5.49 | Lower Matecumbe, Ferry Slip, Camp 3 | |
| Notes: Storm surge heights from these events are fit to a water-level exceedance and recurrence interval model to predict expected storm surge heights near Florida Bay with results shown in figure 8 and listed in table 3. | ||||||
NPS/Everglades National Park
Table 3. Storm surge height recurrence intervals |
|||
| Interval (year) | Surge (cm) | Interval (year) | Surge (cm) |
|---|---|---|---|
| 10 | 45 | 56 | 388 |
| 12 | 82 | 58 | 395 |
| 14 | 112 | 60 | 402 |
| 16 | 139 | 62 | 408 |
| 18 | 162 | 64 | 415 |
| 20 | 183 | 66 | 421 |
| 22 | 202 | 68 | 427 |
| 24 | 219 | 70 | 433 |
| 26 | 235 | 72 | 438 |
| 28 | 250 | 74 | 444 |
| 30 | 264 | 76 | 449 |
| 32 | 277 | 78 | 454 |
| 34 | 289 | 80 | 459 |
| 36 | 300 | 82 | 464 |
| 38 | 311 | 84 | 469 |
| 40 | 321 | 86 | 473 |
| 42 | 331 | 88 | 478 |
| 44 | 340 | 90 | 482 |
| 46 | 349 | 92 | 487 |
| 48 | 357 | 94 | 491 |
| 50 | 365 | 96 | 495 |
| 52 | 373 | 98 | 499 |
| 54 | 381 | 100 | 503 |
| Note: Recurrence interval projection in years shown in figure 8 from the hurricane data in table 2. The interval is the expected number of years one would wait for the associated hurricane storm surge to occur at least once. Note that this projection does not take into account future sea-level rise. | |||
The recurrence interval projection is by necessity based on a sparse data set, and caution should be used in its interpretation. As projection intervals become longer, it is more likely that the observed data are inadequate to robustly represent all possibilities. Also, these projections do not incorporate changes from sea-level rise, or from a changing climate, which can alter the strength and frequency of storms. An important aspect of sea-level rise is that it significantly shortens the expected recurrence intervals of storm surge. For example, under a median sea-level rise projection at Key West, Park et al. (2011) find that a 1-in-50-year storm surge based on historical data in 2010 can be expected to occur once every five years by 2060.
Conclusion
Sea-level rise is one of the most robust indicators of climate change and a warming planet. The national parks of South Florida are intimately tied to the ocean, and are already experiencing physical and ecological changes in response to sea-level rise. Based on a review of the available science, we have developed a projection to inform park interests on sea-level rise and inundation, trends in the frequency of nuisance flooding, and recurrence intervals of storm surge. The sea-level rise projections are based on the RCP 8.5 emissions scenario published by the ICPP AR5, as this scenario is deemed the most likely given the current inability of the global industrial complex to realistically pursue emission reductions. Two estimates are provided that bracket the expected range of sea-level rise. The low projection is the 50th percentile (median) forecast, while the high projection is intended for worst-case planning and corresponds to the 99th percentile with only a 1% chance of occurring. However, these projections do not incorporate contributions from a collapse of Antarctic ice sheets, changes in the Florida Current, or inundation due to tides or storms. Although the high projection is deemed to have only a 1% chance of occurrence under current conditions, a collapse of the Antarctic ice sheets could render it more plausible. Regardless of the specific sea-level rise projection, Everglades restoration with increased freshwater flow into the Everglades will serve to mitigate the impacts of sea-level rise over the next century.
Management actions in natural coastal systems will necessarily be location and project specific. An appropriate planning horizon is a crucial component of managerial design since benefits observed today may be offset by changing conditions within the planned lifespan of the project. Updates to the climate projections presented here are almost certain to occur and adaptive management practices should be incorporated when considering project alternatives, and, when appropriate, preference given to solutions that are flexible and can be adjusted as our understanding of current and expected impacts changes. These practices should be institutionalized as part of the ongoing monitoring and assessment process, incorporated into our education and outreach efforts, and used to best manage the influence of climate change on park resources.
Acknowledgments
The authors would like to thank Caryl Alarcón for GIS support. This work is a product of the South Florida Natural Resources Center, which is administered for the National Park Service by Everglades National Park.
References
Alarcón, C. 2016. Sea level rise projections for South Florida, 50th and 99th percentiles. 99th percentile: http://nps.maps.arcgis.com/home/webmap/viewer.html?layers=b61db3e154104ea486528c031390066c; 50th percentile: http://nps.maps.arcgis.com/home/webmap/viewer.html?layers=87e87e094680431eab085a18adb36836.
Cazenave, A., and G. Le Cozannet. 2014. Sea level rise and its coastal impacts. Earth’s Future 2(2):15–34. doi:10.1002/2013EF000188.
Center for Operational Oceanographic Products and Services. 2000. Tidal datums and their applications. Special Publication NOS CO-OPS 1. National Oceanic and Atmospheric Administration, National Ocean Service Center for Operational Oceanographic Products and Services, Silver Spring, Maryland, USA. http://tidesandcurrents.noaa.gov/publications/tidal_datums_and_their_applications.pdf.
———. 2013. Tidal datums. National Oceanic and Atmospheric Administration, National Ocean Service Center for Operational Oceanographic Products and Services, Silver Spring, Maryland, USA. http://tidesandcurrents.noaa.gov/datum_options.html.
DeConto, R. M., and D. Pollard. 2016. Contribution of Antarctica to past and future sea-level rise. Nature 531(7596):591–597. doi:10.1038/nature17145.
Fennema, R., L. Pearlstine, and J. Parsons. 2013. EVER Elevation (version 1): A multi-sourced digital elevation model for Everglades National Park. Report. South Florida Natural Resources Center, Everglades National Park, Homestead, Florida, USA.
Gyory, J., E. Rowe, A. Mariano, and E. Ryan. 1992. The Florida Current. Gulf of Mexico Research Initiative, Consortium for Advanced Research on Transport of Hydrocarbon in the Environment, and Rosenstiel School of Marine and Atmospheric Science; University of Miami, Florida, USA. http://oceancurrents.rsmas.miami.edu/atlantic/florida.html.
Holland, P. R., A. Brisbourne, H. F. J. Corr, D. McGrath, K. Purdon, J. Paden, H. A. Fricker, F. S. Paolo, and A. H. Fleming. 2015. Oceanic and atmospheric forcing of Larsen C Ice-Shelf thinning. The Cryosphere 9:1005–1024. doi:10.5194/tc-9-1005-2015.
Intergovernmental Panel on Climate Change (IPCC). 2013. Climate change 2013: The physical science basis. Contribution of Working Group I to the Fifth Assessment Report of the Intergovernmental Panel on Climate Change. T. F. Stocker, D. Qin, G.-K. Plattner, M. Tignor, S. K. Allen, J. Boschung, A. Nauels, Y. Xia, V. Bex, and P. M. Midgley, editors. Cambridge University Press, Cambridge, UK, and New York, USA.
Jones, G. A., and K. J. Warner. 2016. The 21st century population-energy-climate nexus. Energy Policy 93:206–212. doi:10.1016/j.enpol.2016.02.044.
Kopp, R. W., R. M. Horton, C. M. Little, J. X. Mitrovica, M. Oppenheimer, D. J. Rasmussen, B. H. Strauss, and C. Tebaldi. 2014. Probabilistic 21st and 22nd century sea-level projections at a global network of tide gauge sites. Earth’s Future 2(8):383–406. doi:10.1002/2014EF000239.
Krauss, K. W., A. S. From, T. W. Doyle, T. J. Doyle, and M. J. Barry. 2011. Sea-level rise and landscape change influence mangrove encroachment onto marsh in the Ten Thousand Island region of Florida, USA. Journal of Coastal Conservation 15(4):629–638. doi:10.1007/s11852-011-0153-4.
Montgomery, R. B. 1938. Fluctuations in monthly sea level on eastern U.S. coast as related to dynamics of western north Atlantic Ocean. Journal of Marine Research 1:165–185.
National Research Council (NRC). 2014. Progress toward restoring the Everglades: The fifth biennial review—2014. Committee on Independent Scientific Review of Everglades Restoration Progress, Water Science and Technology Board, Board on Environmental Studies and Toxicology; Division on Earth and Life Studies; National Research Council, Washington, DC, USA. doi:10.17226/18809.
Needham, H. F., B. D. Keim, D. Sathiaraj, and M. Shafer. 2013. A global database of tropical storm surges. EOS Transactions American Geophysical Union. 94(24):213–214. doi:10.1002/2013EO240001.
Park, J., J. Obeysekera, M. Irizarry, J. Barnes, P. Trimble, and W. Park-Said. 2011. Storm surge projections and implications for water management in South Florida. Climatic Change 107(1) (Special Issue: Sea level rise in Florida: An emerging ecological and social crisis):109–128. doi:10.1007/s10584-011-0079-8.
Park, J., and W. Sweet. 2015. Accelerated sea level rise and Florida Current transport. Ocean Science 11:607–615. doi:10.5194/os-11-607-2015.
Rahmstorf, S., J. E. Box, G. Feulner, M. E. Mann, A. Robinson, S. Rutherford, and E. J. Schaffernicht. 2015. Exceptional twentieth-century slowdown in Atlantic Ocean overturning circulation. Nature Climate Change 5:475–480. doi:10.1038/nclimate2554.
Smith, T. J., G. H. Anderson, K. Balentine, G. Tiling, G. A. Ward, and K. R. T. Whelan. 2009. Cumulative impacts of hurricanes on Florida mangrove ecosystems: Sediment deposition, storm surges, and vegetation. Wetlands 29(1):24–34. doi:10.1672/08-40.1.
Steffen, W., W. Broadgate, L. Deutsch, O. Gaffney, and C. Ludwig. 2015. The trajectory of the Anthropocene: The Great Acceleration. The Anthropocene Review 2(1):81–98. doi:10.1177/2053019614564785.
Sweet, W. V., and J. Park. 2014. From the extreme to the mean: Acceleration and tipping points of coastal inundation from sea level rise. Earth’s Future 2(12):579–600. doi:10.1002/2014EF000272.
US Army Corps of Engineers (USACE). 2014. Procedures to evaluate sea level change: Impacts, responses, and adaptation. U.S. Army Corps of Engineers, Washington, DC, USA. Technical Letter No. 1100-2-1, 30 June 2014. http://www.publications.usace.army.mil/Portals/76/Publications/EngineerTechnicalLetters/ETL_1100-2-1.pdf.
Whelan, K. R. T., T. J. Smith III, G. H. Anderson, and M. L. Ouellette. 2009. Hurricane Wilma’s impact on overall soil elevation and zones within the soil profile in a mangrove forest. Wetlands 29(1):16–23. doi:10.1672/08-125.1.
Wouters, B., A. Martin-Español, V. Helm, T. Flament, J. M. van Wessem, S. R. M. Ligtenberg, M. R. van den Broeke, and J. L. Bamber. 2015. Dynamic thinning of glaciers on the Southern Antarctic Peninsula. Science 348(6237):899–903. doi:10.1126/science.aaa5727.
About the authors
Joseph Park is a physical scientist, Erik Stabenau (e-mail us) is an oceanographer and coastal ocean modeler, and Kevin Kotun is a hydrologist. All are with the South Florida Natural Resources Center in Everglades National Park, Homestead, Florida.