Last updated: February 15, 2026
Article
Monitoring wildflower phenology using traditional science, citizen science, and crowdsourcing approaches
By Anna Wilson, Kevin Bacher, Ian Breckheimer, Jessica Lundquist, Regina Rochefort, Elli Theobald, Lou Whiteaker, and Janneke HilleRisLambers

University of Washington, Anna Wilson
Climate change is likely to have dramatic consequences for national parks and surrounding ecosystems. Monitoring important biological processes that are sensitive to climate is therefore critical to help inform management strategies allowing national parks to observe and potentially adapt to climate change impacts. The National Park Service already has significant programs in place, such as the Inventory and Monitoring Network Program (https://science.nature.nps.gov/im/monitor/) and the Climate Change Response Program (https://www.nps.gov/orgs/ccrp/index.htm), but scientists and managers continue to explore approaches for accurately and efficiently monitoring processes of interest. A spectrum of options is available depending upon resources and program goals. On the one hand, a few highly trained and credentialed experts can generate high-quality data from a small area that conform to strict data protocols—this is the “traditional” approach often taken by professional scientists. However, other approaches exist that can be more advantageous. For example, engaging visitors to aid in data collection (a citizen scientist approach) may greatly expand the volume of data collected while simultaneously fostering public understanding, investment, and support for the resulting management actions (Dickinson et al. 2012; Theobald et al. 2015). Alternatively, a large amount of information on the spatial or temporal distribution of organisms may already exist in photo databases (e.g., Hurlbert and Liang 2012; Bakkegard and Davenport 2012), which can be leveraged as a low-cost method to monitor biological processes of interest (a crowdsourcing approach).
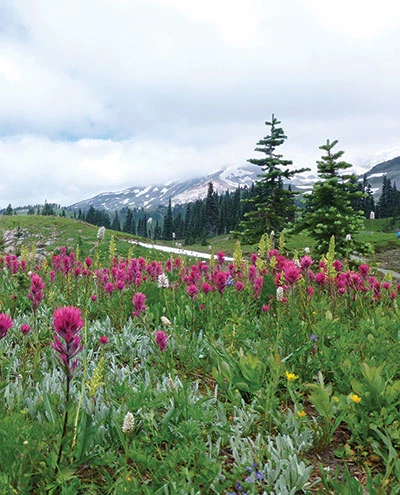
In this article, we describe these three approaches, which we have used to monitor the relationship between climate factors like the timing of seasonal snow disappearance and the timing of wildflower reproduction (“wildflower phenology”) at Mount Rainier National Park (figs. 1 and 2). Our goal is to provide a case study for national park staff and other resource managers interested in initiating wildflower phenology monitoring programs of their own. Wildflower phenology is a particularly important process to monitor, because it is strongly driven by climatic factors (fig. 1) (Fitter and Fitter 2002; Inouye 2008). This means that changes in wildflower phenology are likely to indicate ongoing biological responses to climate change (Parmesan 2006). Additionally, the timing of wildflower phenology is crucial both to the plants themselves and to the life cycle of organisms that depend on flowers, fruits, or seeds for resources (e.g., pollinators and frugivores or preferential fruit eaters). Long-term monitoring of wildflower phenology could therefore help identify the plants and animals likely to be affected significantly by climate change, especially given the possibility of phenological mismatches, where plants fall out of sync with their pollinators or consumers (e.g., McKinney et al. 2012; Robbirt et al. 2014). Wildflower meadows are also a large attraction for visitors (fig. 3); consequently, shifts in wildflower phenology could also influence national park visitor experience and visitation patterns (Buckley and Foushee 2012).

University of Washington, Natasha Lozanoff
Figure 2. Wildflower phenology is studied by documenting the seasonal progression of wildflower species through their phenophases, which involves documenting the timing of reproductive life stages like flower buds, flowers, maturing fruit, and dispersing seed. Four phenophases of white avalanche lily (Erythronium montanum) are pictured here—the four monitored by our citizen scientists. Two additional phenophases were monitored through our professional scientist approach (leaf-out and leaf senescence [leaf fall]), while our crowdsourcing approach only captured the flowering phenophase. This series of photos (as well as comparable ones for each of the 10 focal species) was included in the species identification booklet provided to MeadoWatch volunteers.
University of Washington/Janneke HilleRisLambers
Three approaches to monitoring wildflower phenology at Mount Rainier National Park
How could wildflower phenology be monitored in national parks? The timing of reproductive life stages, or phenophases, of different species is of particular interest (fig. 2). We describe the three approaches we used for estimating the timing of these wildflower phenophases at Mount Rainier National Park (fig. 4). The first is a professional scientist approach (data collected by a graduate student); the second is a citizen scientist approach (data collected by volunteers participating in our citizen science program MeadoWatch—http://www.meadowatch.org); and the third is a crowdsourcing approach with data extracted from geo-located, date-stamped photos uploaded to a photo-sharing website and database (Flickr). Each of these had trade-offs associated with balancing the data characteristics, resources required, and outreach potential, which we discuss below (summarized in table 1).

University of Washington/Ian Breckheimer
Table 1. Data characteristics, outreach opportunities, and resources needed for wildflower phenology monitoring at Mount Rainier National Park |
||||
| Category | Component | Professional Scientist | Citizen Science | Crowdsourcing |
|---|---|---|---|---|
| Data characteristics | Accuracy and complexity | Most accurate and precise data for highly complex data collection protocols | Simple to moderately complex data collection protocols with accuracy and precision depending on volunteer training | Simple data with accuracy that varies depending on technology (camera GPS accuracy) |
| Data quantity | ~1,000 site-date observations/year; 47 species, 6 phenophases | ~1,700 site-date observations/year; 10 species, 4 phenophases | ~1,000 photos/year; 8 species, 1 phenophase | |
| Site selection | Intentional, potential to access remote, hazardous, and sensitive sites | Variable, depending on volunteer capacity | Haphazard, generally near developed areas, easy access sites often visited | |
| Geographic scope | Number of sites limited by personnel, time for travel, and collection of detailed data | Variable, depending on volunteer capacity | Potential for greatest spatial coverage |
|
| Outreach | Inherent opportunities | Low: limited to interactions with the professional scientist (~1–2 weekly) | High: constrained only by the quantity of volunteers (~40–85 annually) | Low (none): dependent on whether photographers uploading photos visit the specific monitoring project website (unknown) |
| Resources required | Personnel (initiation) | Master’s or PhD level for project design (50% effort for 3 months minimum) | Master’s or PhD level for project design (50% effort for 3 months minimum) | Master’s or PhD level to extract information from databases (50% effort for 2 weeks minimum) |
| Personnel (maintenance) | Master’s or PhD level for collecting data, or to supervise and train personnel (BS level) to collect data (50–100% effort for 3 months/year) | Seasonal project manager (BS level); (50% effort for 3 months/year); volunteers willing to spend 1–3 days collecting data each summer (no salary) | Lab assistant (AS or BS level) to categorize photographs; (100% effort for 2 weeks/year); photographers willing to share photos on photo websites | |
| Personnel (training) | Extensive botany knowledge, experimental design (master’s or PhD level) | Botany knowledge, communication skills (BS level) | Programming skills (master’s or PhD level), botany knowledge (AS or BS level) | |
| Supplies | Data sheets, field guides | Species identification booklets and data sheets (one/volunteer) | None | |
| Volunteer training | None | Orientation: data collection, and species and phenophase identification |
None | |
Professional scientist approach
One of our team members (Elli Theobald, a graduate student at the University of Washington) has studied wildflower phenology at 70 sites distributed across a 1,350-foot elevation gradient (fig. 5). Permanent research sites were carefully chosen to be representative of the surrounding landscape. For four summers, Theobald visited these sites weekly, identifying the relative abundance of each of six phenophases (fig. 2). She monitored the phenology of all animal-pollinated plant species (47 species), representing the vast majority of the plant community within these sites. Each site was also instrumented with microclimate sensors, resulting in accurate estimates of snow duration at each site.

University of Washington/Betsy Parrington
The main advantage of this approach was that the data provided very detailed descriptions of the onset, duration, and peak dates of the six phenophases monitored relative to snowmelt for the majority of wildflower species in this system (fig. 6). However, there were several downsides to this approach relative to the other two. First, the geographic scope of sites we monitored was limited by the ability of one person to access them frequently while collecting data (fig. 4). Second, the collection of detailed data on such a broad suite of species and on nonflowering phenological stages required the professional scientist to have advanced, technical botany skills, particularly at the onset of the study. Third, collecting these data was relatively expensive, requiring salary for the scientist to conduct fieldwork and manage and analyze data. Fourth, the inherent outreach potential of this data collection approach was limited to chance field encounters between her and visitors during data collection.

University of Washington/Ian Breckheimer
Citizen scientist approach
In 2013, we (members of the HilleRisLambers laboratory at the University of Washington and staff at Mount Rainier National Park) founded MeadoWatch, a citizen science program that engages volunteers to collect wildflower phenology data. The program is ongoing, and data presented here are from 2013 when volunteers monitored 10 focal wildflower species at nine sites along a 3-mile (one-way) hiking trail (figs. 4 and 7). Sites cover a relatively small area of Mount Rainier National Park because all must be accessible to volunteers visiting the park for a day. We recruited citizen scientists with e-mails to organizations with like-minded phenology monitoring goals (e.g., Audubon, the Mountaineers, the Washington State Native Plant Society) and via the Mount Rainier volunteer blog, which yielded 41 volunteers participating in 2013.

University of Washington, Ella Seely
During a mandatory two-hour orientation, we provided citizen scientist volunteers with an overview of climate change impacts on plant phenology and detailed training on methods to locate our sampling sites, identify four reproductive phenophases of focal wildflower species (fig. 2), and collect data. Citizen scientist volunteers received data sheets and a booklet to bring on their hike with directions to the sites, focal wildflower species, and phenophase descriptions.
During their hike, citizen scientists recorded the presence or absence of each focal species’ phenophase at each site, and ranked the phenophases present from most abundant to least abundant (within species). As with the professional scientist approach, all sites were instrumented with microclimate sensors, allowing for accurate estimates of snow disappearance. We collected data sheets at the end of summer, and entered and analyzed the data at the University of Washington. One trained staff person (Anna Wilson) recruited and coordinated volunteers, worked closely with national park staff to arrange waivers and entrance to the park, maintained sampling sites, and managed the resulting data.
The citizen scientist approach had both advantages and disadvantages relative to the other two approaches (table 1). First, data generated by MeadoWatch citizen scientists provided greater temporal resolution (daily) on wildflower phenology than the professional scientist data (weekly). Additionally, MeadoWatch provided the greatest inherent outreach potential of the three approaches, with more than 40 members of the public engaged in the first year of data collection (increasing to more than 85 as of 2016). We assume our citizen science volunteers gained knowledge of climate change, wildflower phenology, and the scientific process (e.g., Evans et al. 2005; Jordan et al. 2011), although we did not explicitly quantify this. However, we also note drawbacks to this approach, primarily related to data characteristics. Data were not as detailed as those collected by professional scientists, a design choice motivated by our assumption and verified by surveys of our volunteers that citizen scientists may not all have the expertise necessary to identify cryptic phenophases (e.g., emerging leaves) or the time to quantify the abundance of phenophases. The spatial coverage of sites was also low relative to sites monitored with the professional scientist approach and covered by crowdsourcing approaches (fig. 3). Both factors likely contributed to estimates of wildflower phenology from the citizen science approach that were more uncertain and, in some cases, different from those estimated by professional scientists (figs. 8 and 9).

University of Washington/Ian Breckheimer
Figure 8. Flowering phenology curves for the white avalanche lily (Erythronium montanum, green) and Arctic lupine (Lupinus arcticus, purple) demonstrate that all three approaches provide largely similar estimates of flowering phenology for two species, when data quantity are sufficient. The x-axis measures days since snowmelt; the y-axis measures the probability of flowering within a plot (for professional and citizen scientist data) or the probability of appearing in a representative photo (for crowdsourced data). Solid lines represent the best estimate, while shading represents the 95% uncertainty interval. The width of the credible intervals reflects the number of years of data, number of locations, and relative information content of the data. Low sample size decreases certainty, and thus increases credible intervals for citizen science monitoring of E. montanum, sampled in just 1 year and only 2 locations. See text in “Discussion” for more detailed data comparisons. Full data sets will be made available in upcoming publications, which will be available through links on the MeadoWatch website (www.meadowatch.org).

University of Washington/Ian Breckheimer
Figure 9. Peak flowering relative to snowmelt (left panel) and flowering duration (right panel), as estimated from data collected by professional scientists (x-axis) versus data collected by citizen scientists (white circles) and data crowdsourced from geo-located, date-stamped photos (black circles) on the y-axis. Each dot represents one of the 10 (for citizen science–derived data) or eight (for crowdsourced data) wildflower species in common between the two approaches being compared. The dashed diagonal line is a 1:1 line, indicating where the citizen science and crowd sourcing estimates would lie when identical to the professional scientist estimates for the same species. Data for this analysis were from 2013, a year when all three methods were used at Mount Rainier National Park. Despite differences in parameter estimates, all three approaches provide a similar picture of the progression of flowering after snowmelt at our site, as well as relative differences among species in flowering duration. See text in “Discussion” for more detailed data comparisons.
Crowdsourcing approach
Our third approach used geo-located, date-stamped photos from a photo sharing website (Flickr, https://www.flickr.com) as observations of wildflower phenology (similar to those shown in figs. 1 and 3). A graduate student with advanced computing and quantitative skills (Ian Breckheimer) developed a computer script to extract photos taken within the Mount Rainier National Park boundary from the Flickr photo database, and this generated a data set of 4,790 photos taken over a five-year period (2009–2013). Undergraduate lab assistants (trained in species identification of commonly photographed species by Breckheimer) then determined if photos contained flowers of eight focal wildflower species (682 of the 4,790 pictures). Those without focal wildflowers were noted and used as “absences” in analyses developed by Breckheimer that standardized for photographer “effort,” which varied spatially and temporally. Focal wildflower species captured were fewer in number than those monitored both by the professional scientist and citizen scientists, and limited to those species that were frequently photographed (likely driven by their showiness and abundance). Additionally, photos only provided information on the flowering phenophase (fig. 2), since other phenophases were not frequently photographed or were difficult to identify in photos.
We found several advantages to this approach, including the low up-front costs and minimal time required to generate a multiyear data set that covered a much larger geographic area than either of the other approaches (fig. 4). For example, undergraduate lab assistants could extract information from thousands of photos taken over multiple years in much less time than that spent by the professional scientist or volunteer coordinator in just one wildflower season. However, there were also disadvantages to this approach. We had no control over where and when photos were taken, which meant that quantifying the timing of peak flowering (the day a particular species is most likely to be flowering) and how long flowering continues (i.e., flowering optima and duration; fig. 6) required relatively sophisticated statistical approaches to accommodate large variation in the distribution of photos over space and time. This also meant we could not link exact measures of snow duration from microclimate sensors to each data point as we did with professional scientist and citizen scientist generated data and so had to rely on estimates of snow disappearance date from models instead. Finally, this approach also lacked the outreach potential of MeadoWatch, since we did not interact personally with these photographers.
Discussion
The three approaches we employed for monitoring wildflower phenology provided us with a largely consistent understanding of wildflower phenology in our system (figs. 8 and 9). Specifically, all approaches captured variation among species in the timing of peak flowering relative to snowmelt as well as in flowering duration (fig. 9), providing similar species rankings (i.e., distinguishing early- from late-flowering species and short- from long-duration flowering species). However, species-specific estimates of peak flowering dates and flowering duration did vary among the three approaches (duration more than peak flowering—fig. 9). In some cases, these differences could be attributed to differences in data quantity (e.g., Erythronium montanum curves estimated from the citizen science approach—fig. 8). However, these differences (2–15 days—fig. 9) were much smaller than spatial and temporal variability in the main climatic driver of wildflower phenology, snowmelt duration (>30 days). Thus, our understanding of how the progression of flowering would vary between years and locations (within the 100-day growing season), or over time, would be similar for data generated by the three approaches. Approaches also differed in type of phenology data they generated, the resources they required, and their inherent educational potential (table 1). Some of these differences arose due to the design choices we made; however, we believe other differences are inherent to these approaches (Dickinson et al. 2012). Here, we summarize these differences, and discuss the design choices we made or could have made to optimize data quality and quantity, minimize cost, and maximize outreach potential for each of these different approaches.
Comparing data characteristics
We believe that a professional scientist approach will generally yield the most detailed and highest quality data relative to the two other approaches, while the citizen science and crowdsourcing approaches have the potential for generating the highest volume of data (given similar resources in terms of personnel time and supplies). The differences in data quality and complexity among the three approaches arise for a few different reasons. Professional scientists generally have more specialized training, allowing them to collect data for more species and more phenophases than citizen scientists (who generally do not have a botanical background or experience collecting scientific data) or a crowdsourcing approach (where data collection opportunities are limited by photographers’ preferences). For example, one graduate student could annually collect data on more than 40 species and six phenophases (representing the professional scientist approach), whereas volunteers participating in our citizen science program MeadoWatch monitored 10 species and four phenophases; crowdsourced photos from Flickr provided data on just one phenophase (flowering) for 8 species. Another factor is measurement error caused by misidentification (or lack of observation) of phenophases, which is presumably lower for phenology data generated by professional scientists than for crowdsourced data (given uncertainty in species identity from photos) and, in some cases, data collected by citizen scientists. Mandatory species identification training and resources like the species identification booklets we provided to volunteers during orientation can minimize measurement error.
Although data generated by professional scientists may be of higher quality, this advantage might be offset by the higher volume of data that citizen scientist and crowdsourcing approaches can generate, especially if those programs persist over many years. For example, our professional scientist spent a similar amount of time visiting each of her sites weekly (representing one observation per site per week) as our citizen scientist volunteer coordinator spent coordinating data collection from 15–20 volunteers in a week (representing 15–20 observations each week at a smaller number of sites). This meant that our MeadoWatch volunteers generated data with higher (approximately daily) frequency. Similarly, in just one year, our graduate student and several undergraduate lab assistants spent less time generating a much more spatially and temporally extensive data set through the crowdsourcing approach than either the professional scientist or volunteer coordinator spent leading data collection efforts for one summer. Flickr photos allowed us to “go back in time” given that we had access to photos uploaded in previous years. However, the high data-volume potential of citizen science programs and crowdsourcing approaches is contingent on the supply of motivated volunteers and high park visitation rates, which (at Mount Rainier National Park) is likely tied to the proximity of metropolitan areas (e.g., Seattle, Tacoma, Olympia). For less highly visited natural areas, these approaches may not yield the same volume of data, although recruitment efforts can increase the volunteer base and encourage more visitors to upload their photographs to online photo databases like Flickr or iNaturalist (http://www.inaturalist.org) as they did in our case.
Comparing costs required for initiation and maintenance
The resources needed to initiate and maintain wildflower phenology monitoring programs in terms of personnel were similar for the professional scientist and citizen scientist approaches, but much lower for crowdsourcing. All three approaches required at least part-time staff to collect data (professional scientist approach); recruit, train, and organize volunteers (citizen scientist approach); or extract, classify, and analyze wildflower photos (crowdsourcing approach). However, the number of hours required to classify photos (for the crowdsourcing approach) was not only lower, but could be conducted at any time of year. Because personnel are likely the highest expense associated with any wildflower phenology monitoring effort in a national park over long time periods, this is an important advantage of the crowdsourcing approach. Costs for personnel can potentially be reduced by capitalizing on additional funding sources, as we did. For example, Elli Theobald (representing the professional scientist approach) received a Graduate Research Fellowship (from the National Science Foundation), and we secured two federal grants to support the volunteer coordinator for MeadoWatch.
The three approaches we employed also differed in the optimal skill sets possessed by the personnel employed, because of the differing methods used. For example, the professional scientist approach required that the graduate student have a greater knowledge of botany and experimental design than personnel associated with our citizen science program or the crowdsourcing approach. On the other hand, communication skills were key to interacting with volunteers effectively (as in our citizen science program), but they were not necessary to collecting wildflower phenology data in the field or extracting information from the Flickr photo database (our professional science and crowdsourcing approaches, respectively). Finally, programming skills (to extract photograph metadata from online databases) and a more sophisticated statistical background were essential for processing and analyzing the nonstandard data gleaned from the Flickr photos. These skills were not as critical for our graduate student or MeadoWatch volunteer coordinator, because more mainstream statistical methods could be used to give accurate estimates of wildflower phenology for these data sets (fig. 6).
Comparing inherent outreach potential
The three approaches we used for monitoring wildflower phenology differ greatly in their potential for outreach to park visitors, with the citizen scientist approach most effective at doing so. For example, MeadoWatch, explicitly designed to engage members of the public, reached more than 40 volunteers in its first year (>85 as of 2016)—far more than the professional scientist and crowdsourcing approaches. Of course, crowdsourcing does have the potential to engage many park visitors, particularly if photographers are engaged while visiting the park, as opposed to their photos being used long after they were uploaded and without their knowledge. Although scientists often share their research results with the public or engage in outreach outside of data collection, we argue that traditional monitoring programs (i.e., the professional scientist approach) are generally constrained in their outreach capacity (as compared to the other two approaches). This is because only a few trained personnel are involved in collecting data, in contrast to citizen science and crowdsourcing approaches, which tend to engage as many volunteers as possible and frequently involve repeated interactions.
Conclusion
These three approaches all represent viable alternatives for monitoring wildflower phenology, but differ in data quality and requirements, amount and type of resources required for initiation and maintenance, and the inherent outreach opportunities provided (table 1). Thus, the choice of approach will depend on the goals for establishing a wildflower phenology program and resources available. Based on these considerations, we make the following recommendations for those wishing to initiate and potentially maintain a long-term wildflower phenology monitoring program.
A traditional professional scientist approach is likely the best option when (1) data accuracy is paramount (perhaps for policy mandates, legal reasons, or sensitive resource areas), (2) personnel with the technical expertise are available to collect data (either because of reliable funding sources or existing partnerships), and (3) data collection by volunteers is not otherwise feasible (due to low capacity or high safety risks). While this approach lacks inherent outreach opportunities, funding for outreach programs could be built into budgets and partnerships (as encouraged by many federal agencies) to ensure that the information gained from data collection can be provided in forms and venues suitable for interpretive staff and visitors.
A citizen scientist approach may be the best option when outreach is an important goal, especially if it is equal in importance to the scientific goal of data collection. In fact, wildflower phenology is already monitored in several national parks through citizen science efforts (e.g., the A.T. Seasons Phenology Program along the Appalachian Trail and the California Phenology Project, both in partnership with the USA National Phenology Network—https://www.nps.usanpn.org/). This approach requires the following resources: (1) an on-the-ground, at least part-time volunteer coordinator to work with scientists on developing appropriate protocols, training volunteers, and coordinating logistics, (2) a dedicated volunteer base, and (3) minimal funding for volunteer recruitment and supplies (e.g., training materials). Additionally, suitable monitoring locations must be easy to access by visitors, with focal species and phenophases easily identified by volunteers with limited plant identification skills (e.g., minimally acquired after relatively short training sessions). At Mount Rainier we continue monitoring wildflower phenology through the MeadoWatch citizen science project, giving us valuable data on wildflower phenology (of great scientific interest) while engaging more than 85 volunteers (as of 2016) in research on climate change (valuable and rewarding outreach for both the University of Washington scientists and their NPS partners).
Crowdsourcing phenological data from geo-located, date-stamped photos stored in online databases may be the best option when (1) personnel to collect phenological data or coordinate volunteers in summer months are unavailable, (2) long-term budgets for the program are uncertain (since this is the only approach that can provide multiple years of data with less than one year of effort), and (3) areas of interest are located in heavily visited portions of national parks, generating a large number of photos. The proliferation of smartphones and cameras with GPS capabilities, combined with the ability to share and store biodiversity observations via social media (e.g., iNaturalist) will likely make crowdsourcing of photos an increasingly viable option (Newman et al. 2012).
Of course, any of these approaches could be modified or combined to overcome some of the individual drawbacks. For example, crowdsourcing could be coupled with on-site outreach programs and social media campaigns to increase interaction with volunteers, thereby increasing outreach potential. Such on-the-ground supplemental programs would simultaneously inform and inspire national park visitors while increasing data quantity. Alternatively, the professional scientist approach could be combined with the citizen science approach, which could simultaneously increase data quality (if volunteers experience difficulty identifying phenophases) and quantity (by increasing the number of observers). However, given that we found quantitative differences in estimates of phenological timing between monitoring approaches (fig. 9), we recommend against using different approaches in different years (or switching approaches) to detect long-term trends. Clearly, there are many possibilities for creating and maintaining successful monitoring programs that simultaneously address scientific questions while incorporating citizen science or crowdsourcing approaches (Bonney et al. 2009; Dickinson et al. 2012).
We believe that the citizen science and crowdsourcing approaches to collecting scientific data represent viable alternatives to traditional monitoring programs, while simultaneously supporting the NPS mission to protect resources and provide for meaningful visitor experiences (Theobald et al. 2015). These approaches also align with recent calls for NPS staff to engage the next generation of conservation scientists and increase public understanding of science (NPS 2014, pp. 10 and 15; OTAG 2016). If continued over many years, these approaches can be used to monitor the impacts of climate change on wildflower phenology while getting the full benefit of the inherent opportunities for public engagement. At the same time, data collected using these approaches can serve as “canaries in the coal mine” to identify locations and trends of concern where managers can then focus limited resources and further investigation by professionals.
Acknowledgments
Funding for phenology data collection was provided by the National Science Foundation (NSF Career DEB-1054012 to JHRL, NSF graduate research fellowship NSFDGE-1256082 to EJT) and the National Aeronautics and Space Agency (NASA NNX14AC34G to JHRL, JL and RR). Research is permitted by the National Park Service under permit MORA-00099. Members of the HilleRisLambers lab (especially Natasha Lozanoff, Mitch Piper, and Margot Tsakonas) and Theresa Crimmins (of the USA National Phenology Network) provided valuable feedback on the development and design of MeadoWatch. We especially thank the many volunteers who have made our MeadoWatch program so successful over the years. Any opinions, findings, and conclusions or recommendations expressed in this material are those of the authors and do not necessarily reflect the views of funding agencies.
References
Bakkegard, K. A., and L. J. Davenport. 2012. Nephila clavipes (Araneae: Nephilidae): A model species for monitoring climate change in the southeastern United States. Southeastern Naturalist 11:551–566.
Bonney, R., C. B. Cooper, J. Dickinson, S. Kelling, T. Phillips, K. V. Rosenberg, and J. Shirk. 2009. Citizen science: A developing tool for expanding science knowledge and scientific literacy. Bioscience 59:977–984.
Buckley, L. B., and M. S. Foushee. 2012. Footprints of climate change in US national park visitation. International journal of biometeorology 56:1173–1177.
Dickinson, J. L., J. Shirk, D. Bonter, R. Bonney, R. L. Crain, J. Martin, T. Phillips, and K. Purcell. 2012. The current state of citizen science as a tool for ecological research and public engagement. Frontiers in Ecology and the Environment 10:291–297.
Evans, C., E. Abrams, R. Reitsma, K. Roux, L. Salmonsen, and P. Marra. 2005. The Neighborhood Nestwatch program: Participant outcomes of a citizen-science ecological research project. Conservation Biology 19:589–594.
Fitter, A., and R. Fitter. 2002. Rapid changes in flowering time in British plants. Science 296:1689–1691.
Hurlbert, A. H., and Z. Liang. 2012. Spatiotemporal variation in avian migration phenology: Citizen science reveals effects of climate change. Plos One 7:e31662.
Inouye, D. W. 2008. Effects of climate change on phenology, frost damage, and floral abundance of montane wildflowers. Ecology 89:353–362.
Jordan, R. C., S. A. Gray, D. V. Howe, W. R. Brooks, and J. G. Ehrenfeld. 2011. Knowledge gain and behavioral change in citizen-science programs. Conservation Biology 25:1148–1154.
McKinney, A. M., P. J. CaraDonna, D. W. Inouye, B. Barr, C. D. Bertelsen, and N. M. Waser. 2012. Asynchronous changes in phenology of migrating broad-tailed hummingbirds and their early-season nectar resources. Ecology 93:1987–1993.
National Park Service. 2014. A call to action: Preparing for a second century of stewardship and engagement. National Park Service, Washington, DC, USA. Available at https://www.nps.gov/calltoaction/PDF/C2A_2014.pdf.
Newman, G., A. Wiggins, A. Crall, E. Graham, S. Newman, and K. Crowston. 2012. The future of citizen science: Emerging technologies and shifting paradigms. Frontiers in Ecology and the Environment 10:298–304.
Outreach Technical Advisory Group (OTAG). 2016. Science communication framework. National Park Service, Natural Resource Stewardship and Science, Washington, DC, USA.
Parmesan, C. 2006. Ecological and evolutionary responses to recent climate change. Annual Review of Ecology Evolution and Systematics 37:637–669.
Robbirt, K. M., D. L. Roberts, M. J. Hutchings, and A. J. Davy. 2014. Potential disruption of pollination in a sexually deceptive orchid by climatic change. Current Biology 24:2845–2849.
Theobald, E. J., A. K. Ettinger, H. K. Burgess, L. B. DeBey, N. R. Schmidt, H. E. Froehlich, C. Wagner, J. HilleRisLambers, J. Tewksbury, M. A. Harsch, and J. K. Parrish. 2015. Global change and local solutions: Tapping the unrealized potential of citizen science for biodiversity research. Biological Conservation 181:236–244.
About the authors
Anna Wilson was the volunteer coordinator of MeadoWatch (2013–2015) in the Biology Department at the University of Washington (UW), Seattle. Kevin Bacher is the Volunteer and Outreach Program manager at Mount Rainier National Park, Ashford, Washington. Ian Breckheimer is a graduate student (PhD candidate) in the Biology Department at UW. Jessica Lundquist is an associate professor in the Civil and Environmental Engineering Department at UW. Regina Rochefort is the science advisor to the North Cascades National Park Service Complex, Sedro-Woolley, Washington. Elli Theobald was a graduate student (now PhD) in the Biology Department at UW and program design coordinator for MeadoWatch. Lou Whiteaker was the park ecologist at Mount Rainier National Park (2007–2015). Janneke HilleRisLambers (jhrl@uw.edu) is the Walker Endowed Professor of Natural History in the Biology Department at UW and executive director of MeadoWatch.