Great Sand Dunes National Park and Preserve provides an opportunity to study the removal of artificial water sources in an arid ecosystem.
Get PDF
Download PDF of this article
Abstract and key words
Abstract: Originally developed for livestock, artesian wells in the San Luis Valley of south-central Colorado have been a stable source of water for cattle and wildlife for more than 100 years. In 2010 the National Park Service capped the wells within the borders of Great Sand Dunes National Park to restore the area to its natural state; concurrently, the park was interested in understanding changes to local biodiversity after well closure. We studied changes to small-mammal population dynamics, plant cover, and area disturbance by ungulates following capping of these wells by comparing species density and survival at capped wells, open well sites (i.e., wells with water), and control sites (i.e., no wells present). Six small-mammal species were captured (1,150 individuals), but only Ord’s kangaroo rat (Dipodomys ordii) and pocket mouse species (Perognathus sp.) had sufficient captures to estimate parameters. In general, there was little difference in these species’ density and survival among well types. Plant cover and level of disturbance by ungulates best predicted density for the kangaroo rat and pocket mouse, while year of study influenced survival of both species. There was no difference in native plant cover at different well sites, but open well sites had significantly higher levels of disturbance. Our results suggest that in the short term, small-mammal population dynamics have changed little after well capping for the most common small-mammal species.
Key Words: artesian well, density, Great Sand Dunes National Park and Preserve, mark-recapture, small mammals, survival
USGS/Kate Schoenecker
THROUGHOUT THE PASTORAL HISTORY OF THE UNITED STATES, artificial water sources have been used to support humans, livestock, and agriculture in arid regions. This increased water availability has affected ecosystems by altering forage abundance and concentrating livestock and wildlife (Andrew 1988; Brooks et al. 2006). The resulting combination of trampling, grazing, and high densities of ungulates, especially in arid ecosystems, can produce a gradient of disturbance, with the greatest intensity nearest to the water source (Nash et al. 1999). This disturbance gradient can be of concern, especially in protected arid regions. Although recent research on artificial water sources has focused on everything from stream recovery (Rigge et al. 2013) to soil conditions in relation to grazing intensity (Augustine et al. 2012), few studies have actually examined the effects of water removal on these disturbance regimes. This knowledge is important for the management of natural resources, especially in light of climate change and predicted drought increase in some areas (Cayan et al. 2010).
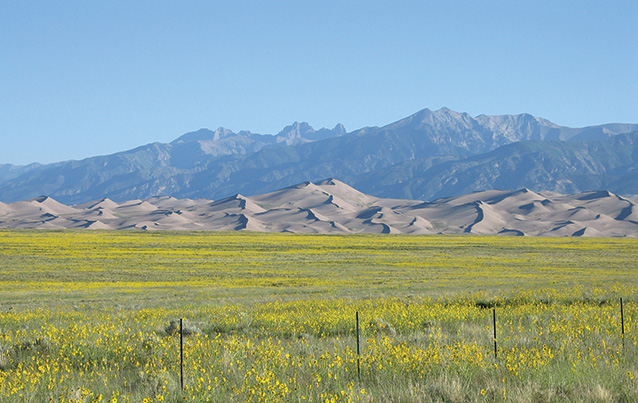
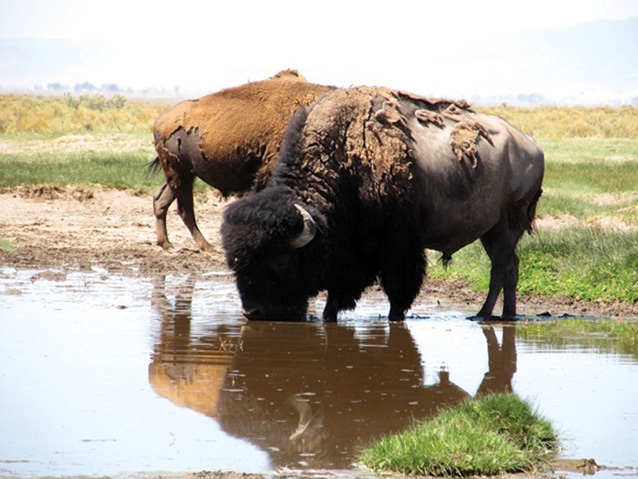
In south-central Colorado, Great Sand Dunes National Park and Preserve provides an opportunity to study the removal of artificial water sources in an arid ecosystem (fig. 1, above). Prior to becoming a national monument in 1932, this area was developed for ranching operations with 24 artificial artesian wells drilled into the underlying confined aquifer to provide water for local cattle herds. Areas around these well sites were highly disturbed from frequent visitation by cattle and wild ungulates such as elk (Cervus elaphus) and, more recently, ranched bison (Bison bison, fig. 2, below). When the national monument became a national park in 2004, the National Park Service (NPS) acquired land rights and, in 2010, capped all artesian wells on NPS lands (10); 14 wells remain open on adjacent lands owned by The Nature Conservancy. Along with maintaining the natural hydrological system of the sand dunes, the National Park Service is interested in eliminating the “piosphere effect,” the combined influence of grazing and trampling on vegetation and soil that results in highly denuded zones of landscape, such as those around artificial water sources (Lange 1969). We designed our study to focus on changes in ungulate disturbance following the capping of wells and its aftereffects on small-mammal population dynamics and plant cover as a proxy for the ecological effects of removing artificial sources of water. Changes in small-mammal population dynamics can often serve as an ecological indicator of alterations in ecosystem structure and function (Carey and Harrington 2001). Only a few empirical studies have focused on small mammals, denuded zones, and artificial sources of water. For example, small-mammal species diversity was not altered at watering sites in semiarid scrub communities of southern New Mexico (Burkett and Thompson 1994), while another study (James et al. 1997) documented decreases in small-mammal abundances near water sources in the arid grasslands of Australia.
Colorado State University and USGS/Sarah J. Garza
Piosphere plant communities are characterized by early stages of ecological succession, such as large areas devoid of plant cover (Fusco et al. 1995) and decreased plant species composition (Fernandez-Gimenez and Allen-Diaz 2001). In desert ecosystems, the types of emerging plant species related to ecological succession at artificial watering sites can vary greatly (Andrew 1988; Fusco et al. 1995). For example, in the Mojave Desert, California, the earliest stage of succession at watering sites was characterized by exotic plant species on bare ground (Brooks et al. 2006). In the Chihuahuan Desert, New Mexico, livestock created nutrient-rich patches near water that supported species of native annual plants that were rare or absent in other areas (Nash et al. 1999).
In this study, we characterized the short-term response of small-mammal and plant communities to capping of artesian well sites by comparing density, survival (small mammals), and cover (plants) across three site types: capped well sites, wells with water (open well sites), and control sites (selected sites intended to represent average land settings not influenced by open water sources). Based on previous studies of ungulate distribution around artificial water sources (Thrash et al. 1993; Smit et al. 2001) and adaptations of small mammals in arid ecosystems (Bich et al. 1995; Davidson et al. 2010; Germano et al. 2011), we hypothesized that small-mammal population dynamics would be related to ungulate disturbance intensity levels and only indirectly to the water source itself. We predicted that capping artesian wells would reduce disturbance, improve habitat, and result in higher small-mammal density and survival estimates relative to open well sites. Additionally, we predicted that capping well sites would affect plant cover because differences in ungulate use create differences in disturbance intensity (Lange 1969) that can influence plant community development (Leicht-Young et al. 2009). Specifically, we expected native plant cover to be greatest at the capped well sites because of less disturbance by ungulates.
Methods
Map by Office of Education and Outreach; data from Great Sand Dunes National Park; base map by NPS/harpers ferry center
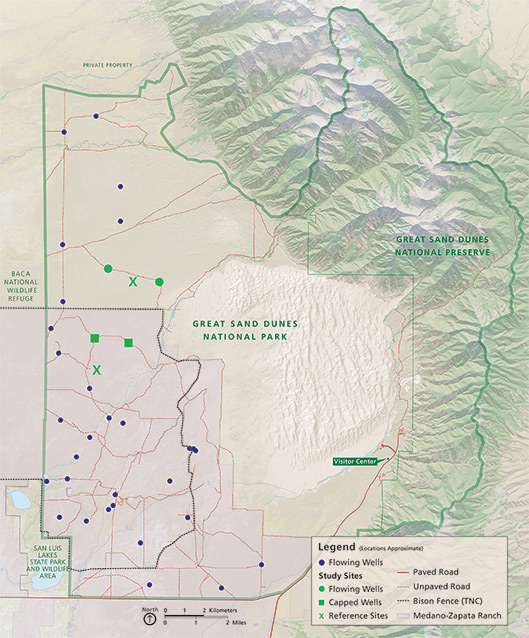
All study sites were located in the San Luis Valley (fig. 3), a high-elevation closed basin valley of approximately 21,000 km² (8,108 mi²) in Colorado and New Mexico. Key grass species included blue grama (Bouteloua gracilis), Indian rice grass (Oryzopsis hymenoides), needle and thread grass (Hesperostipa comata), and false buffalo grass (Monroa squarrosa), while key shrubs were rubber rabbitbrush (Ericameria nauseosus>), sagebrush (Artemisia sp.), and yucca (Yucca glauca). Part of our study occurred on the fenced 200 km² (77 mi²) northern portion of The Nature Conservancy’s Zapata Ranch where approximately 2,000 introduced bison are ranched. Native elk, mule deer (Odocoileus hemionus), and pronghorn (Antilocapra americana) move freely across Great Sand Dunes National Park and the Zapata Ranch—due to a bison fence, there are no free-ranging bison inside the park boundaries.
Colorado State University and USGS/Sarah J. Garza
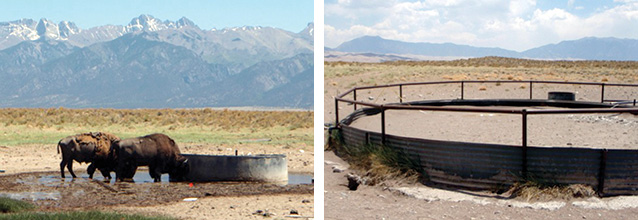
We studied small mammals and plants at two capped wells, two open well sites, and two control sites in Great Sand Dunes National Park and on The Nature Conservancy’s Zapata Ranch (fig. 3). Sites were not randomly located because site selection was limited by accessibility, similarity of water containment structure types, and similarity of habitats; in addition, capped wells could not naturally have ceased waterflow prior to capping in 2010. Open wells (fig. 4A) were heavily trampled by animals and had less vegetation around the tanks than capped wells (fig. 4B) and control sites (see Garza 2013 for details).
Colorado State University/David Lewis
We measured percentage of total plant cover and disturbance intensity level once a month using a 1 m² (11 ft²) sampling frame placed at intervals of 10 m (33 ft) along each transect line of the trapping web. Evidence of disturbance included trampling (areas of compacted sand and no plant cover), presence of tracks, and flattened shrubs (Howe and Baker 2003). Four disturbance levels were defined based on intensity within the sampling frame: 0 = none, 1 = mild (bare ground was < 25% of quadrat and presence of ungulate tracks), 2 = intermediate (bare ground was ~50% of quadrat and presence of ungulate tracks), and 3 = extreme (bare ground was > 50% of quadrat and presence of ungulate tracks). The 10 sampling frames per transect line resulted in 120 samples per site, and these were averaged for each sampling period to compute an overall estimate of plant cover and disturbance intensity level.
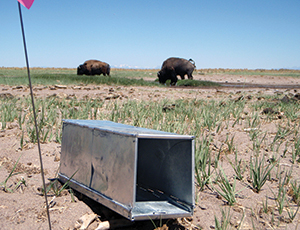
We captured and fitted ear tags to small mammals from May to August, 2011 and 2012 (Monel model 2001-1, National Band and Tag Company, Newport, Kentucky). We used a trapping web design (Anderson et al. 1983; Buckland et al. 1993; Burnham and Anderson 2002) of 100 Sherman live traps (23 × 8 × 9 cm [9 × 3 × 4 in], fig. 5) that consisted of 12 equally spaced lines of traps radiating from a central point near the wellhead.
We coupled the trapping-web design with mark-recapture methods to calculate estimates of density and survival of the most common species. Mark-recapture consists of capturing, marking, and then releasing animals to be captured at a later occasion. We used distance sampling (Buckland et al. 1993) to estimate small-mammal density using the initial captures of animals and the point estimate feature in the computer software DISTANCE. Distance sampling comprises a set of methods in which distances from a point to multiple animal detections are recorded and the density is estimated (Buckland et al. 1993). Mark-recapture data were used to estimate survival in the computer software Program MARK (White and Burnham 1999).
We modeled these density and survival estimates by species as a function of (1) well site type, (2) percentage of total plant cover, (3) level of disturbance, and (4) year of study to determine which factors influenced small-mammal populations. We also included an “intercept-only” model to determine if none of the variables explained the variation of the rates.
We used Akaike’s Information Criterion (AIC) as a statistical measure of the relative quality of a statistical model for a given set of data. We used AICC, the small sample size adjustment for AIC (Akaike 1973; Hurvich and Tsai 1989), to select the models that best fitted the sample data. The models with the lowest AICC represented the variables that best explained differences in the density and survival of the small mammals. We were also able to calculate the relative importance of each variable by summing the AICC weights for each variable across all models in the data set. The larger the estimate of relative importance, the more important the variable in explaining the density and survival estimates. Variables with values = 0.5 are considered important.
Results
Vegetation and disturbance
Average plant cover (n = 7) was greatest at capped well sites (x̄ = 10.87%, SE = 0.32%), lowest at open well sites (x̄ = 9.73%, SE = 0.31%), and intermediate at control sites (x̄ = 10.00%, SE = 0.25%). These differences were not considered significant. Average disturbance intensity levels were 1.10 (SE = 0.02), 1.21 (SE = 0.03), and 1.08 (SE = 0.01) at capped, open, and control sites, respectively. Average monthly temperature and precipitation from May to August were 17°C (SE = 1.23) and 21 mm (SE = 5.52) in 2011 and 18°C (SE = 0.82) and 30 mm (SE = 4.14) mm in 2012. Average rainfall during the two years of the study was 7 mm (0.28 in) below average (Western Regional Climate Center 2013).
Small mammals
From 2011 to 2012, we captured a total of 1,150 individuals of six potential species: 441 at capped wells, 342 at open wells, and 367 at control sites (table 1). Ord’s kangaroo rat (Dipodomys ordii) and pocket mouse (Perognathus sp.) accounted for 66% (757) and 21% (246) of individual captures, respectively. The remaining species represented 5% or less of total captures: thirteen-lined ground squirrel, Ictidomys tridecemlineatus (58); northern grasshopper mouse, Onychomys leucogaster (51); deer mouse, Peromyscus maniculatus (30); and least chipmunk, Tamias minimus (3). The two potential species of pocket mouse in the study area, Apache pocket mouse (Perognathus apache) and silky pocket mouse (P. flavus), are difficult to distinguish in the field; therefore all pocket mice were categorized only to genus.
| Table 1. Small mammals captured over 18 total trap nights in Great Sand Dunes National Park and The Nature Conservancy’s Zapata Ranch, Colorado | ||||||
|---|---|---|---|---|---|---|
| Species | Capped Well Sites | Open Well Sites | Control Sites | |||
| 2011 | 2012 | 2011 | 2012 | 2011 | 2012 | |
| Kangaroo rat, Dipodomys ordii |
83 | 179 | 170 | 78 | 90 | 57 |
| Pocket mouse, Perognathus spp.¹ |
27 | 30 | 10 | 52 | 33 | 94 |
| Thirteen-lined ground squirrel, Spermophilus tridecemlineatus |
1 | 3 | 2 | 15 | 17 | 23 |
| Northern grasshopper mouse, Onychomys leucogaster |
5 | 6 | 3 | 3 | 28 | 8 |
| Deer mouse, Peromyscus maniculatus |
0 | 6 | 2 | 7 | 3 | 12 |
| Least chipmunk, Tamias minimus |
0 | 1 | 0 | 0 | 1 | 1 |
| Total Individuals | 116 | 225 | 187 | 155 | 172 | 195 |
| Total Species | 4 | 6 | 5 | 5 | 6 | 6 |
| ¹Two species of pocket mouse, Perognathus apache and P. flavus, potentially were captured but were difficult to identify without examining skulls and teeth; therefore, pocket mice were identified only to genus. Note: Data were collected over three days per month for three to four months each year of the study. |
||||||
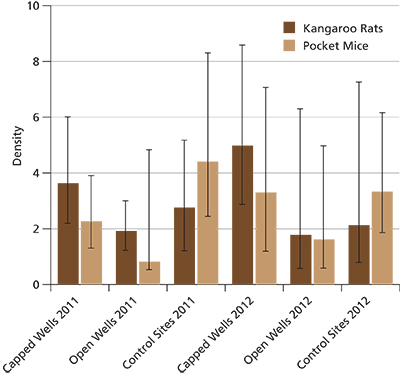
Only kangaroo rats and pocket mice had a sufficient number of captures for density and survival estimates. Average monthly density for kangaroo rats was greatest at capped well sites, followed by control sites and open well sites (fig. 6); however, these were not significantly different.
Models that best explained kangaroo rat density included percentage of total plant cover and well site type (ΔAIC₂ = 2) (table 2). Only percentage of plant cover was important to kangaroo rat density (relative importance = 0.62). Density tended to increase with increasing plant cover (B̂= 0.02; lower bound 95%confidence interval [CI] = 0.01, upper bound 95% CI = 0.04). All other variables had no significant effect on kangaroo rat density.
| Table 2. Effect of well site type and habitat characteristics on monthly densities of selected small-mammal species in Great Sand Dunes National Park and The Nature Conservancy’s Zapata Ranch, Colorado, 2011–2012 | ||||
|---|---|---|---|---|
| Species | Model/Variable | ΔAICC | AICC Weight | K |
| Kangaroo rat | ||||
| Percentage of Total Plant Cover | 0 | 0.34 | 2 | |
| Well Site Type | 1.16 | 0.19 | 2 | |
| Pocket mouse | ||||
| Intensity Level of Disturbance | 0 | 0.19 | 2 | |
| Well Site Type | 0.13 | 0.18 | 2 | |
| Intercept-Only | 0.28 | 0.17 | 1 | |
| Year + Disturbance | 1.24 | 0.10 | 3 | |
| Cover + Disturbance | 1.53 | 0.09 | 3 | |
| Notes: The models with the lowest AICC represent variables with the most effect on the monthly densities. Results are for the difference in Akaike’s Information Criterion corrected for small sample sizes and applied to top-ranked models (ΔAICC ≤ 2), model weight (AICC Weight), and number of parameters in the models (K). Well sites include capped, open, and control. Disturbance level was 0–3. Average monthly plant cover was 0–100%. Data are for 2011 and 2012. |
||||
For pocket mice, density estimates were highest at control sites, followed by capped well sites and open well sites (fig. 6), but again the differences between site types were not significant. The five top models explaining pocket mouse density had similar AICC weights and included level of disturbance, well site type, and the intercept-only models (table 2). None of the variables had importance values = 0.5; therefore, these variables could not be considered influential to pocket mouse density.
Estimates of monthly survival for kangaroo rats were greatest at capped well sites, where individuals had a 41% chance of survival from month to month, but differences among the three site types were insignificant (table 3). The most important variable was year of study, as kangaroo rat survival increased measurably from 2011 to 2012. For pocket mouse estimates of survival, year was also the most important variable. Estimates of monthly pocket mouse survival in 2012 were nearly twice those of 2011, but again there was no significant difference among well types (table 3). Overall, we found no differences in small-mammal populations following the removal of artificial artesian wells.
| Table 3. Estimates of monthly survival rate for selected small-mammal species at study sites in Great Sand Dunes National Park and The Nature Conservancy’s Zapata Ranch, Colorado | |||||
|---|---|---|---|---|---|
| Species | Site Type | Year | |||
| 2011 | 2012 | ||||
| Survival Rate | Confidence Interval | Survival Rate | Confidence Interval | ||
| Kangaroo rat | |||||
| Capped Well | 0.41 | 0.23–0.61 | 0.48 | 0.28–0.69 | |
| Open Well | 0.30 | 0.14–0.53 | 0.37 | 0.13–0.70 | |
| Control | 0.33 | 0.19–0.51 | 0.40 | 0.19–0.65 | |
| Pocket mouse | |||||
| Capped Well | 0.55 | 0.33–0.75 | 0.78 | 0.47–0.93 | |
| Open Well | 0.56 | 0.34–0.76 | 0.78 | 0.46–0.94 | |
| Control | 0.56 | 0.34–0.74 | 0.79 | 0.46–0.93 | |
Discussion
Over the two years of our study, we did not detect significant differences in small-mammal species density and survival, nor did we see significant changes in plant cover at capped artesian well sites compared with open wells for the two most common species, Ord’s kangaroo rat and pocket mouse. Other studies have documented increased rodent presence and survival in areas that are structurally open and slightly disturbed (Kelt et al. 2005; Tietje et al. 2008; Schorr et al. 2007), but the amount of disturbance at our well sites might have been more severe than in these studies. Density and survival of small mammals tended to vary more by year than by well site type, which may be linked to differences in annual precipitation between years during our study and the overall lower-than-average precipitation during both years. The national park has experienced drought conditions for the past six years and rain levels were lower than expected during both years of the study, almost 7 cm (2.8 in) below average (Western Regional Climate Center 2013). For example, in a rainfall manipulation experiment, Kray et al. (2012) found that reduced rainfall in the San Luis Valley over a two-year period significantly decreased native grass species cover, an important source of food for small mammals (Davidson et al. 2010; Germano et al. 2011). If small mammals had relied directly on the water from the wells, then their numbers would likely have been shown to decline markedly after the wells were capped. However, this was not the case.
Native plant cover was not significantly different at capped well sites compared with open well sites and control sites. Native cover varied more by year of the study and again, variation in annual precipitation may have played a more important role than well site types in these two years. The seeds of various desert plant species require varying amounts of rain for germination and seedling establishment (Gutterman and Gozlan 1998), and after insufficient rainfall, seedlings can suffer irreversible damage from dehydration stress, resulting in lower seed availability. Overall, these results suggest no discernible changes in plant community composition that may be related to the short-term impacts of capping artesian well sites.
Conclusion
Our work provides park resource managers with an initial look at the restoration dynamics surrounding artificial water sources, and also may be useful to other land and resource managers interested in similar restoration efforts. These interpretations, however, should be tempered because of the limitations of this study. Although our observations suggest that capping artificial water wells in the Great Sand Dunes ecosystem results in no significant changes in small-mammal population dynamics or native plant cover, it is also possible that a trend may be difficult to discern from so short a study period, arrangement of the wells, and the presence of bison at some sites but not others. These limitations make it difficult to derive conclusions that are not in part speculative. Follow-up work will be needed to fully understand the long-term ecological effects of capping wells.
The recovery of arid grasslands from a long-term disturbance can take decades (Daubenmire 1975; Rickard and Sauer 1982) and the artesian wells in our study were in use for more than 100 years, so it is understandable that recovery may take many more years. Furthermore, despite the absence of open water, we observed continued visitation of the capped well sites by elk, and the resulting disturbance from trampling may further delay habitat community recovery. Certainly, the influence of the well sites is small relative to the surrounding natural habitats; thus restoration of these well sites is probably not necessary to ensure that small-mammal biodiversity is maintained in Great Sand Dunes National Park.
Acknowledgments
Our study was funded primarily by a cooperative effort among the U.S. Geological Survey (USGS), Colorado State University, and the National Park Service, with additional funds from the Alliance for Graduate Education and the Professoriate at Colorado State University. Jim Harte, with the NPS Natural Resource Stewardship and Science Directorate, provided valuable insight into the legal history of groundwater rights of the San Luis Valley, and Joe Stevens, of the Colorado Natural Heritage Program, provided information on plant inventories. We also thank Great Sand Dunes National Park superintendents Art Hutchinson and Lisa Carrico for being very accommodating, and park employees Andrew Valdez, Fred Bunch, and Phyllis Bovin-Pineda for general project support.
Literature cited
Akaike, H. 1973. Maximum likelihood identification of Gaussian autoregressive moving average models. Biometrika 60:255–265.
Anderson, D. R., K. P. Burnham, G. C. White, and D. L. Otis. 1983. Density estimation of small mammal populations using a trapping web and distance sampling methods. Ecology 64:674–680.
Andrew, M. H. 1988. Grazing impact in relation to livestock watering points. Trends in Ecology and Evolution 3:336–339.
Augustine, D. J., D. T. Booth, S. E. Cox, and J. D. Derner. 2012. Grazing intensity and spatial heterogeneity in bare soil in a grazing-resistant grassland. Rangeland Ecology and Management 65:39–46.
Bich, B. S., J. L. Butler, and C. A. Schmidt. 1995. Effects of differential livestock use on key plant species and rodent populations within selected Oryzopsis hymenoides / Hilaria jamesil communities of Glen Canyon National Recreational Area. The Southwestern Naturalist 40:281–287.
Brooks, M. L., J. R. Matchett, and K. H. Berry. 2006. Effects of livestock watering sites on alien and native plants in the Mojave Desert, USA. Journal of Arid Environments 67:125–147.
Buckland, S. T., D. R. Anderson, K. P. Burnham, and J. L. Laake. 1993. Distance sampling: Estimating abundance of biological populations. Chapman and Hall, London, UK.
Burkett, D. W., and B. C. Thompson. 1994. Wildlife association with human-altered water sources in semi-arid vegetation communities. Conservation Biology 8:682–690.
Burnham, K. P., and D. R. Anderson. 2002. Model selection and multimodel inference: A practical information-theoretic approach. Second edition. Springer, New York, New York, USA.
Carey, A. B., and C. A. Harrington. 2001. Small mammals in young forests: Implications for management and sustainability. Forest Ecology Management 154:289–309.
Cayan, D. R., T. Dasa, D. W. Pierce, T. P. Barnetta, M. Tyree, and A. Gershunov. 2010. Future dryness in the southwest U.S. and the hydrology of the early 21st century drought. Proceedings of the National Academy of Sciences 107:21271–21276.
Daubenmire, R. F. 1975. Plant succession on abandoned fields and fire influences in a steppe area in southeastern Washington. Northwest Science 49:36–48.
Davidson, A. D., E. Ponce, D. C. Lightfoot, E. L. Fredrickson, J. H. Brown, J. Cruzado, S. L. Brantley, R. Sierra-Corona, R. List, D. Toledo, and G. Ceballos. 2010. Rapid response of a grassland ecosystem to an experimental manipulation of a keystone rodent and domestic livestock. Ecology 91:3189–3200.
Fernandez-Gimenez, M., and B. Allen-Diaz. 2001. Vegetation change along gradients from water sources in three grazed Mongolian ecosystems. Plant Ecology 157:101–118.
Fusco, M., J. Holecheck, A. Tembo, A. Daniel, and M. Cardenas. 1995. Grazing influences on watering point vegetation in the Chihuahua desert. Journal of Range Management 48:32–38.
Garza, S. J. 2013. Small mammal populations and plant community succession at artesian well sites in Great Sand Dunes National Park, Colorado. M.S. Thesis. Colorado State University, Fort Collins, Colorado, USA.
Germano, D. J., G. Rathburn, and L. Saslaw. 2011. Effects of grazing and invasive grasses on desert vertebrates in California. Journal of Wildlife Management 76:670–682.
Gutterman, Y., and S. Gozlan. 1998. Amounts of winter or summer rain triggering germination and “the point of no return” of seedling desiccation tolerance of some Hordeum spontaneum local ecotypes in Israel. Plant and Soil 204:223–234.
Howe, E., and W. L. Baker. 2003. Landscape heterogeneity and disturbance interactions in a subalpine watershed in northern Colorado, USA. Annals of the Association of American Geographers 93:797–813.
Hurvich, C. M., and C. L. Tsai. 1989. Regression and the time series model selection in small samples. Biometrika 76:297–307.
James, C. D., J. Landsberg, and S. R. Morton. 1997. Provision of watering points in the Australian arid zone: A review of effects on biota. Journal of Arid Environments 41:87–121.
Kelt, D. A., E. S. Konno, and J. A. Wilson. 2005. Habitat management for the endangered Stephen’s kangaroo rat. Journal of Wildlife Management 69:424–429.
Kray, J. A., D. J. Cooper, and J. S. Sanderson. 2012. Groundwater use by native plants in response to changes in precipitation in an intermountain basin. Journal of Arid Environments 83:25–34.
Lange, R. T. 1969. The piosphere: Sheep track and dung patterns. Journal of Range Management 22:396–400.
Leicht-Young, S. A., N. B. Pavlovic, R. Grundel, and K. J. Frohnapple. 2009. A comparison of seed banks across a sand dune successional gradient at Lake Michigan Dunes (Indiana, USA). Plant Ecology 202:299–308.
Nash, M. S., W. G. Whitford, A. G. de Soyza, J. W. Van Zee, and K. M. Havstad. 1999. Livestock activity and Chihuahuan Desert annual-plant communities: Boundary analysis of disturbance gradients. Ecological Applications 9:814–823.
Rickard, W. H., and R. H. Sauer. 1982. Self-revegetation of disturbed ground in deserts of Nevada and Washington. Northwest Science 56:41–47.
Rigge, M., A. Smart, and B. Wylie. 2013. Optimal placement of off-stream water sources for ephemeral stream recovery. Rangeland Ecology and Management 66:479–486.
Schorr, R. A., J. L. Siemers, P. M. Lukacs, J. P. Gionfriddo, J. R. Sovell, R. J. Rondeau, and M. B. Wunder. 2007. Using survival of rodents to assess quality of prairie habitats. The Southwestern Naturalist 52:552–563.
Smit, R., J. Bokdam, J. den Ouden, H. Olff, H. Schot-Opschoor, and M. Schrijvers. 2001. Effects of introduction and exclusion of large herbivores on small rodent communities. Plant Ecology 155:119–127.
Thrash, I., G. K. Theron, and J. P. Bothma. 1993. Impacts of water provision on herbaceous vegetation in the Kruger National Park, South Africa. Journal of Arid Environment 38:315–324.
Tietje, W. D., D. E. Lee, and J. K. Vreeland. 2008. Survival and abundance of three species of mouse in relation to density of shrubs and prescribed fire in understory of an oak woodland in California. The Southwestern Naturalist 53:357–369.
Western Regional Climate Center. 2013. Data derived from the Cooperative Climatological Data Summaries. Accessed 20 March 2013 at http://www.wrcc.dri.edu/cgi-bin/cliMAIN.pl?co3541.
White, G. C., and K. P. Burnham. 1999. Program MARK: Survival estimation from populations of marked animals. Bird Study 46 (Suppl.):120–139.
About the authors
Sarah J. Garza is a research associate with the Department of Biology, Colorado State University, in Fort Collins. She can be reached by e-mail. Kenneth R. Wilson is a professor and head of the Department of Fish, Wildlife, and Conservation Biology at Colorado State University. Gillian Bowser is a research scientist and scholar with the Natural Resource Ecology Laboratory at Colorado State University.
Documentation
Suggested citation for this article
Garza, S. J., K. R. Wilson, and G. Bowser. 2015. Removal of artesian wells in Great Sand Dunes National Park and its aftermath on small mammals, plant cover, and area disturbance by ungulates. Park Science 32(1):57–64.
This article published
Online: 4 September 2015; In print: 14 September 2015
URL
https://www.nps.gov/articles/parkscience32_1_57-64_garza_et_al_3823
This page updated
16 September 2015
Site navigation
Last updated: March 21, 2021
