Last updated: March 14, 2022
Article
Monitoring Nearshore Marine Systems
NPS/Jim Pfeiffenberger
At the interface between oceans and continents lie nearshore ecosystems, defined by well-known species with well understood ecological relations, where high densities of specialist predators (sea otters, sea ducks, black oystercatchers, sea stars) exist within a diverse and productive system full of kelps and invertebrates that don’t occur in any other habitats. This is the marine ecosystem that is most familiar to and highly valued by society. However, nearshore marine ecosystems face significant challenges at global and regional scales, with threats arising from both the adjacent lands and oceans. Monitoring composition and abundance of species and understanding functional relations in the nearshore ecosystem is essential when responding to and managing present and future threats. The legacy of knowledge provided by prior nearshore science allows us to tease apart human threats from naturally induced causes and provide guidance for management of those valued resources.
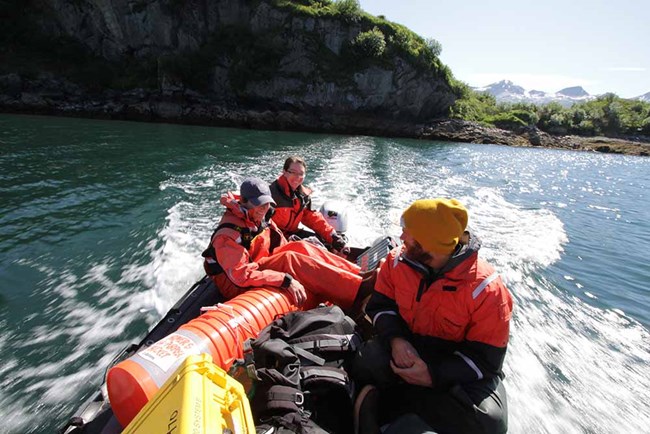
The Southwest Alaska Network (SWAN), in partnership with the US Geological Survey, the University of Alaska Fairbanks, and the National Ooceanic and Atmospheric Administration (NOAA), participates in Gulf Watch Alaska (GWA), a long-term marine monitoring program. This program was created to monitor change within the greater Exxon Valdez oil spill (EVOS) area that includes Prince William Sound (WPWS), Kenai Fjords National Park (KEFJ), Kachemak Bay (KBAY), and Katmai National Park and Preserve (KATM).
Our goal is to understand what drives change in Gulf of Alaska (GOA) nearshore ecosystems. We focus on key components of the nearshore food web, including primary producers, benthic invertebrates, and apex predators (Figure 1). The questions we are exploring include:
- What are the spatial and temporal scales over which change in nearshore ecosystems is observed?
- Are changes related to broad-scale environmental variation or local perturbations? What are the specific drivers?
- Does the magnitude and timing of changes in nearshore ecosystems correspond to those measured in pelagic ecosystems? Do some drivers affect nearshore and pelagic ecosystems differently?

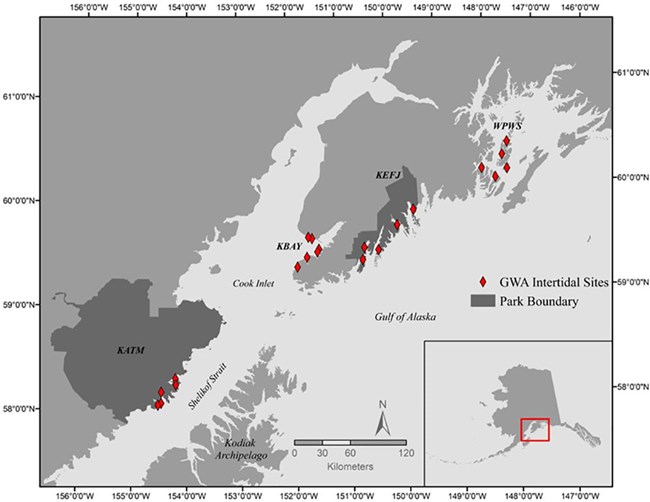
We monitor the nearshore using a rigorous site-selection process that allows us to make statistical inference over various spatial scales, from regional to site-specific (Figure 2), and to evaluate potential impacts from more localized sources—especially those resulting from human activities, including lingering effects of the oil spill. We look at both static (e.g., substrate, exposure, bathymetry) and dynamic (e.g., variation in oceanographic conditions, productivity, and predation) drivers as mechanisms linked to ecosystem change.
Warming Waters Were Followed by Changes in Species’ Abundance
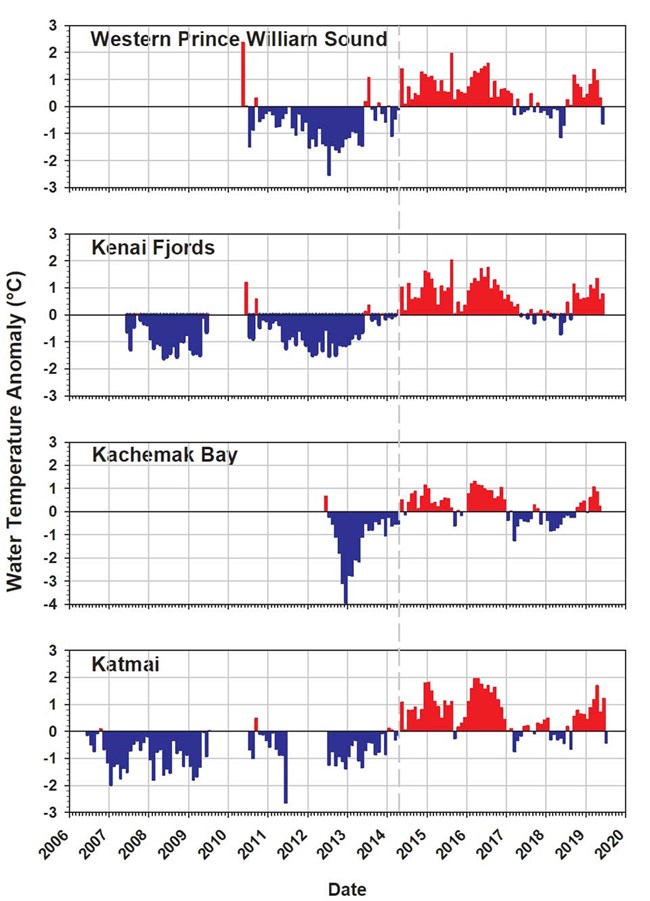
Nearshore water temperatures across the GOA began warming in 2014 (Figure 3) in response to a large marine heatwave, “the Blob” (Danielson et al. 2019).
NPS/Jim Pfeiffenberger
Rockweed Declined
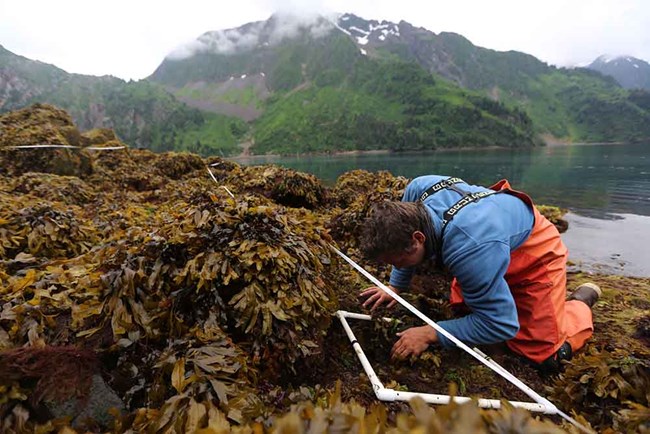
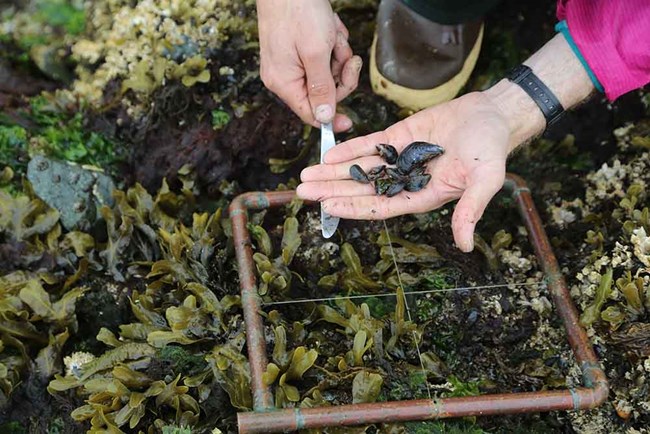
Since the onset of the marine heatwave in 2014, we have measured general decreases in algal cover, an indicator of primary production, although results in 2019 are trending back toward average conditions (Weitzman et al. 2019). Rockweed (Fucus distichus) is known to cycle in abundance at local scales (Figure 4), but the recent large-scale declines are likely due to direct effects of warming on survival and recruitment. Changes in the abundance of Fucus spp. are likely to have consequences for other dominant intertidal species.

NPS/Jim Pfeiffenberger
Mussels Increased
Mussels (Mytilus trossulus) are a common nearshore prey species for sea stars, sea ducks, sea otters, and black oystercatchers. Densities of large mussels (≥20 mm), which many predators prefer, increased across all regions during the marine heatwave (Figure 5). This increase had followed declines in mussel abundance across the GOA in years prior to 2014 (Bodkin et al. 2018).

Sea Stars Declined
Sea star abundance began to decline across the GOA in 2016, likely due to a sea star wasting disease that was first detected in 2014 (Konar et al. 2019). This trend appeared to be exacerbated by the marine heatwave (Eisenlord et al. 2016), but as of 2019 sea stars appeared to be recovering in some regions (Figure 6; Konar et al. 2019). Sea stars structure nearshore communities through their role as a predator, often limiting the abundance and distribution of mussels through predation. The increase in large mussels between 2015-2019 (Figure 5) is consistent with the decline in sea star abundance, and thus reduced predation pressure by sea stars, during that time.

Concurrent Observations of Nearshore Predators
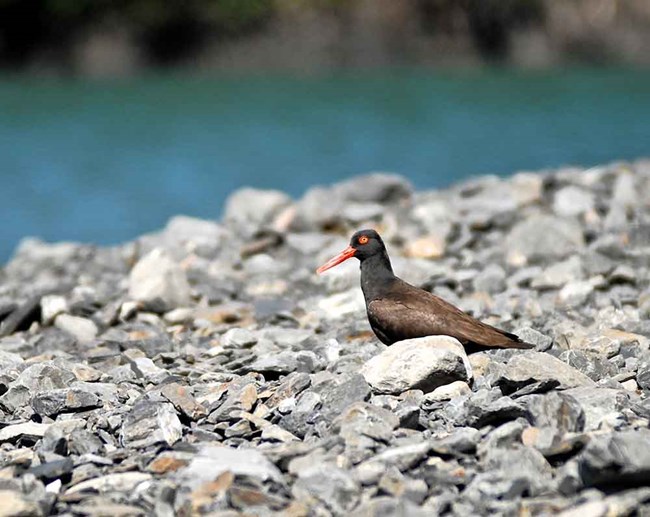
Nearshore predators such as the black oystercatcher and the sea otter can have strong effects on their prey communities and can be useful indicators of ecosystem status. Environmental attributes that affect prey densities or quality, such as habitat and physical conditions, can also have important effects on higher-level predators. We monitor diet data for the black oystercatcher and sea otter, and we also independently measure their prey resources in the intertidal, including clams, limpets, and mussels. Patterns in predators’ diets provide context for understanding predator population trends through space and time.
NPS/Kaitlin Thoresen
Black Oystercatchers: Stability AND Variability in Response to Changing Prey Availabilty
The black oystercatcher (Haematopus bachmani) depends on nearshore marine habitats for all critical parts of its life cycle, including foraging, breeding, chick rearing, and resting. At our sites, chick diet has been found to be dominated by three species of limpets (Lottia spp.; up to 67% of diet), followed by mussels (22%). We did not find significant variation in the diet by year or across regions (Figure 7). In contrast, the abundance of all black oystercatchers (except chicks) at KATM and KEFJ have a positive relationship with that of large mussel abundance (Figure 8); that is, in years when large mussel abundance was above normal, black oystercatcher densities were also higher than average.


NPS/Nina Chambers
Sea Otters Likely Reached Carrying Capacity
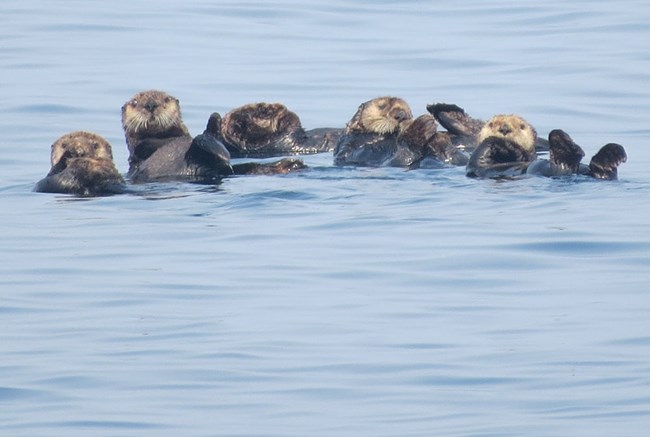
Sea otters (Enhydra lutris) are a keystone species that can affect community structure by altering their prey abundance (e.g., sea urchins), which can, in turn, alter the abundance of primary producers (e.g., kelps). Consequently, the status of sea otter populations may be inferred by measures of their prey base in the nearshore community and their rate of energy intake while foraging.
In contrast to the black oystercatcher, the proportions of prey types in sea otter diets vary by region (Figure 9). The sea otter diet at KEFJ is comprised of about equal proportions of mussels and clams, while in contrast, diet in KATM continues to be dominated by clams with an assortment of other, less-important prey. WPWS sea otters appear to have shifted recently from a diet primarily of clams to one higher in mussels in 2018, consistent with recent increases in large mussel abundance (Figure 8). In KBAY, where annual foraging observations were initiated in 2018, sea otters are eating a relatively high proportion of mussels. Coinciding with the increase in large (≥20 mm) mussels across all study areas (Figure 5), we have found increases in mussel consumption by sea otters in recent years (Coletti et al. 2020).

At KATM, foraging sea otter energy recovery declined from >15 Kcal/min in 2006, to about 7 in 2012, reflecting a population that has reached carrying capacity and has remained fairly stable since that time (Figure 10; Coletti et al. 2016). Average values through 2018 at KEFJ and WPWS are 10 and 8 Kcal/min, respectively, with a slight trend in recent years toward reduced energy intake, also consistent with populations at or near carrying capacity. Energy recovery rates at KEFJ and WPWS are consistent with estimates of population abundance that remain relatively stable over time.

What this Means for the Gulf of Alaska’s Nearshore Ecosystems
Intertidal and nearshore ecosystems provide valuable habitat for early life stages of commercially, ecologically, and culturally important species in the Gulf of Alaska. The marine heatwave in the north east Pacific was evident throughout GOA nearshore waters, likely contributing to the decline in intertidal primary productivity and creating space for competitors. Mussels appear to have broadly benefited from warming ocean conditions, as well as the large-scale declines in predatory sea stars, whose reductions due to disease may have been exacerbated by warming waters. The increase in large mussel abundance appears to have benefited adult black oystercatchers but may be less important for chick provisioning by parents constrained to small forage areas. The increase in mussels may benefit other upper trophic levels, as well, including overwintering sea ducks. Sea otter populations in the areas monitored appear to be near carrying capacity, as evidenced by energy recovery rates, but have shifted their diet to higher proportions of mussels in some regions. Under-utilized sea otter habitat remains in lower Cook Inlet and in the Kodiak Archipelago and we expect sea otters will become a significant source of change as their recolonization continues in those areas of the GOA.
While declines are evident in some components of the GOA nearshore food web, the black oystercatcher and sea otter populations appear healthy, and there are early signs of the recovery of many sea stars across the region.
Our monitoring detects trends in the composition of the nearshore community and identifies those functional relations that drive community change. How that change will be manifested in the future is not clear, but our program is well poised to track those changes, while concurrently providing insights into why those changes occur.
References
Bodkin, J. L., H. A. Coletti, B. E. Ballachey, D. H. Monson, D. Esler, and T. A. Dean. 2018. Variation in abundance of Pacific Blue Mussel (Mytilus trossulus) in the Northern Gulf of Alaska, 2006–2015. Deep Sea Research Part II: Topical Studies in Oceanography 147:87-97.
Coletti, H., J. Bodkin, T. Dean, D. Esler, K. Iken, B. Ballachey, K. Kloecker, B. Konar, M. Lindeberg, D. Monson, B. Robinson, R. Suryan and B. Weitzman. 2019 Intertidal Ecosystem Indicators in the Northern Gulf of Alaska in Zador, S. G., and E. M. Yasumiishi. 2019. Ecosystem Status Report 2019: Gulf of Alaska. Report to the North Pacific Fishery Management Council, 605 W 4th Ave, Suite 306, Anchorage, AK 99301.
Coletti, H., D. Esler, B. Konar, K. Iken, K. Kloecker, D. Monson, B. Weitzman, B. Ballachey, J. Bodkin, T. Dean, G. Esslinger, B. Robinson, and M. Lindeberg. 2020 in review. Gulf Watch Alaska: Nearshore Ecosystems in the Gulf of Alaska. Exxon Valdez Oil Spill Restoration Project Annual Report (Restoration Project 18120114-H), Exxon Valdez Oil Spill Trustee Council, Anchorage, Alaska.
Danielson, S. L., T. D. Hennon, D. H. Monson, R. M. Suryan, R. W. Campbell, S. J. Baird, K. Holderied, and T. J. Weingartner. 2019. Chapter 1 A study of marine temperature variations in the northern Gulf of Alaska across years of marine heatwaves and cold spells. In M. R. Suryan, M. R. Lindeberg, and D. R. Aderhold, eds. The Pacific Marine Heatwave: Monitoring During a Major Perturbation in the Gulf of Alaska. Gulf Watch Alaska Long-Term Monitoring Program Draft Synthesis Report (Exxon Valdez Oil Spill Trustee Council Program 19120114). Exxon Valdez Oil Spill Trustee Council, Anchorage, Alaska.
Eisenlord, M. E., M. L. Groner, R. M. Yoshioka, J. Elliott, J. Maynard, S. Fradkin, M. Turner, K. Pyne, N. Rivlin, R. van Hooidonk, and C. D. Harvell. 2016. Ochre star mortality during the 2014 wasting disease epizootic: role of population size structure and temperature. Philosophical Transactions of the Royal Society B: Biological Sciences 371.
Konar, B., T. J. Mitchell, K. Iken, H. Coletti, T. Dean, D. Esler, M. Lindeberg, B. Pister, and B. Weitzman. 2019. Wasting disease and static environmental variables drive sea star assemblages in the northern Gulf of Alaska. Journal of Experimental Marine Biology and Ecology 520.
Weitzman, B., B. Konar, K. Iken, H. Coletti, D. Monson, R. M. Suryan, T. Dean, D. Hondolero, and M. R. Lindeberg. 2019. Chapter 2 Changes in rocky intertidal community structure during a marine heatwave in the northern Gulf of Alaska. In M. R. Suryan, M. R. Lindeberg, and D. R. Aderhold, eds. The Pacific Marine Heatwave: Monitoring During a Major Perturbation in the Gulf of Alaska. Gulf Watch Alaska Long-Term Monitoring Program Draft Synthesis Report (Exxon Valdez Oil Spill Trustee Council Program 19120114). Exxon Valdez Oil Spill Trustee Council, Anchorage, Alaska.

April 2020
