Last updated: June 17, 2020
Article
National Park Service Bucks the Economist Trend

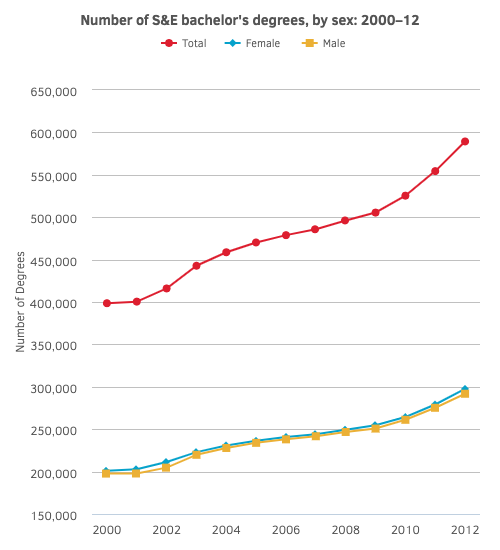
S&E = science and engineering. S&E includes biological/agricultural sciences, physical sciences, computer sciences, mathematics/statistics, engineering, psychology, and social sciences; excludes health sciences.
Source: National Science Board. 2014. Science and Engineering Indicators 2014. Arlington VA: National Science Foundation (NSB 14-01).
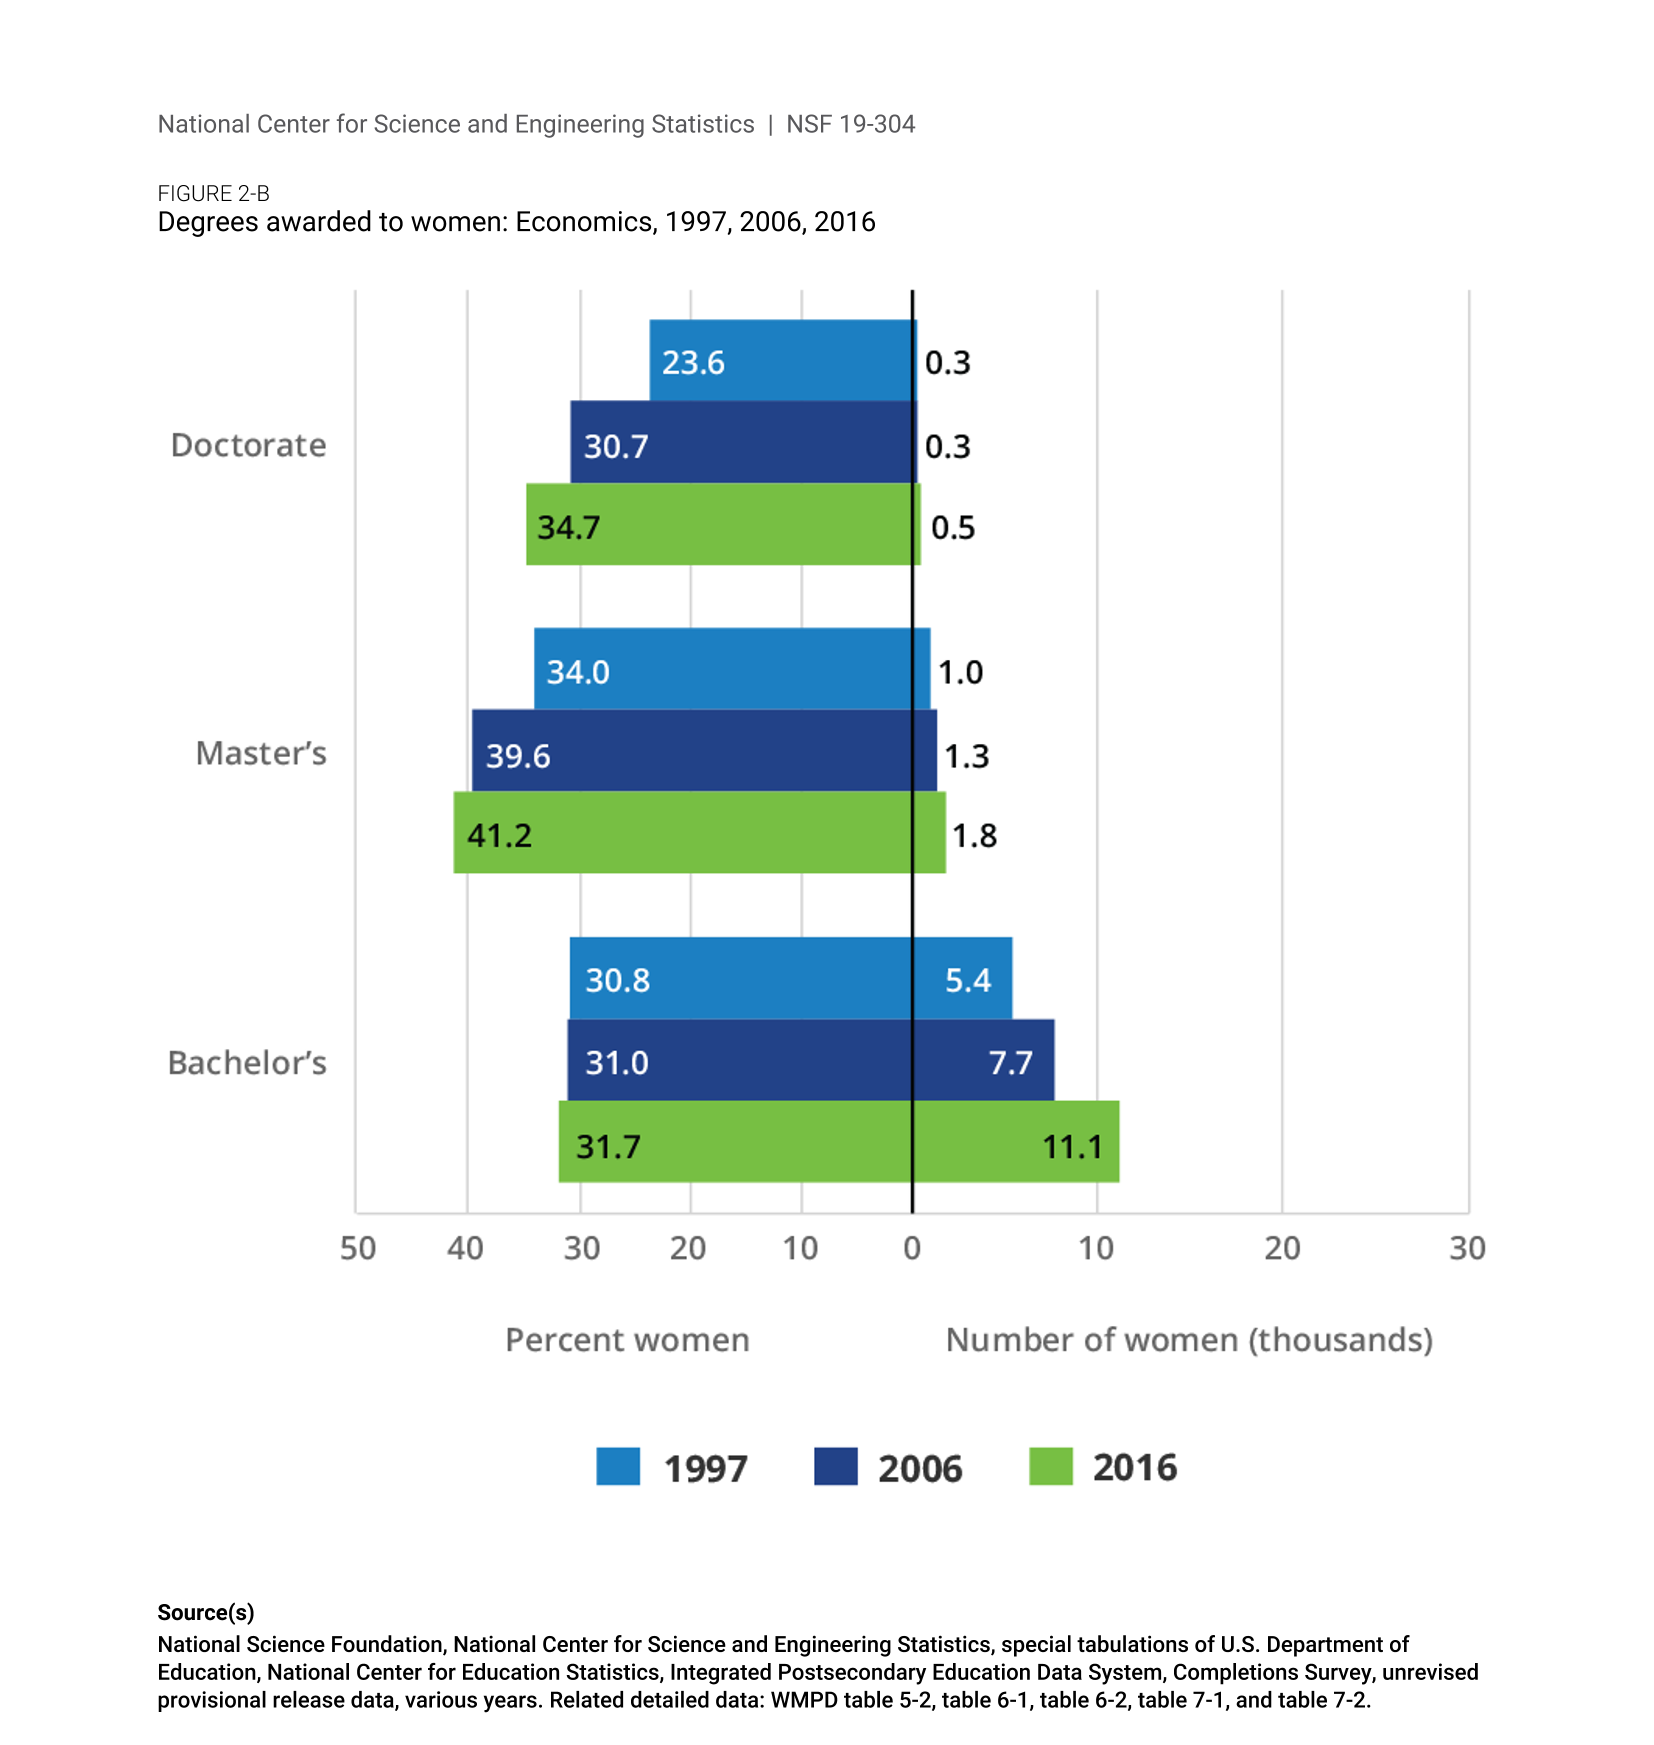
Women also earned roughly half of all the social science field degrees in 2016...except in the field of economics. It turns out that women are still less likely than men to study economics; for students graduating with bachelor’s degrees, men outnumber women three to one (Figure 2).

Source: National Science Foundation, National Center for Science and Engineering Statistics. 2019. Women, Minorities, and Persons with Disabilities in Science and Engineering: 2019. Special Report NSF 19-304. Alexandria, VA.
Available at https://www.nsf.gov/statistics/wmpd
1. Heather Best*
2. Lynne Koontz*
3. Charles Notzon
4. Leslie Richardson*
*female
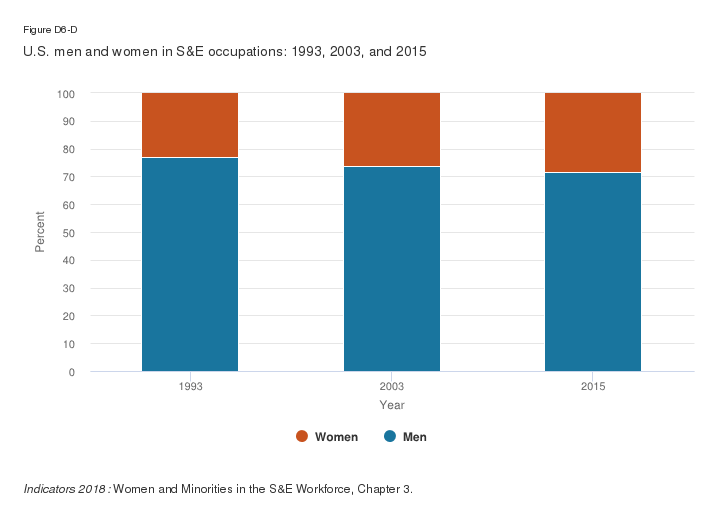
The trend outside of the National Park Service is women are in the minority at virtually every level of education and professional rank within economics (NY Times), and women are underrepresented in S&E occupations generally (Figure 3).

Source: National Science Board. 2018. Science and Engineering Indicators 2018. Alexandria, VA: National Science Foundation (NSB-2018-1).

Leslie Richardson, Economist at the National Park Service, thinks the problem might be an image issue. There is a common misconception that economics is about finance and the stock market, but “economics is much more than just finance. It has broader applications. It is really about how people make choices,” says Richardson.
Richardson’s PhD is in environmental economics, but that is not what she started her undergraduate career in: “I've always enjoyed math and was encouraged to go into accounting or finance, but it wasn’t the right fit. I wanted to switch gears, but not completely, and I kind of stumbled upon this course called Environmental Economics and it just clicked!”
Economics is about how societies allocate and manage scarce resources, and since these resources are scarce, people need to make trade-offs. It is concerned with people’s choices and what those choices say about their values and preferences. You can see how this can apply to more than just financial markets. Economics can be applied to an incredibly broad range of topics – health, crime, sports, and environmental issues.

“From a national park perspective, knowing how to allocate resources is important because parks are working with limited budgets and resources and diverse public preferences. Economics can help support evidence-based decisions. We want to know how people value things like recreational opportunities in parks and how decisions made by park managers affect the satisfaction of our visitors,” says Richardson. A visitor’s preferences are going to affect the activities they participate in, like hiking or fishing or camping. Economics can be used to understand issues such as whether to add a new multi-use trail.
Richardson explains, “A really interesting aspect of my job is when there is an injury to park resources – say from an oil spill. We try to quantify the loss to the public and then use the compensation to restore those resources and the services they provide.”
Environmental economics is just one of the many unique paths you can take with a degree in economics. There are current efforts underway to combat the underrepresentation of women in economics and help them understand everything that a career in economics can entail. Strategies are focused on exposing women to the broader applications of economics and addressing confidence in skills. Below is a list of resources:
-
The Undergraduate Women in Economics Challenge seeks to raise awareness of the underrepresentation of undergraduate women in economics and test the effectiveness of specific interventions to recruit and retain female majors.
-
The American Economic Association's Committee on the Status of Women in the Economics Profession (CSWEP) promotes the careers and monitors the progress of women economists in academia, government agencies, and elsewhere.
-
The Centre for Economic Policy Research's Women in Economics Initiative aims to redress gender imbalances in the economic profession, partnering with organizations to promote leading women within the field and improve female representation in the economic profession.
-
The Federal Reserve Bank of St. Louis' Women in Economics Podcast Series highlights the studies and careers of those making their marks in the field of economics.
Richardson is hopeful these interventions and resources will help the number of women studying economics and shares, “When I taught a microeconomics class, I used real world examples that seemed to resonate with the students. At the end of the semester, I had a young lady come up to me and tell me she was going to switch her major to economics because of my class.”
Figure 1 Alt Text
A line graph depicting number of Science and Engineering (S&E) bachelor's degrees, by sex from 2000 to 2012. The total line is red and goes up from 400,000 in 2000 to just under 600,000 in 2012. The line representing men is yellow and the women's line is blue. The men and women's line both go up from around 200,000 in 2000 to 300,000 in 2012.According to the Science and Engineering Indicator Report the Main Findings are:
From 2000 to 2012, about one-third of all bachelor’s degrees conferred by U.S. colleges and universities each year were in S&E fields. The number of S&E bachelor's degrees awarded annually rose steadily from 398,602 in 2000 to 589,330 in 2012. Women received a slim majority of these degrees in every year.
According to the Science and Engineering Indicator Report the Key Observations are:
- The number of S&E bachelor’s degrees awarded to women rose from 200,952 in 2000 to 297,539 in 2012. The number of S&E bachelor’s degrees earned by men over this period increased from 197,650 to 291,791.
- Between 2000 and 2012, the annual number of S&E bachelor’s degrees increased by 48% for both women and men.
Fig 2 Alt Text
A chart depicting degrees awarded to women in Social sciences for the years of 1997, 2006, 2016. The percent of women is shown by a bar on the left and the number of women (thousands) is on the right. There are 3 types of degrees represented, bachelor's, master's, and doctorate. For the year 1997 the percent of women earning the following degrees in social sciences is: bachelor's-51.8%, master's-51.1% doctorate-39.2%. For the year 2006 the percent of women earning the following degrees in social sciences is: bachelor's-53.7%, master's-56.4%, doctorate-46%. For the year 2016 the percent of women earning the following degrees in social sciences is: bachelor's-54.8%, master's-57.2%, doctorate-48.8%.
According to the Women, Minorities, and Persons with Disabilities in Science and Engineering Report the Main Findings are:
In the fields of social sciences, women earned a majority of bachelor’s degrees (55%) and master’s degrees (57%) but just under half of doctorate degrees. The number of female graduates in social sciences and their share in this field has increased over time.
Figure 3 Alt Text
A bar graph depicting U.S men and women in Science and Engineering (S&E) occupations in years 1993, 2003, 2015.
Each year is one bar divided into 2 unequal parts. Men in blue, women in orange. In 1993 men held 77.1% of the S&E occupations and women held 22.9%. In 2003, men held 73.7% of the S&E occupations, women held 26.3%. In 2015, men held 71.6% of the S&E occupations and women held 28.4%.
According to the Science and Engineering Indicators the Main Findings are:
Women in 2015 accounted for less than one-third of S&E employment. Although the number of women in S&E jobs has risen significantly in the past 2 decades (from 755,000 in 1993 to 1,818,000 in 2015), the disparity has narrowed only modestly.
