Last updated: March 20, 2018
Article
Monitoring Mussels in Southwest Alaska
Pacific blue mussels (Mytilus trossulus) are common and abundant in shallow nearshore marine waters. They often form dense stands of individuals, commonly called mussel beds. They are a valued food for humans as well as wildlife. In the nearshore, they are consumed by many predators including sea otters, black oystercatchers, and several species of sea ducks and sea stars. Because of their ecological and cultural value, mussels are an important part of our nearshore monitoring in the Gulf of Alaska.

Findings
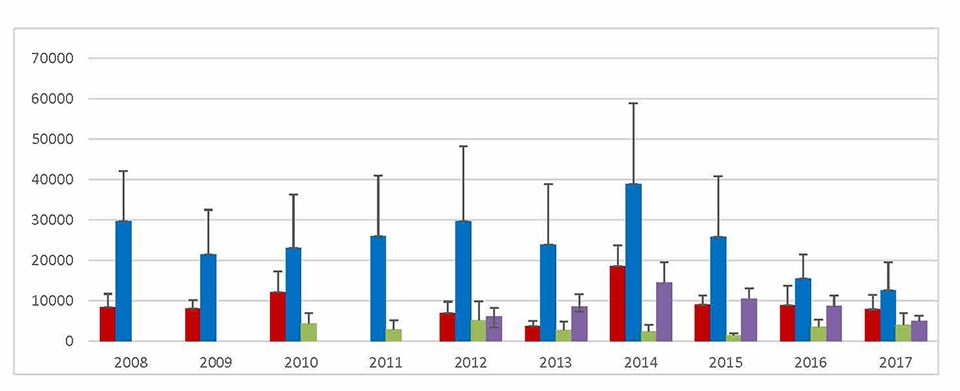
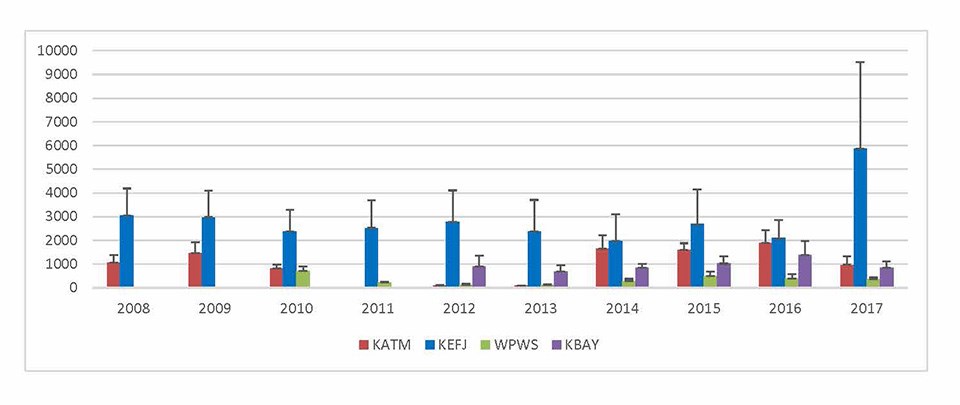
When we began sampling in 2008, mussel beds were largest in Kenai Fjords National Park, averaging about 25,000 individuals/m2. Katmai National Park and Preserve and Katchemak Bay averaged about 9,000/m2, and western Prince William Sound averaged about 3,000/m2 (Figure 1). We observed high annual variation in all mussel densities, with maximum densities in all blocks except western Prince William Sound occurring in 2014, and a trend toward declining densities of all mussels through 2017.

Methods
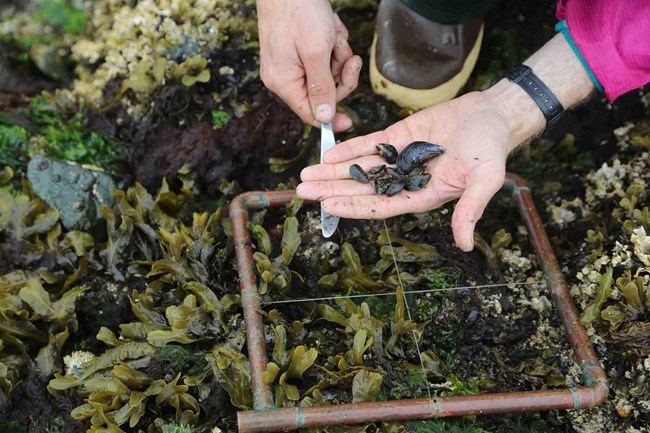
We estimate the abundance of mussels at 21 mussel sites across the four regions or blocks. These blocks include Katmai National Park and Preserve, Kenai Fjords National Park, Kachemak Bay, and western Prince William Sound. From these counts, we calculate densities of all mussels, small mussels (those ≤5 mm representing recruits for each year), and large mussels (those ≥20 mm).Understanding how and why mussel populations vary over time will aid management and conservation of not only mussels, but also of the many consumers that rely on this important bivalve for food.

