Last updated: August 25, 2017
Article
Status and Trends in Monitoring for Watershed Health & Salmon Recovery (WHSR)
Importance
The Clean Water Act requires States to monitor the chemical, physical and biological integrity of rivers and streams. Federal guidelines for de-listing under The Endangered Species Act require habitat assessment (including chemical and physical parameters). Therefore Washington State established the program called Status and Trends Monitoring for Watershed Health and Salmon Recovery (WHSR) for gathering consistent and integrated information about regional watershed health at multiple regional scales from statewide, down. The WHSR field data collection protocols include the following components:
- in-stream and riparian physical surveys,
- measurement of in-stream water water quality parameters,
- sediment chemistry sampling for hydrocarbons and metals,
- vertebrate assemblage sampling, and
- macroinvertebrate assemblage sampling

WHSR monitoring mostly uses a set of probabilistic "Washington Master Sample" sites, which were selected using a Generalized Random Tessellation Stratified (GRTS) spatially-balanced survey design. Sampling among probabilistic sites is limited to freshwater, perennial, rivers and streams. Other selection criteria are defined in the field protocols. The state is divided into eight Status and Trends Regions. We sample approximately 50 sites within each of seven STRs every four years. Results from this monitoring program will help Washington policymakers to prioritize strategies for protection of the chemical, physical and biological integrity of Washington’s rivers and streams.
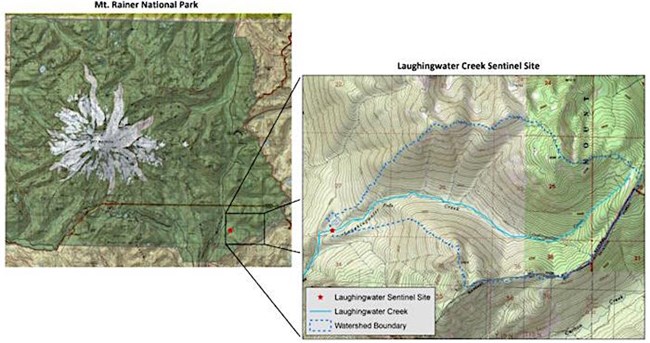
Additionally, annual monitoring among a set of 16 hand-selected “sentinel sites” helps to provide trend information for influences that are not localized. Sentinel sites are located in areas where we expect minimal changes in land uses and where we expect minimal local impacts from human activities. We sample two sentinel sites in each of the eight STRs Results will assist in the interpretation of data from the randomized survey. Laughingwater Creek (Figure 1) serves as one of two sites in the Lower Columbia STR.
Status of the research
Three hundred sixty-six (366) probabilistic sites have been sampled across Washington State since 2009. We have published a status report for the Puget Sound STR. Sentinel sites have been sampled according to the schedule in Table 1; we plan to continue annual sampling.
Table 1. Sentinel sites sampled by year, since 2009.
| STR | Stream | Location ID | 2009 | 2010 | 2011 | 2012 |
| Puget Sound | Griffin Creek | SEN06600-GRIF09 | X | X | X | X |
| Puget Sound | Hamma Hamma River |
SEN06600-HAMM03 | X | X | X | X |
| Coastal | Twin Creek | SEN06600-TWIN02 | X | X | X | |
| Coastal | Ellsworth Creek | SEN06600-ELLS01 | X | X | X | |
| Lower Columbia |
Laughingwater Creek |
SEN06600-LAUG07 | X | X | X | |
| Lower Columbia |
Trapper Creek | SEN06600-TRAP08 | X | X | X | |
| Mid Columbia | Umtanum Creek | SEN06600-UMTA18 | X | X | ||
| Mid Columbia | Cle Elum River | SEN06600-CLEE12 | X | X | ||
| Snake River | Asotin Creek, N. Fk |
SEN06600-ASOT13 | X | X | ||
| Snake River | Panjab Creek | SEN06600-PANJ11 | X | X | ||
| Northeast WA | Sullivan Creek | SEN06600-SULL20 | X | |||
| Northeast WA | Deadman Creek | SEN06600-DEAD19 | X | |||
| Upper Columbia |
Marble Creek | SEN06600-MARB21 | X | |||
| Upper Columbia |
Poorman Creek | SEN06600-POOR22 | X | |||
| Unlisted | Little Pend Oreille River |
SEN06600-LITT06 | X | X | X | |
| Unlisted | Twentyfive Mile Creek |
SEN06600-TWEN05 | X | X | X |
Raw data are available to the public through STREAM database searches. These raw data are used to calculate numerous metrics. A preliminary set of metrics is available on STREAM now. We are still building more metrics, with a large roll-out expected during fall 2013. The bulk of our recent efforts have involved development and management of the database.
We also have collected summertime water temperature data (30-minute intervals) among sentinel sites. We plan to develop these data into metrics.
Results
We sampled Laughingwater Creek in the summers of 2010, 2011, and 2012 (Table 1). To put the data into context we will need to compare them to other data from the project. Once the full set of metrics is built into the STREAM database we will be more adequately equipped to analyze them.
