Last updated: August 23, 2017
Article
Long-term trends in mature and old-growth forests at Mount Rainier National Park

Importance
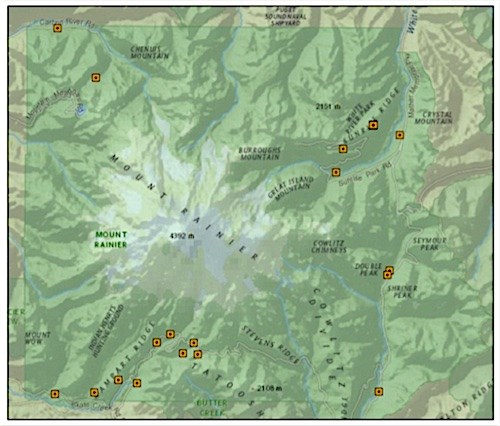
A network of 18 permanent plots in Mount Rainier National Park (MRNP) (Figure 1) is being monitored to provide data on long-term trends in mature and old-growth forests in the Abies amabilis (Pacific silver fir) and Tsuga heterophylla (western hemlock) vegetation zones. The plots were established across a range of elevations and geographic locations in the late 1970’s under the direction of Dr. Jerry Franklin (University of Washington). They are currently managed through the Pacific Northwest Permanent Sample Plot Program at Oregon State University in collaboration with the University of Washington, the US Forest Service, the National Park Service and others. The plots are censused every five or six years, providing long-term records on rates of tree growth, the causes and characteristics of tree mortality, and fine-scale spatial patterns associated with tree recruitment and mortality. These data help quantify levels and dynamics of natural forest structures, provide the definitive measure of long-term forest productivity, and provide a basis for monitoring effects of global climatic change on forests.

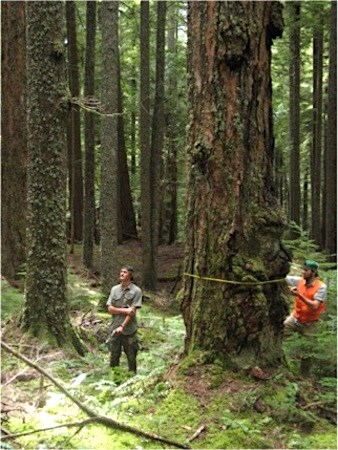
Photo courtesy of Dr. Andrew Larson, University of Montana
Status and Trend
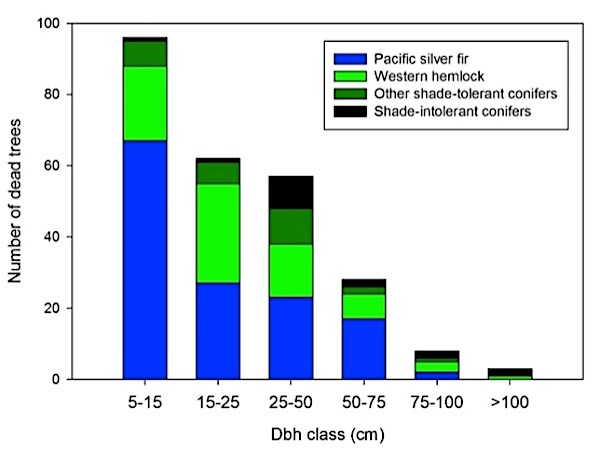
Fifteen of the 18 permanent plots were censused in 2012, thanks to the efforts of students and staff from the University of Washington. Live-tree basal area changed little from the previous census in 2007/2008. Over the 34-36 years since plot establishment, basal area has increased in 13 of the 15 plots (Table 1). In that same time period, live-tree densities have increased 1-103% in six of the plots, and decreased 2-36% in nine plots (Table 1). The 2012 census shows that 252 trees died since the last census, while 108 trees were recruited as ingrowth (trees now surpassing a minimum diameter). Tree mortality was distributed across diameter classes but was concentrated among smaller Pacific silver fir and western hemlock (Figure 3). The dominant causal factors or mechanisms associated with tree death in this census period included bark beetles (25%, primarily the fir engraver, Scolytus ventralis), crushing by other trees or tree limbs (23%), wind (15%), competitive stress (suppression) (8%), and pathogens (8%). Recruitment was dominated by Pacific silver fir (50%) and western hemlock (27%), not surprising given the prevalence of those species in the plots and their tolerance of shade.
Table 1. Tree density and basal area of 15 permanent plots at the time of plot establishment (late 1970's) and in 2012. Forest zone: Abam = Abies amabilis, Tshe = Tsuga heterophylla. Approximate age is at time of plot establishment.
| Plot | Forest Zone |
Approx Age Class (yrs) |
Number of live trees/ha | Basal Area (m2/ha) | ||||
| Initial (1976-78) |
Current (2012) |
% Change |
Initial (1976-78) |
Current (2012) |
% Change |
|||
| AB08 | Abam | 750 | 434 | 488 | 12.4 | 75.3 | 77.2 | 2.5 |
| AE10 | Abam | 300 | 781 | 682 | -12.7 | 93.5 | 99.3 | 6.2 |
| AG05 | Abam | 650 | 890 | 1085 | 21.9 | 82.9 | 90.0 | 8.6 |
| AM16 | Abam | 600 | 841 | 1095 | 30.2 | 63.8 | 67.9 | 6.4 |
| AO03 | Abam | 1000 | 382 | 374 | -2.1 | 100.4 | 106.6 | 6.2 |
| AR07 | Abam | 330 | 487 | 466 | -4.3 | 78.5 | 78.0 | -0.6 |
| AR19 | Abam | 150 | 756 | 722 | -4.5 | 69.5 | 73.1 | 5.2 |
| AV02 | Abam | 1000 | 1034 | 1041 | 0.7 | 76.4 | 79.5 | 4.1 |
| AV06 | Abam | 750 | 1204 | 1259 | 4.6 | 51.5 | 55.4 | 7.6 |
| AX15 | Abam | 150 | 925 | 736 | -20.4 | 71.2 | 79.4 | 11.5 |
| CCNF | Abam | 305 | 364 | 742 | 103.8 | 86.1 | 90.0 | 4.5 |
| SRNF | Abam | 91 | 698 | 448 | -35.8 | 79.8 | 72.2 | -9.5 |
| TA01 | Tshe | 300 | 399 | 372 | -6.8 | 105.9 | 112.8 | 6.5 |
| TB13 | Tshe | 150 | 580 | 394 | -32.1 | 89.3 | 94.6 | 5.9 |
| TO04 | Tshe | 750 | 436 | 426 | -2.3 | 68.3 | 70.1 | 2.6 |

Discussion
With the absence of major disturbance, the permanent plots at MRNP have been stable over time, with most showing modest increases in basal area. Thus, losses due to tree mortality have been more than offset by increases in tree growth and recruitment of new trees, demonstrating that older forests have the capacity for net increases in growth. Results from the 2012 census reflect the diversity of mortality agents at work in these forests, with biotic agents (insects, disease, mistletoe) accounting for most of the recent mortality but physical damage (crushing, etc.) and weather-related causes also contributing substantially.

Tree mortality introduces complexity in a forest stand by creating openings and freeing up resources for other trees or species, thereby contributing to the stand’s structural, compositional and spatial heterogeneity. One of the values of maintaining and monitoring permanent plots is the ability to document what these changes look like over time. For example, is the recent activity of fir engraver beetles a short-term phenomenon, an ongoing low-level source of tree mortality, or indicative of a larger outbreak? With continued monitoring, the permanent plots will give us insights on these and other questions.
Further Reading
Acker, S.A., J.F. Franklin, S.E. Greene, T.B. Thomas, R. Van Pelt, K. Bible. 2006. Two decades of stability and change in old-growth forest at Mount Rainier National Park Larson and Franklin. Northwest Science 80(1): 65-72.
Larson, A.J. and J.F. Franklin. 2010. The tree mortality regime in temperate old-growth coniferous forests: the role of physical damage. Canadian Journal of Forest Research 40: 2091-2103.
