Last updated: August 16, 2017
Article
Forecasting the future of Pacific Northwest forests
Importance
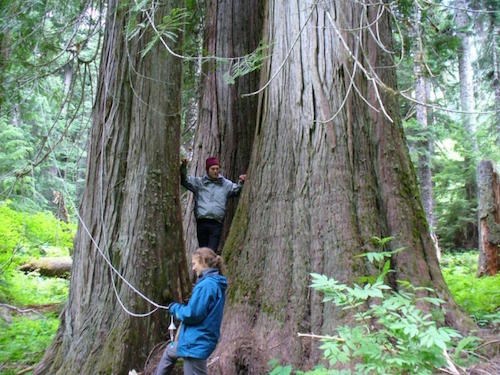
Old growth forests in western Washington, including those in Mt. Rainier National Park, provide important ecosystem services (resources and functions of value to humans). Specifically, forests house endangered species (e.g. the Northern Spotted Owl), sequester carbon (thus mitigating the negative impacts of fossil fuel consumption), and stabilize water supply (e.g. the Nisqually River, which has its headwaters in Mount Rainier National Park, provides Tacoma with hydropower through the Alder Lake Dam). Also, old growth forests provide aesthetic and spiritual pleasure to both local and international visitors to Mount Rainier National Park.
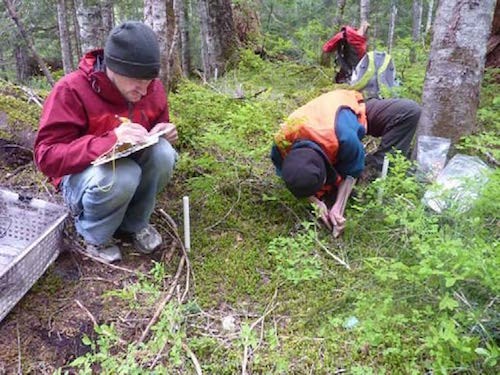
Picture 1. Undergraduate field assistants Mitch Piper and Anna O’Brien quantify seedling germination in a meter squared plot (marked by white pvc pipes). The laundry basket next to Mitch Piper is a seed trap (which allows us to measure seed production). A small microclimate sensor is visible right on the forest floor in front of Anna O’Brien, this sensor monitors hourly temperature and allows us to identify when snow disappears from our seedling quadrat.
Status and Trend
Climate change has caused temperatures to rise by ~ 0.75 °C in the last century, and an additional 2-4°C warming is predicted in the next 100 years (Mote & Salathé 2009) as greenhouse gases continue to increase. Rising temperatures are likely to affect other climatic parameters, including snowpack (declining), date of snow meltout (earlier), severe frost events (fewer) and summer droughts (increasing). These changes will influence forests in Mt. Rainier National Park, likely by causing the distributions of tree species to shift upwards and therefore, forest communities to reassemble. However, these changes may not simply be predictable by the amount of warming for two reasons. First, changes to forest communities might lag rapid rates of warming, if forest tree responses are slow. Second, if species differ in their sensitivity to climate change, species responses will be individualistic and community shifts may be idiosyncratic.
Picture 2. Graduate student Ailene Ettinger and undergraduate field assistant Jonathan Deschamps install a temperature sensor in one of the eighteen forest stands in which the HilleRisLambers lab monitors tree performance and microclimate. Temperature sensors need to be suspended from tree branches at least 20 feet above the forest floor, so they do not get covered by snow, which would prevent accurate measurements of air temperature.
Discussion
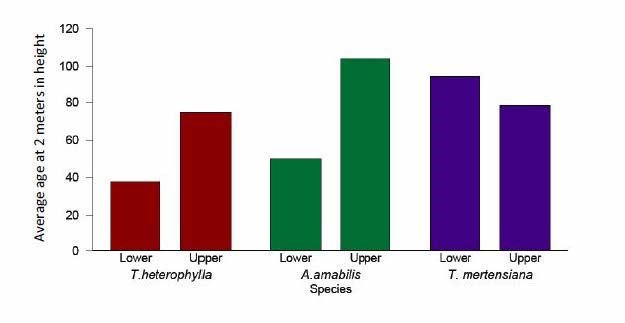
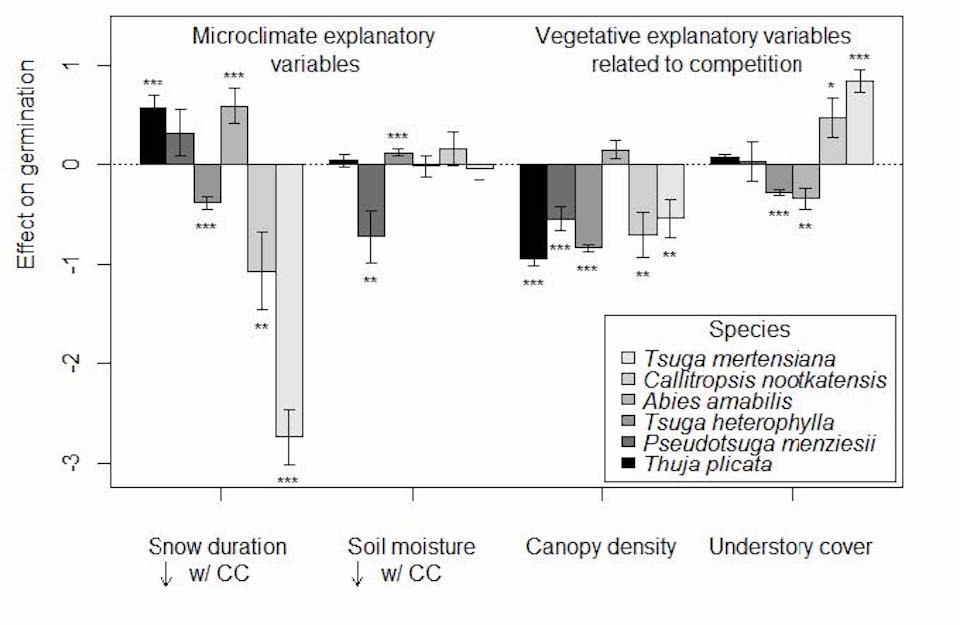
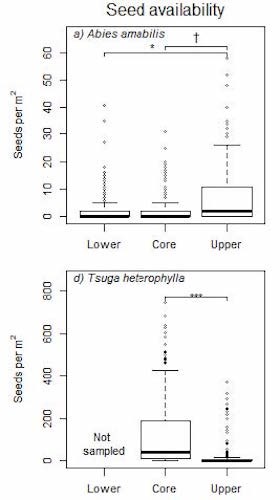
Research by the HilleRisLambers lab at Mount Rainier National Park (Biology Department, University of Washington) explores these issues by linking tree performance (e.g. tree growth, seed production, seedling germination – Picture 1 & 2) to climate (e.g. snow duration, temperature). Thus far, our research demonstrates that growth of trees at treeline is particularly sensitive to snowpack and growing season length, implying shifts in treeline with warming (Table 1). However, seed production beyond species range limits is low (Figure 1) and trees have very long generation times (Figure 2), implying responses to warming may be slow. Finally, species differ in the identity of climatic factors influencing performance, as well as the strength of their effects, both as seedlings (Figure 3) and adult trees (Table 1). In all, these results imply that shifts in forest composition with warming may be idiosyncratic and difficult to predict.
Figure 1. Seed availability across species ranges for Abies amabilis and Tsuga heterophylla. Analyses are limited to stands where parent trees were present. The lower range of Tsuga heterophylla extends below our study area and is therefore not sampled. Horizontal bars and asterisks and/or crosses indicate significance levels († = P<0.10; * = P<0.05; ** = P<0.01; *** = P<0.001). Abies amabilis and Tsuga heterophylla are the most abundant species in the study locations and reflect patterns observed in the other species.
Table 1. Combination of climatic variables constraining growth of species at their upper range limits, and thus climatic variables most likely to constrain range expansion with climate change. Signs in parentheses indicate the direction of effect (i.e. a + indicates an increase in the climatic variable increases growth, a – indicates that an increase in the climatic variable decreases growth). Bolded variables identify climatic variables that have particularly large effects. Species are listed in order of elevational range extent, with species occurring at the highest elevation listed last.
| Species | Climatic variables (s) |
| Western red cedar | Growing Degree Days (+), Growing Season Precipiatation (+) |
| Douglas fir | Growing Degree Days (-), Snow Water Equivalent (+) |
| Western hemlock | Snow Water Equivalent (+) |
| Silver fir | Snow Water Equivalent (-) |
| Alaska cedar | Growing Degree Days (+), Snow Water Equivalent (-) |
| Mountain hemlock | Growing Degree Days (+), Snow Water Equivalent (-) |
