What is the Salmon River’s water quality? How is it measured?
Project Dates
Ongoing since 2010
Did You Know?
The ancestral Salmon River of 250 years ago, fed by glacial meltwater and a huge ice-dammed lake in the Beartrack Valley as well as run-off from Excursion Ridge, was much bigger than it is today. The river braided back and forth across a barren landscape, depositing gravel and sand, and created the eastern part of what is today’s community of Gustavus. The river settled into its present course around 150 years ago.
What is SEAN?
The Southeast Alaska Inventory and Monitoring Network (SEAN) is one of 32 networks across the United States that further NPS efforts to improve park management through greater reliance on scientific information. SEAN supports the three national park units in Southeast Alaska (Glacier Bay, Sitka and Klondike Gold Rush); its offices are located in Juneau. The Inventory and Monitoring Program designs and implements long-term ecological monitoring and provides results to park managers, science partners, and the public. The intent is to provide periodic assessments of critical resources to evaluate the integrity of park ecosystems and better understand ecosystem processes.
Introduction

SEAN has prioritized Freshwater Water Quality as one of 12 Vital Signs for long-term ecological monitoring based on its vulnerability to alteration by human stressors and sensitivity for detecting fundamental environmental changes. Trends in water quality can signify chronic or developing watershed issues.
Freshwater quality is critical to understanding and tracking the health of aquatic and terrestrial ecosystems. Park managers are concerned with potential threats to water quality from climate change, visitor impacts, and atmospheric contaminants. The main objective of this monitoring program is to collect continuous data on core water quality parameters in order to describe seasonal and annual variation as well as long-term trends. These data will also inform management decisions, assist researchers, and help determine compliance of freshwater quality with state and federal regulations.
Methods
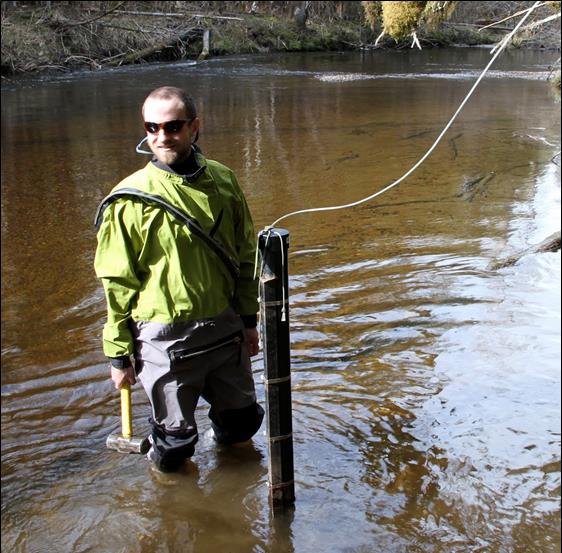
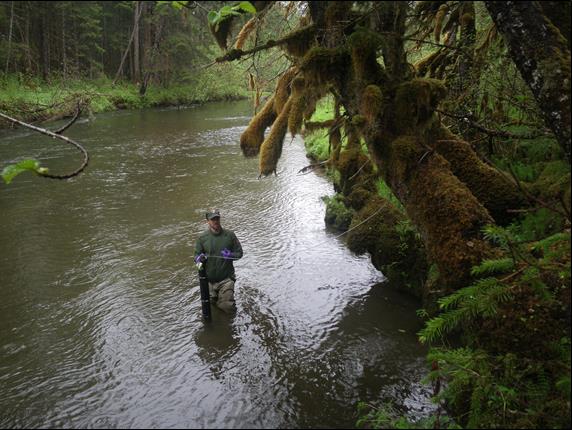
Water quality in the Salmon River is monitored by a small, automated unit, called a sonde. Each spring, the researchers install the sonde in one location along the river, just within the park boundary (about 9 km from the river mouth) on approximately May 1. They monitor it periodically through October 31, when it is removed for the winter. The sonde measures and logs water temperature, pH, dissolved oxygen, and conductivity each hour.
Data from this program will be integrated with results from related programs, including streamflow, freshwater benthic macro-invertebrates and algae, freshwater contaminants, and climate monitoring.
In the future, SEAN staff hope to pursue year-round temperature monitoring in multiple park streams to obtain a better sense of long-term trends across a much larger area.
Findings

In 2012, water quality parameters (water temperature, pH, dissolved oxygen, pH, and conductivity) were successfully collected hourly from April 25 to October 31 at the Salmon River location. This was the third year of successful water quality data collection on the river.
The river demonstrated seasonal temperature trends generally similar to 2010 and 2011. 2012 daily mean water temperature ranged from 2.0 to 9.8°C, peaking on August 7. Summer daily mean water temperatures were slightly cooler than in previous years. Patterns in the medians and distributions of pH, dissolved oxygen, and conductivity were similar to previous years.
No observed values or trends appeared to signal point source pollution or a change to the fundamental water quality of the Salmon River. Throughout the monitoring period, the river exhibited water quality conditions within expected normal ranges.
Learn More
“Southeast Alaska Network Freshwater Water Quality Monitoring Program, 2012 Annual Report” by Christopher Sergeant and William Johnson, 2013. This report and all SEAN water quality data and related products can be viewed on the SEAN Streamflow and Water Quality webpage.
Last updated: September 15, 2016
