Part of a series of articles titled NPS Alaska Region Fire Ecology Annual Report for 2017.
Article
Fire Ecology Annual Report 2017 - Monitoring and Inventory
Monitoring and Inventory
Monitoring and inventories are utilized by the fire ecology program to provide feedback to the NPS fire management program on activities such as fuels treatments and to continue to gain a better understanding of the effects of wildfire on the landscape. Table 2 provides a list of the number of plots measured in 2017 and the total number of fire/fuels monitoring or inventory plots established in Alaska parks since 2003.
During 2017 the NPS Alaska fire ecology program measured plots in an area that recently burned twice in Wrangell-St. Elias and re-measured long term tundra fire plots in Noatak. Brief descriptions and preliminary results from the two monitoring projects are provided below.
| Park | Monitoring Unit | Type of Plot (FMH, photo point, other) | Pre-burn/TX2017 | 1yr Post 2017 | Post (2-20yrs) 2017 | Annual Total | Total Plots |
|---|---|---|---|---|---|---|---|
| Lake Clark | Currant Cr Fire 2013 | CBI, AKR Fire & Fuels Plots | - | - | - | - | 43 |
| Lake Clark | Kristin Cr Fire 2013 | CBI & Cover | - | - | - | - | 7 |
| Wrangell-St. Elias | Carl Cr RX | AKR Carl Cr Plots | - | - | - | - | 29 |
| Wrangell-St. Elias | Chakina Fire 2009 | CBI & Cover | - | - | - | - | 56 |
| Wrangell-St. Elias | Chakina 2009/Steamboat2016 | AKR Fire & Fuels Plots | - | 26 | 16 | 42 | 42 |
| Wrangell-St. Elias | Susan Smith - Hazard Fuels Plots - TX | AKR SS Hazard Fuels Plots | - | - | - | - | 13 |
| Wrangell-St. Elias | Headquarters - TX | AKR Hazard Fuels Plots | - | - | - | - | 19 |
| Wrangell-St. Elias | Fire Effects - Paired Plots | AKR Paired Plots | - | - | - | - | 2 |
| Wrangell-St. Elias | McCarthy University Subdivision - TX | AKR Hazard Fuels Plots | - | - | - | - | 27 |
| Yukon-Charley Rivers | 2004 Woodchopper Fire | AKR Fire & Fuels Plots | - | - | - | - | 7 |
| Yukon-Charley Rivers | 1999 Witch Fire | Fire effects - other | - | - | - | - | 15 |
| Yukon-Charley Rivers | 2004 Fire - Paired Plots | AKR Paired Plots | - | - | - | - | 5 |
| Yukon-Charley Rivers | 1999 Fires Landcover - CBI | AKR Fire & Fuels Plots | - | - | - | - | 30 |
| Denali | Headquarters - TX | AKR Hazard Fuels Plots | - | - | - | - | 27 |
| Denali | VDM Highpower Fire Reburns | AKR Fire & Fuels Plosts | - | - | - | - | 10 |
| Denali | Landcover - CBI | AKR Fire & Fuels Plots | - | - | - | - | 55 |
| Denali | Beaver Log Fire 2013 | CBI & Cover | - | - | - | - | 13 |
| Denali | Toklat R. East Fire 2013 | CBI & Cover | - | - | - | - | 25 |
| Noatak | 2010 Fires | CBI & Cover | - | - | - | - | 34 |
| Noatak | 2004 Uvgoon Fire | AKR Fire & Fuels Plots | - | - | - | - | 6 |
| Noatak | 2012 Uvgoon/Kungiakrok Fires | CBI & Cover | - | - | - | - | 22 |
| Noatak | 1977 Fires Racine Plots | Racine Plots | - | - | 8 | 8 | 8 |
| Bering Land Bridge | 1977 Fire Racine Plots | Racine Plots | - | - | - | - | 8 |
| Bering Land Bridge | Fairhaven Ditch Cabins - TX | AKR Hazard Fuels Plots | - | - | - | - | 4 |
| Total | - | - | - | 26 | 24 | 50 | 507 |
Wrangell-St. Elias Repeat Fires – Chakina and Steamboat Creek
Spruce forests in Interior Alaska generally have a fire return interval (the time between successive fires) between 60-150 years. The Southcentral boreal forests of Wrangell-St. Elias generally have a longer time between fires, approximately 150-200 years. So when the 2016 Steamboat Fire ignited and burned nearly 18,000 acres within an area of Wrangell-St Elias that had previously burned in 2009, fire managers and park staff were interested to know what was burning and the potential impacts of the shortened fire return interval (just seven years) on the landscape. Plots established to monitor burn severity and effects of the 2009 Chakina Fire provided a foundation to determine what was burning in the 2016 Steamboat Fire. During this past summer (2017), Alaska Region fire ecology program and USGS researchers measured 42 plots in areas that were once- and twice-burned to assess the effects on vegetation and soils.
Monitoring goals for the project were to determine what fuels and vegetation carried the second fire and how once and twice burned sites may vary in recovery. The objectives of the study were to:
- Document vascular and non-vascular plant cover changes
- Monitor tree seeding establishment
- Document changes in tree densities by diameter size class
- Document changes in active layer deptch and soil temperatures
| Time Since Fire (Graph Label) | Year Sampled | Black Spruce Plot Numbers | White Spruce Plot Numbers |
|---|---|---|---|
| Pre-Burn (PreBurn) | 1997, 1998, 2009 | 15 | 7 |
| Post Burn 1 Year (BurnYr01) | 2010 | 2 | 5 |
| Post Burn 8 Years (BurnYr08) | 2017 | 9 | 7 |
| Twice Burned 1 Year (Burn2Yr1) | 2017 | 10 | 16 |
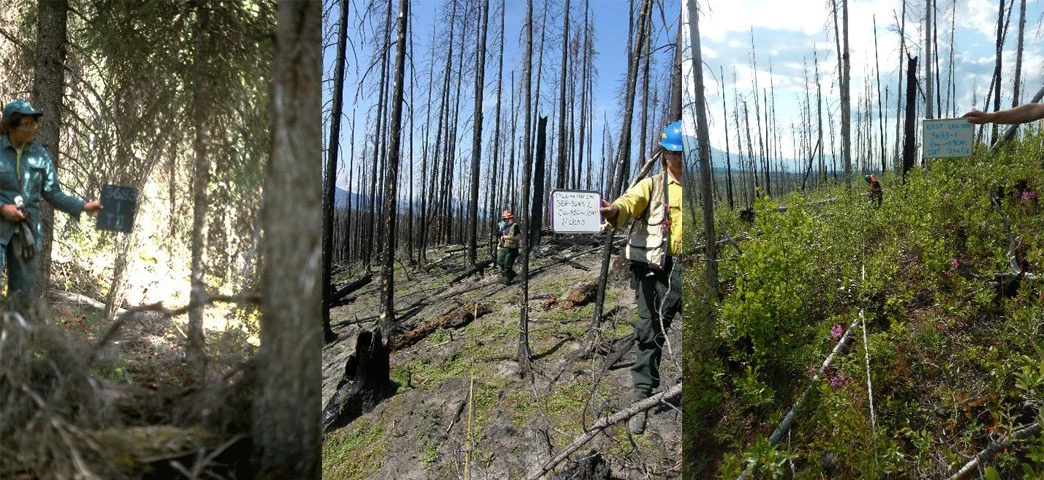
NPS photo
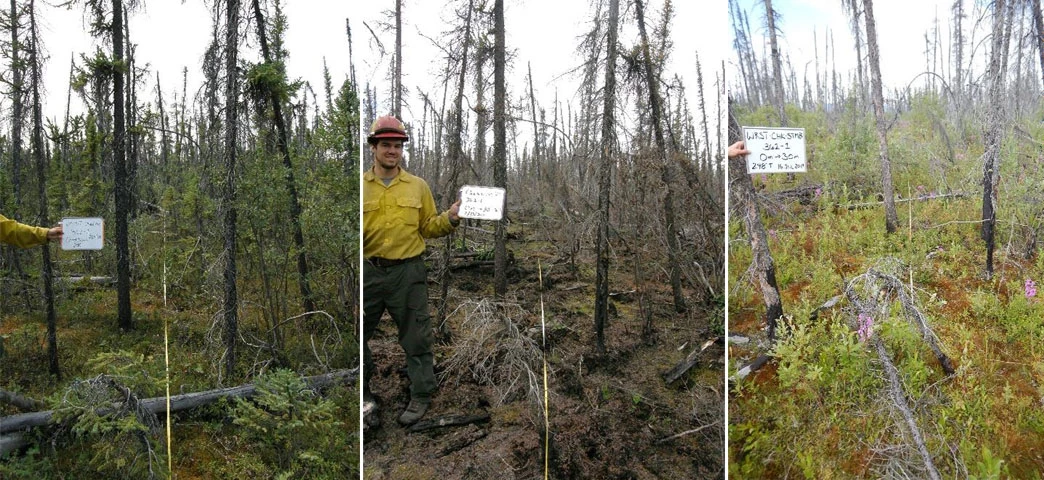
NPS photo
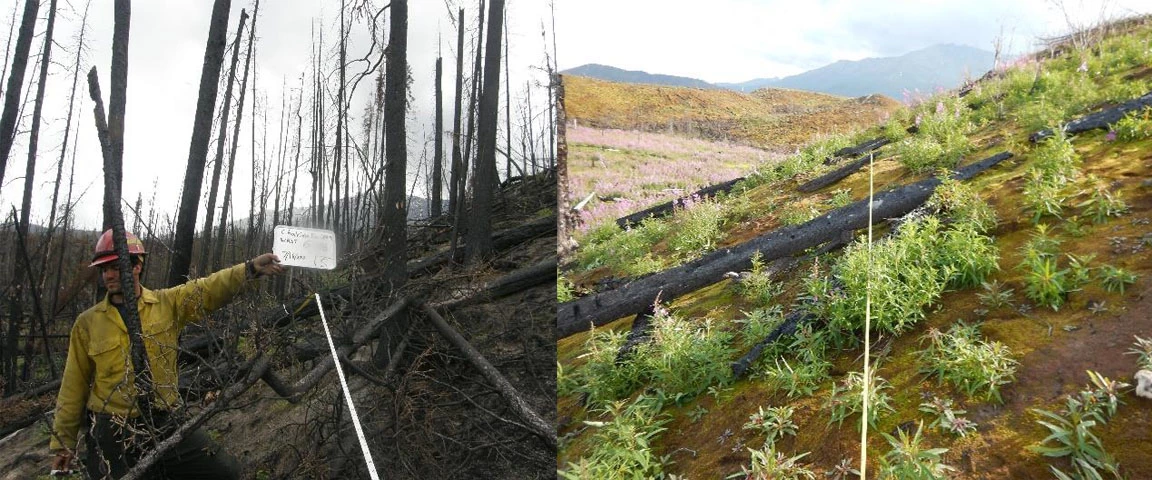
NPS photo
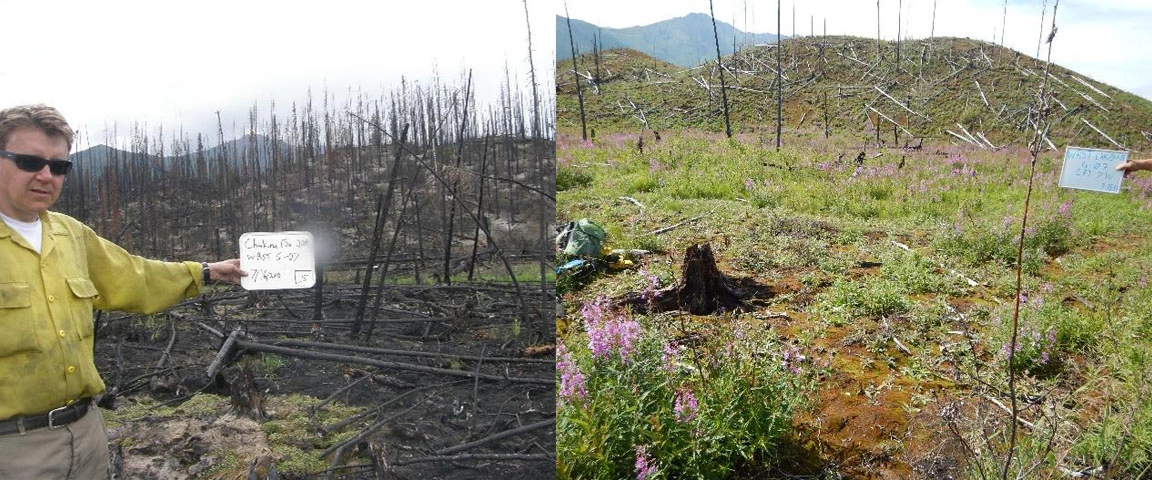
NPS photo
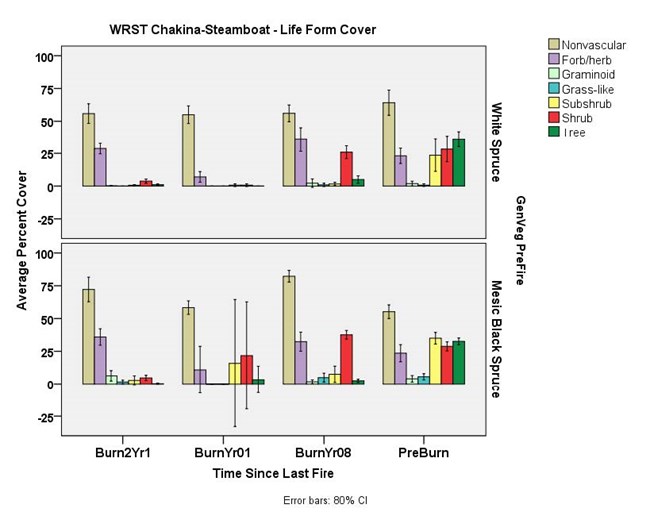
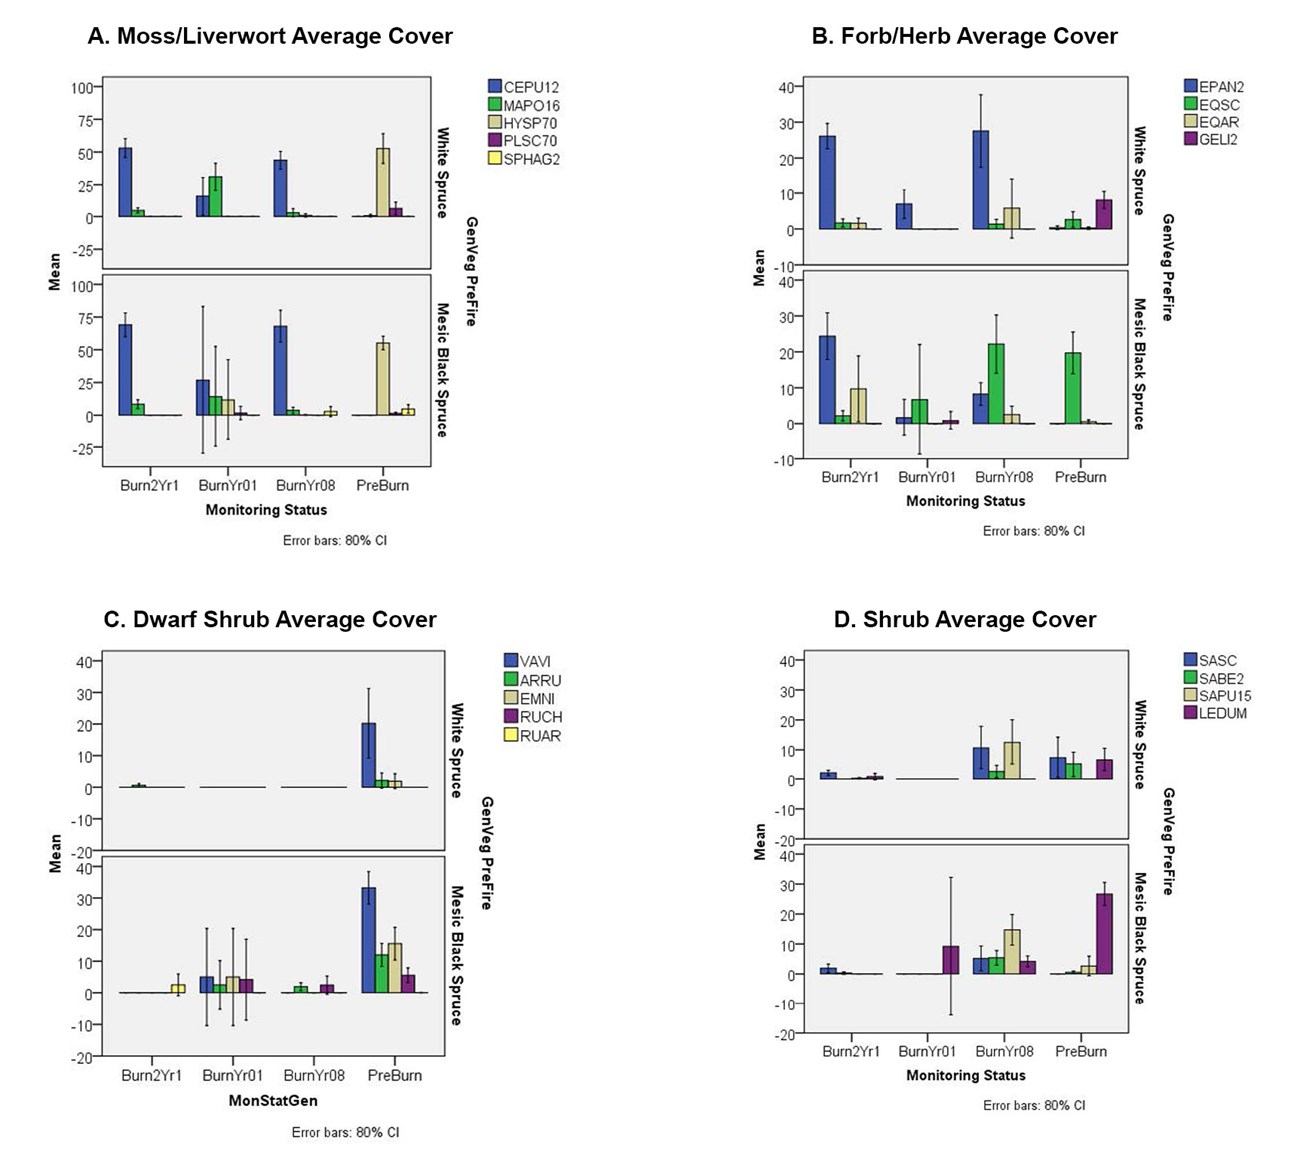
The plots sampled were of two general vegetation types prior to the fires - upland white spruce (Figures 3 and 5) and mesic black spruce (Figures 4 and 6), and as show in Table 2. The general changes in vegetation cover by dominant life form are shown in the graph in Figure 7, while Figure 8 shows the average cover of the common species of the non-vasculars, herbaceous plants, dwarf shrubs, and shrubs at the sites. One year after the initial fire the live tree cover was reduced to nearly zero percent cover. Most of the late successional feathermosses (Hylocomnium splendens HYSP70) were consumed and early successional mosses (Ceratadon purpureus CEPU12) and liverworts (Marchantia polymorpha MAPO16) (Figure 8A) and some fireweed (Epilobium angustifolium EPAN2) (Figure 8B) were establishing one year after the first fire. Eight years after the 2009 fire the upland white spruce plots had a dense cover of fireweed (average cover 27%), willow (Salix spp) (26%), with aspen and young white spruce trees establishing in the understory. The black spruce sites had more horsetails (Equisetum spp.) (22% cover) and Labrador tea (Ledum palustre) (4% cover) established than the white spruce sites. The dwarf shrub (subshrub) cover was reduced at both the black and white spruce sites after the fire.
The down trees and the dead thatch of fireweed from prior year’s growth likely provided the fuel for the 2nd fire to burn. The second burn consumed much of the smaller dead and down woody material (1 – 10 hour fuels), and at some sites even consumed some of the larger diameter down woody debris (100 and 1000 hour fuels). At many of the twice burned sites the ground was carpeted by early successional mosses (Ceratadon purpureous and Marchantia polymorpha). Fireweed seedlings and re-sprouts were prevalent, some willows and aspen were still able to re-sprout at the twice burned sites. Overall there was more vascular and non-vascular plant cover at the twice burned sites one year after the second fire, than was found one year after the first fire (See Figures 5 and 6 photos and Figure 7 graph).
Tree seedlings are important for the future forest that will occur after a fire. The average density of tree seedlings was quite variable (Table 4) among the plots and across the time since fire. Only 7 sites were sampled for tree seedlings in 2010, however none of the plots had seedlings present one year after the initial fire. Eight years after the fire more trees reproduction was evident. The white spruce sites were dominated by deciduous tree regeneration, primarily aspen (Populus tremuloides) with an average of 44,642 (80% CI 14,009 - 75,274) aspen “seedlings” per hectare. White spruce seedlings were present as well with an average of 2,730 (80% CI 237 - 5,222) seedlings per hectare. The black spruce sites eight years after the fire had a high level of white spruce seedlings present along with black spruce and aspen establishing (Table 4). The identification of spruce seedling species can be problematic, so there could be some errors in the species identifications.
Preliminary analysis indicates that even with a second burn, some black spruce seedlings survived or regenerated after the second fire. The dominant seedling trees were re-sprouting aspen. The average density of aspen “seedlings” at the twice burned white spruce sites was 6,824 aspen/hectare and at the black spruce sites had an average of 2,017 aspen/hectare.
| Forest Type and Time Since Fire | Number of Plots | White Spruce Seedlings/Hectare (80% Confidence Interval) | Black Spruce Seedlings/Hectare (80% Confidence Interval) | Deciduous Tree Seedlings/Hectare (80% Confidence Interval) |
|---|---|---|---|---|
| White Spruce Plots Pre-Burn | 7 | 1,561 (823 - 2,299) | 56 (0.05 - 113) | 741 (210 - 1,270) |
| White Spruce Plots Post Burn 1 Year | 5 | 0 | 0 | 0 |
| White Spruce Plots Post Burn 8 Years | 7 | 2,730 (237 - 5,222) | 0 | 44,642 (14,009 - 75,274) |
| White Sprice Plots Twice Burned 1 year | 15 | 0 | 354 (-122 - 829) | 6,824 (2, 320 - 11,327) |
| Black Spruce Plots Pre-Burn | 15 | 42 (-3 - 88) | 22,485 (16,599 - 28,371) | 0 |
| Black Spruce Plots Post Burn 1 Year | 2 | 0 | 0 | 0 |
| Black Spruce Plots Post Burn 8 Years | 9 | 22,308 (13,473 - 31,144) | 10,144 (3,420 - 16,867) | 15,080 (9,975 - 20,185) |
| Black Spruce Plots Twice Burned 1 Year | 10 | 0 | 106 (-40 - 253) | 2,017 (789 - 3,244) |
Noatak Tundra Fire Long Term Monitoring
Dr. Charles Racine and colleagues established a series of tundra post-fire vegetation and permafrost monitoring sites within two Alaska parks - Bering Land Bridge and Noatak during the late 1970s and early 1980s. These sites have been monitored several times over the past 40 years and provide the longest set of monitoring data for tundra fire effects study in Alaska.
In 1978 Racine and others established 8 permanently marked plots in a 1977 fire along a topographic gradient on Nimrod Hill, on the east side of Imuruk Lake in Bering Land Bridge NPr (BELA). Pre-fire data was available from a 1973 soils and vegetation survey. The Nimrod Hill BELA plots were re-measured in 1979, 1981, 1983, 2001, and 2002. As part of the Arctic Network Inventory & Monitoring Program, Racine and NPS fire personnel re-measured the plots in 2009.
Following the study in BELA, the same researchers established tundra fire plots in Noatak NPr (NOAT) during 1981 and 1982. Eight sites were established in areas of varying time since fire, ranging from 4 weeks post fire, 4-5 years and 10 years post fire (1972, 1977 and 1982 fires). These sites were not re-measured again until 2005. As part of the Arctic Network Inventory & Monitoring Program (ARCN), Racine and NPS fire personnel relocated and re-measured the Noatak fire plots in 2005. These plots were monitored again in 2017 by ARCN and NPS fire staff. Some of the sites have burned again since the early fires.
For both study areas, 10 1-m x 1-m quadrats were sampled per plot. Data collected within the quadrats include: ocular estimates of vascular and non-vascular species cover, maximum height and stem density estimates of selected shrubs, tree density, active layer depth measurements, site descriptions (soil samples in 1981-82), and photographs.
The purpose of these ground-based permanently marked fire effects plots were to detect major changes in structure and composition of vegetation within the representative areas. This includes changes in the cover of vascular plants by species or lifeform, changes in cover of non-vascular plants by selected species or groupings, changes in density of trees and heights of shrubs, and changes in active layer depth over time.
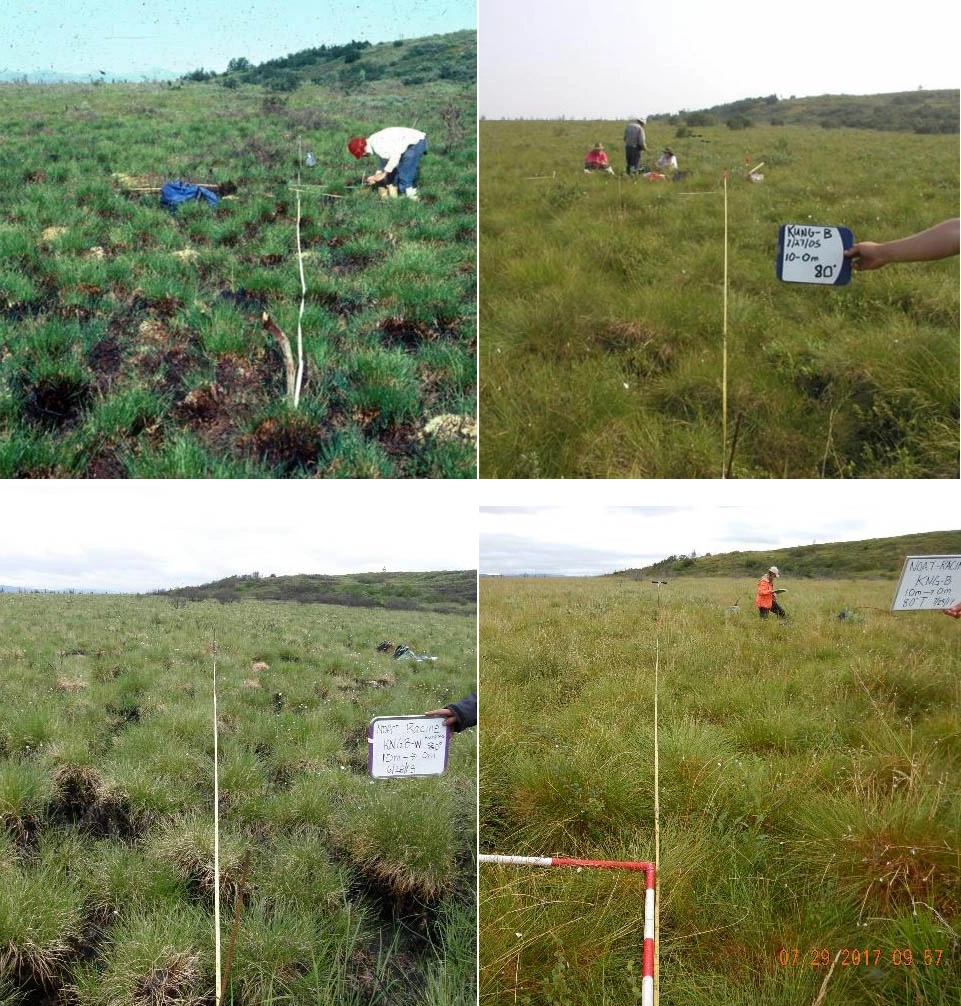
For preliminary analyses the data from the Noatak Racine plots was summarized by average cover by lifeform in three major categories: unburned, burned once and twice burned. The data was then divided into groups of time since the last fire or measurement for the unburned plots (Table 5). The unburned sites had the lowest forb cover, but conversely had the greatest shrub cover. For the once burned sites, the early years after the fire there were more true grasses and rushes (graminoids), which significantly declined by 20 years post fire. Shrubs and dwarf shrubs increased by 20 years post fire in both the once and twice burned sites and appear to be similar to the average cover of shrubs in the unburned plots. It appears that the twice burned plots have greater cover of tussock forming sedges (Eriophorum vaginatum and Carex bigelowii) than the once burned and unburned sites (Table 5 and Figure 9).
These sites have been incorporated into the Arctic Network long term monitoring protocols for future monitoring.
| UnBurned | n | Forb/herb | Graminoid | Sedge | Dwarf Shrub | Shrub |
|---|---|---|---|---|---|---|
| 1982 | 2 | 0.2 (-0.3-0.6) | 0 | 32.7 (-14.7-80.1) | 3.4 (-6.9-13.6) | 36.4 (7.6-65.3) |
| 2005, 2017 | 3 | 1.0 (0.02-2.0) | 0.1 (-0.1-0.3) | 31.2 (22.5-39.9) | 7.4 (s.1-11.7) | 42.1 (35.3-49.0) |
| Burned Once | - | - | - | - | - | - |
| PostBurn 0-10 years | 8 | 4.2 (2.2-6.3) | 7.9 (4.0-11.8) | 25.7 (15.4-36.0) | 2.1 (0.5-3.7) | 10.2 (6.7-13.6) |
| PostBurn 20-30 years | 5 | 7.9 (3.5-12.3) | 0.8 (0.2-1.4) | 31.4 (13.9-48.9) | 6.6 (1.6-11.7) | 39.3 (8.0-70-6) |
| PostBurn 40 years | 4 | 8.6 (3.2-13.9) | 0.2 (0.03-0.4) | 26.7 (9.6-43.8) | 6.6 (1.7-11.4) | 39.3 (8.0-70.6) |
| Burned Twice | - | - | - | - | - | - |
| Twice Burn 0-5 years | 2 | 1.7 (1.5-1.8) | 1.5 (-0.2-3.3) | 67.2 (-7.9-142.0) | 0.03 (-0.05-0.1) | 5.2 (-5.6-16.1) |
| Twice Burn 20-30 years | 2 | 2.3 (1.0-3.6) | 0.8 (0.3-1.2) | 52.5 (6.6-98.4) | 5.3 (4.9-5.7) | 40.6 (14.4-66.7) |
Data Management
Data for all 2017 monitoring projects have been entered into FFI (FEAT/FIREMON Integrated) - a plot-level monitoring sequel server software tool designed to assist managers with collection, storage and analysis of ecological information (http://www.frames.gov/partner-sites/ffi/ffi-home/). Digital archives and metadata for the AK databases were uploaded to the NPS Data Store IRMA in January 2017. The Alaska Eastern Area fire ecology data set is located here and includes data for YUCH and WRST: https://irma.nps.gov/DataStore/Reference/Profile/2249969 and the Alaska Western Area fire ecology data set includes data for DENA, NOAT, BELA, and LACL: https://irma.nps.gov/DataStore/Reference/Profile/2249968. The updated FFI databases reflect the recent data additions and QC to the AK NPS fire ecology databases (Table 6).
| Park/Project | % 2017 Data Entered | % 2017 Data Quality Checked | # Prescribed Fires Monitored | # Non-fire Fuels Treatments Monitored | #Wildfires Monitored | # BAER Treatments Monitored |
|---|---|---|---|---|---|---|
| Wrangell-St. Elias Chakina/Steamboat - Repeat Fire Plots | 100 | 100 | 0 | 0 | 1 | 0 |
| Noatak (Racine) Long-term Tundra Fire Effects | 100 | 100 | 0 | 0 | 1 | 0 |
NPS photo
Last updated: October 26, 2021
