Last updated: January 12, 2023
Article
Monitoring Avian Productivity and Survivorship of Birds of Conservation Concern at Bandelier and Mesa Verde

NPS
Introduction
The Southern Colorado Plateau Inventory and Monitoring Network (SCPN) monitors birds via point counts in places where plant communities are also monitored. This monitoring allows scientists to track bird numbers, diversity, and habitat relationships. However, point count monitoring is less able to identify reasons for observed changes in bird diversity or abundance. The Monitoring Avian Productivity and Survivorship program (MAPS) is complementary in that regard. It collects demographic data such as bird reproduction and survival rates. Such information helps managers understand what might be causing population trends detected by point count monitoring.
In 2010, Bandelier National Monument (NM) and Mesa Verde National Park (NP) implemented MAPS programs. Bandelier NM installed three MAPS stations in mixed conifer forests and Mesa Verde NP installed three in pinyon-juniper woodlands. Their goal was to detect changes in bird demographics and examine how climate conditions relate to the survival of recently fledged birds.
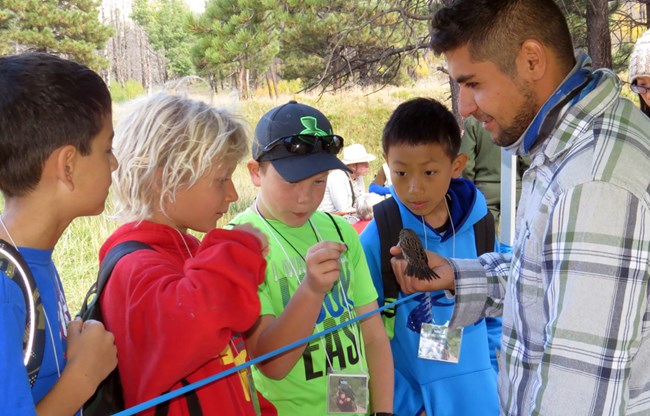
The project also has an educational component. Bandelier NM has entered into a cooperative agreement with The Nature Conservancy to recruit interns from Mexico and Spanish speaking Latin America. The interns will be housed at the park and undergo training in bird banding and identification. They then assist in the operation of the MAPS stations and in delivering educational programs about migratory birds for local school children in grades 4-8.
Background
Demographic information is critical for determining the health of bird populations. To collect this information, monitoring efforts need to focus on measuring life-history, or vital rates, such as the number of adults that survive each year, the number of young produced per adult each year, the probability of a young bird surviving to its first breeding season, and the probability that a surviving adult will return to the same site to breed the next year.
These vital rates are important because they:
- are directly affected by environmental stressors and management actions, often with very little time elapsed
- can help to pinpoint which stage of the life cycle is being affected
- provide information about the viability of the population being monitored and indirectly about the quality of the habitat in which it occurs
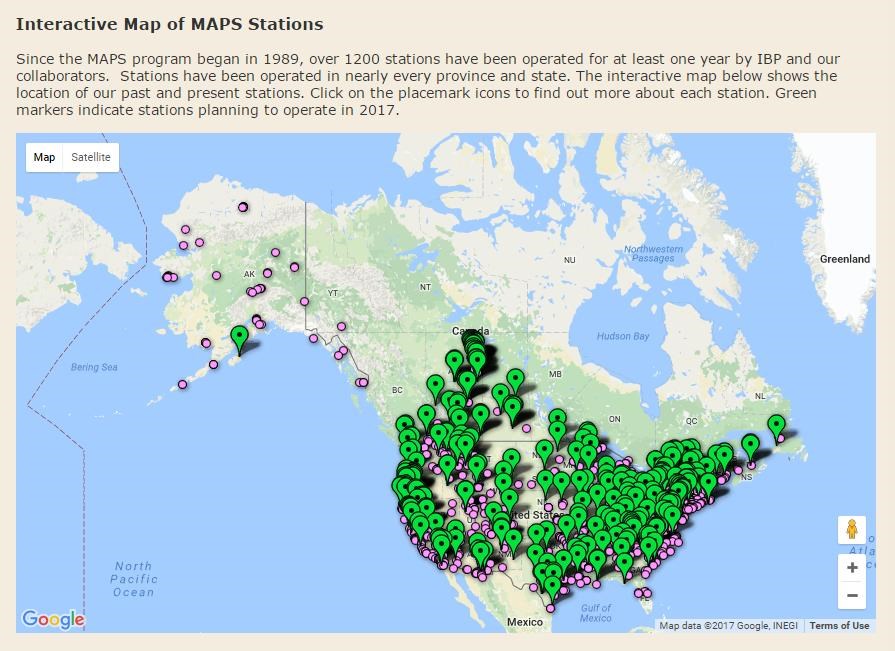
The MAPS program was developed by the Institute for Bird Populations (IBP) and first implemented in 1989. A cooperative project involving public agencies, private organizations and volunteers, it has involved more than 1200 sites across the U.S. and has three tiers of objectives: monitoring, research, and management.

Monitoring. MAPS monitors over 100 target species, including neotropical-wintering migrants, temperate-wintering migrants, and permanent residents. By collecting data on the proportions of young and adult birds captured, MAPS can develop indices of adult population size and post-fledging productivity. Data from the recapture of adult birds will yield estimates of adult population size, adult survival rates, proportions of residents, and recruitment into the adult population. These results are generally summarized at a regional scale to describe year-to-year changes in a species’ vital rates.
Research. MAPS data is used to identify and describe temporal and spatial patterns in these population indices, estimate, vital rates and how these patterns are related to the ecological characteristics and population trends of the target species, as well as local and landscape level habitat characteristics and climate variables.
Management. When changes in the populations of target species occurs, managers can use these patterns and relationships to:
- determine at what point in a bird’s life cycle there may be problems
- devise a prescription of management actions and conservation strategies to address these problems, reverse population declines, and stabilize populations
- implement these actions and strategies in an adaptive management framework and evaluate their effectiveness
Methods
MAPS follows a standardized constant-effort mist-netting protocol across a network of stations. Typically, each station consists of ten net-sites laid out rather uniformly within the interior eight acres of a 20-acre study site. One mesh mist net is operated at each net site for six hours per day, for one day during each of six to ten consecutive 10-day periods. The start date varies by site and usually occurs between May 1 and June 10 (later at more northerly latitudes and higher elevations). Monitoring continues through the ten-day period ending August 8.
For each bird captured, the following data must be collected:
- species
- age
- sex
- band number
If the bird is not banded, a band with a unique number will be affixed to its leg. In addition, for every bird heard, seen or captured, probable breeding status is determined. Vegetation data is also collected. A map is created for each station with extent and descriptions of each habitat type found within the station. Finally, all data must be verified and entered into a database, and then submitted to IBP.
From the data collected, IBP is able to calculate, at a regional scale, productivity indices, such as the proportion of young in the catch and adult survival rates, using modified mark-recapture models (Clobert et al. 1987, Pollock et al. 1990, Lebreton et al. 1992).
Anticipated results
While Mesa Verde NP is no longer participating in the MAPs program, data from the MAPS stations in Bandelier NM will contribute to improving our regional and continental understanding of the health of bird populations. In addition, the project will provide New Mexico school children (grades 4-8) with experiential environmental education that will teach them about animal-habitat relationships, potential climate-related impacts on habitats and birds, and problem-solving techniques through bird-related field trips and classroom presentations.

NPS
"I learned the skin is transparent and you can see their skull when you look at their head carefully. You can also tell if the bird is old or young by looking at their wings. Some birds only live for 2 years, but some for 62 years, it really depends on the type of bird and how much food, water, and shelter there is."
- Student participant
References
Clobert, J., Lebreton, J.-D. and Allaine, D. 1987. A general approach to survival rate estimation by recaptures or resightings of marked birds. Ardea 75:133-142.
DeSante, David F. and Danielle R. Kaschube. 2009. The Monitoring of Avian Productivity and Survivorship (MAPS) Program, 2004, 2005, and 2006 Report. The Institute for Bird Populations, Point Reyes Station, California.
DeSante, David F. and M. Philip Nott. 2000. An overview of the North American Monitoring Avian Productivity and Survivorship (MAPS) Program. The Institute for Bird Populations. Point Reyes Station, California.
Lebreton, J.-D., Burnham, K.P., Clobert, J. and Anderson, D.R. 1992. Modeling survival and testing biological hypotheses using marked animals: a unified approach with case studies. Ecol. Monogr. 62:67-118.
Peach, W.J., Buckland, S.T. and Baillie, S.R. 1996. The use of constant mist-netting to measure between-year changes in the abundance and productivity of common passerines. Bird Study 43:142-156.
Pollock, K.H., Nichols, J.D., Brownie, C. and Hines, J.E. 1990. Statistical inference for capture-recapture experiments. Wildlife Monographs, No. 107.
Prepared by Jean Palumbo, Southern Colorado Plateau Network Inventory & Monitoring Program, 2017.
