Part of a series of articles titled National Park Service Alaska Region Fire Ecology Annual Report Calendar Year 2016.
Article
Fire Ecology Annual Report 2016 - Monitoring and Inventory
During 2016 the NPS Alaska fire ecology program re-measured mechanical fuels reduction plots in Wrangell-St. Elias in McCarthy and established permanent fire effects monitoring plots in Denali to measure the impacts of shortened fire return intervals. Brief descriptions and preliminary results from the two monitoring projects are provided below.
| Park | Monitoring Unit | Type of Plot (FMH, photo point, other) | Pre-burn/TX 2016 | 1yr Post 2016 | Post (2-20yrs) 2016 | Annual Total | Total Plots |
|---|---|---|---|---|---|---|---|
| Lake Clark | Currant Cr Fire 2013 | CBI, AKR Fire &Fuels Plots | 43 | ||||
| Lake Clark | Kristin Cr Fire 2013 | CBI & Cover | 7 | ||||
| Wrangell-St. Elias | Carl Cr RX | AKR Carl Cr Plots | 29 | ||||
| Wrangell-St. Elias | Chakina Fire 2009 | CBI & Cover | 56 | ||||
| Wrangell-St. Elias | Chakina Fire 2009 | AKR Fire and Fuels Plots | 9 | ||||
| Wrangell-St. Elias | Susan Smith - Hazard Fules Plots - TX | AKR SS Hazard Fuels Plots | 13 | ||||
| Wrangell-St. Elias | Headquarters - TX | AKR Hazard Fuels Plots | 19 | ||||
| Wrangell-St. Elias | Fire Effects - Paired Plots | AKR Paired Plots | 2 | ||||
| Wrangell-St. Elias | McCarthy University Subdivision - TX | AKR Hazard Fuels Plots | 27 | 27 | 27 | ||
| Yukon-Charley Rivers | 2004 Woodchopper Fire | AKR Fire & Fuels Plots | 7 | ||||
| Yukon-Charley Rivers | 1999 Witch Fire | Fire effects - other | 15 | ||||
| Yukon-Charley Rivers | 2004 Fire - Paired Plots | AKR Paired Plots | 5 | ||||
| Yukon-Charley Rivers | 1999 Fires Landcover - CBI | AKR Fire & Fuels Plots | 30 | ||||
| Denali | Headquarters - TX | AKR Hazard Fuels Plots | 27 | ||||
| Denali | VDM Highpower fire reburns | AKR Fire &Fuels Plots | 10 | ||||
| Denali | Landcover - CBI | AKR Fire & Fuels Plots | 11 | 11 | 55 | ||
| Denali | BeaverLog Fire 2013 | CBI & Cover | 13 | ||||
| Denali | Toklat R. East Fire 2013 | CBI & Cover | 25 | ||||
| Noatak | 2010 Fires | CBI & Cover | 34 | ||||
| Noatak | 2004 Uvgoon Fire | AKR Fire & Fuels Plots | 6 | ||||
| Noatak | 2012 Uvgoon/Kungiakrok Fires | CBI & Cover | 22 | ||||
| Noatak | 1977 Fires Racine Plots | Racine Plots | 8 | ||||
| Bering Land Bridge | 1977 Fire Racine Plots | Racine Plots | 8 | ||||
| Bering Land Bridge | Fairhaven Ditch Cabins - TX | AKR Hazard Fuels Plots | 4 | ||||
| Total | 38 | 38 | 474 |
Wrangell-St. Elias McCarthy University Subdivision Fuels Reduction Monitoring
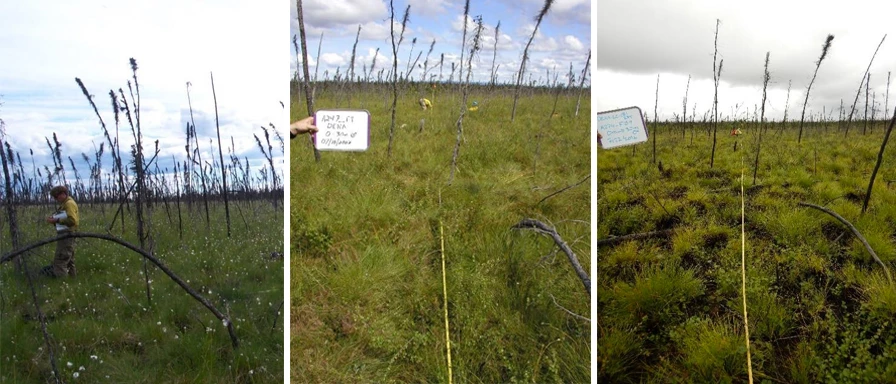
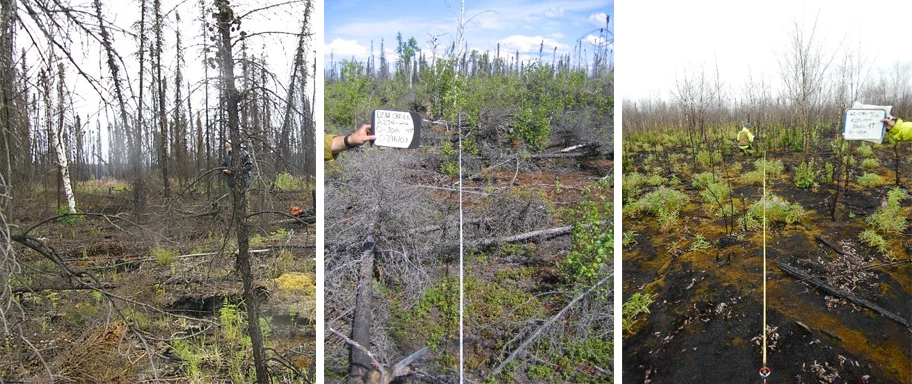
The rural community of McCarthy is located in a natural setting of boreal forest in south central Alaska within the boundaries of Wrangell-St. Elias National Park and Preserve (WRST). In 2011 a 36 acre fuels treatment project was conducted adjacent to the remote community of McCarthy, Alaska. The McCarthy University Subdivision Hazard Fuels Reduction project was designed to aid in the protection of human infrastructure and human lives in the event of a wildland fire near the community of McCarthy. The primary purpose of this fuels reduction project was to create a buffer zone, or shaded fuel break, between NPS land and private property in the University Subdivision area. The area was a mix of closed to open black spruce (Fig. 3), open mixed white and black spruce (Fig. 4) and open deciduous forests of aspen or balsam poplar forests. There was an abundance of old fire history evidence on the ground (burned logs and stumps) at the site, indicating the area burned in the past and had a good potential to burn again.The specific fuels reduction project objectives were as follows:
- 6' Bole spacing between needleleaf trees- needleleaf trees will be mechanically thinned; needleleaf tree bole spacing will be 6 feet between tree boles.
- Needleleaf tree limbing to ≥ 5 feet- needleleaf trees will be mechanically limbed; live and dead ladder fuels lower than 5 feet up the tree bole from the ground surface will removed.
- Large woody debris removed- 100hr and 1000hr fuels will be removed by hand; 80% of 100hr and 1000hr fuels will be removed.
- Tall shrub density reduction- dead and decadent shrubs will be mechanically thinned; 80% of shrubs greater than 50% dead will be removed.
- Deciduous trees retained- live deciduous trees will not be removed.
Photos in Fig. 3 show McCarthy fuels treatment monitoring plot (MUS-03) are shown from left to right; pre-treatment (2011), 1 year post treatment (2012) and 5 years post treatment (2016).
Photos in Fig. 4 show the monitoring plot (MUS-14) from left to right; pre-treatment (2011), 1 year post treatment (2012) and 5 years post treatment (2016).

NPS photo.

NPS photo.

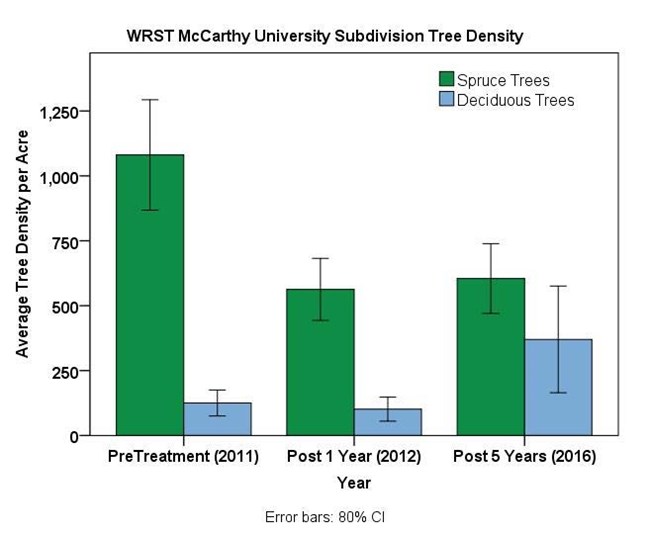
Some deciduous trees (aspen and balsam poplars) were cut during the treatment, which resulted in a slight reduction in deciduous tree densities at the plots one year after the treatment (Fig. 5). The cut trees caused the aspen and balsam poplars to sucker or re-sprout and were observed 1 year post treatment, but they were not tall enough to tally as trees (>4.5 feet tall). By 5 years post treatment the aspen and poplar suckers were tall enough to be tallied as trees in many of the plots. Five years after the treatment the density of deciduous trees increased from an average of 156 trees/acre (80% CI 93-214) pre-treatment to 377 trees/acre (80% CI 179-575) five years after the treatment (Fig. 5). In general aspen and balsam poplar are less flammable than spruce, so this change will likely contribute to creating a better fuel break.
The fuels treatment significantly improved the ladder fuel heights at the site. Prior to treatment the average height from the ground to the lowest dead branches on spruce trees was less than 1 inch (1.5 cm) above the ground (Fig. 6, Table 3). In 2016 the average height to the lowest dead branches on spruce trees was 3.4 feet (104 cm) and the lowest live branches average was 4.6 feet (139 cm) (Fig. 6). Neither of these heights achieved the objective of the 5 foot limbing height prescription, but the increased crown base height still reduces the potential for surface fires to move into the canopy.
However, the cutting of the decadent willows has resulted in vigorous re-sprouts from the cut willow. The number of live willow shrubs has increased from 960 shrubs/acre (80% CI 785-1135) pre-treatment to 1728 shrubs/acre (80% CI 1434-2021) 5 years after the treatment. Further discussions and assessment of whether the increased shrub density will impact fire potential or impede access to the fuels treatment during the event of fire will take place this spring.


| Monitoring Unit | Management Objective | Monitoring Results (80% Confidence Interval) | Objective Achieved? | Year Last Analysis Completed & Years included in analysis |
|---|---|---|---|---|
| WRST McCarthy University Subdivision Fuels Treatment | Reduce spruce tree density to 6 foot bole spacing in spruce (1210 spruce/acre) (+/- 80% confidence interval). Note 6 foot crown spacing in spruce is approx. 436 trees/acre. | Spruce Tree Density (n=26 plots) Pre-treatment (n=26 plots): 1081 (868-1293) trees/acre 1 yr Post-treatment (n=26 plots): 563 (443-682) trees/acre 5 yrs Post-treatment (n=26 plots): 605 (470-739) trees/acre |
Yes, but exceeded bole spacing | 2016 (2011 - 2016) |
| WRST McCarthy University Subdivision Fuels Treatment | Limb spruce to 5 ft (152 cm) | Dead Ladder Fuel height Pre-treatment (n=181 trees): 1.48 cm (0.98 – 1.97 cm) 1 yr Post-treatment (n=158 trees): 78.4 cm (70.9 – 85.9 cm) 5 yrs Post-treatment (n=160 trees): 103.9 cm (97.4 - 110.5 cm) |
No, average was 3.4 ft | 2016 (2011 - 2016) |
| WRST McCarthy University Subdivision Fuels Treatment | 80% of tall shrubs that are greater than 50% dead will be removed | Dead/Decadent Shrub Density Pre-treatment (n=27 plots): 745 (608-883) shrubs/acre 1 yr Post-treatment (n=26 plots): 105 (56-154) shrubs/acre 5 yrs Post-treatment (n=27 plots): 98 (67-130) shrubs/acre Percent removed: 86.8% |
Yes | 2016 (2011 - 2016) |
Denali Shortened Fire Return Interval Monitoring
In managing fires, recently burned areas are often used as natural fuel breaks by fire managers in Alaska, yet the reliability of this assumption seems to be changing with changing climate. In 2015 and 2016 some fires in the Alaska parks burned into recently burned area, leading to the question of the longevity and effectiveness of recently burned areas providing effective fire breaks or fire slowing conditions. In addition, little monitoring has occurred to understand and reasonably predict vegetation successional pathways due to fire burning a vegetated stands on multiple occasions (repeat fire events) with various levels of burn severity. In 2016, AKR NPS Regional Fire Ecology program partnered with USGS, FWS, BLM Alaska Fire Service, and the State of Alaska, DNR DOF in a preliminary study to assess the: 1) extent and trends in repeat fire (reburn) in Alaska; 2) characteristics that allow older fires to act as fuel breaks for new wildfires; 3) evaluate what climatic, weather and fuels conditions do fires reburn recently burned areas; and 4) evaluate the impacts of shortened fire return intervals and reburns have on vegetation succession and composition.The 2015 Carlson Lake fire in Denali burned into the 2000 Foraker fire (and other fires) and burned 8 plots that had been established after the 2000 fire. In 2016, the team re-measured 7 of the 8 plots that burned both in 2015 and 2000 and re-measured 4 plots that were only burned in the 2000 fire.
Monitoring goals for the fire monitoring plots included:
- Document vascular and non-vascular plant cover changes
- Document changes in active layer depths
- Monitor tree seedling establishment
- Document changes in tree densities by diameter size class
Preliminary analysis indicates that even with a second burn, seedling spruce survived or regenerated after the second fire. The average density of black spruce seedlings at the twice burned lowland spruce sites was 8,318 spruce seedlings/acre, while the once burned sites had an average of 6,407 spruce seedlings/acre. The data was variable with the small sample size. Additional analyses will be completed on these plots and other sites that have been monitored in the past. The work will continue next year in Wrangell-St. Elias, where the 2016 Steamboat Creek fire burned within the 2009 Chakina fire.
| Vegetation | n | Forb/herb | Graminoid | Sedge | Shrub | Subshrub | Trees |
|---|---|---|---|---|---|---|---|
| Mesic Spruce - PostBurn Year 1x2 Fires | 3 | 23.9 | 1.7 | 3.3 | 607 | 0.0 | 3.9 |
| Mesic Spruce - PostBurn Year 7 | 3 | 3.9 | 0.0 | 2.8 | 14.4 | 10.0 | 10.0 |
| Woodland Black Spruce - PostBurn Year 1x2 Fires | 3 | 0.6 | 0.6 | 48.9 | 32.8 | 33.9 | 2.2 |
| Woodland Black Spruce - PostBurn Year 7 | 7 | 0.0 | 0.0 | 70.2 | 58.6 | 36.4 | 1.0 |
| Woodland Black Spruce - PostBurn Year 16 | 4 | 0.0 | 0.0 | 56.3 | 61.7 | 44.6 | 0.0 |


Data Management
Data for all recent monitoring projects have been entered into FFI (FEAT/FIREMON Integrated) - a plot-level monitoring sequel server software tool designed to assist managers with collection, storage and analysis of ecological information (http://www.frames.gov/partner-sites/ffi/ffi-home/). Digital archives and metadata for the AK databases were uploaded to the NPS Data Store IRMA in Feb 2017. The Alaska Eastern Area fire ecology data set is located here and includes data for YUCH and WRST: https://irma.nps.gov/DataStore/Reference/Profile/2238367 and the Alaska Western Area fire ecology data set includes data for DENA, NOAT, BELA, and LACL: https://irma.nps.gov/DataStore/Reference/Profile/2238363. The updated FFI databases reflect the recent data additions and QC to the AK NPS fire ecology databases (Table 5).
| Park/Project | % 2016 Data Entered | % 2016 Data Quality Checked | # Prescribed Fires Monitored | # Wildfires Monitored | # BAER Treatments Monitored | |
|---|---|---|---|---|---|---|
| Denali CBI and Landcover - Repeat Fire Plots | 100% | 100% | 0 | 0 | 1 | 0 |
| Wrangell-St. Elias McCarthy University Subdivision Fuels Project | 100% | 100% | 0 | 1 | 0 | 0 |
Last updated: January 10, 2018
