Importance

NPS
Phenology refers to the timing of annual biological events, such as migration, nesting, and the greening up and flowering of plants. Phenology is affected by environmental factors, especially climate. For example, early warming temperatures can cause plants to flower earlier, which could affect migrating birds. Changes in the timing of natural events can have profound effects on organisms and ecological processes, making phenology an indicator of ecosystem responses to climate change.
Land surface phenology describes vegetation change that can be observed through satellite remote sensing. It can reveal landscape-scale climate/vegetation interactions and associated ecosystem changes. The extent and duration of snow cover is tied to the same seasonal cycles that drive change in vegetation phenology and affect other ecosystem processes, such as the quantity and timing of soil moisture recharge, runoff, and stream flow. Changes in snow depth and duration at higher elevations may lead to significant shifts in the timing and amount of runoff, which may also influence growing season dynamics and net primary productivity in the region (Lundquist and Roche 2009, Pederson et al. 2011).
Broad scale patterns in vegetation type and condition reflect recent and past climates and their interactions with geologic substrate, slope, aspect, elevation, and disturbance agents. The climate of the Colorado Plateau is characterized by erratic moisture availability, warm to hot growing seasons, and winters with sustained periods of freezing temperatures. Annual precipitation is bimodally distributed between the winter months and the summer monsoon.
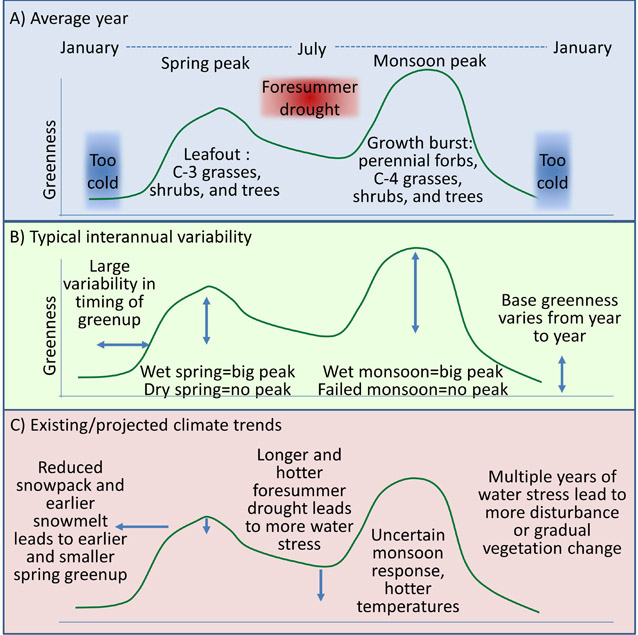
On the Colorado Plateau, climate change is predicted to bring higher temperatures, decreased precipitation, earlier and reduced snowmelt which will result in longer fore-summer droughts, and a longer growing season (Figure 1). The results are likely to include heat waves, increased drought and water stress, insect outbreaks, and a greater number of large, severe wildfires. (BLM 2014, Lenart 2007, International Panel on Climate Change 2014).

Long-term Monitoring
The Northern Colorado Plateau Network and Southern Colorado Plateau Network have chosen to monitor land surface phenology using vegetation greenness and snow cover as vital signs of ecosystem health because 1) both can be measured over broad areas using freely available, carefully processed satellite data, 2) vegetation forms the structural foundation and primary productivity of most terrestrial ecosystems, and 3) in the arid and semi-arid southwestern United States, snow cover provides useful information about early season water limitations.
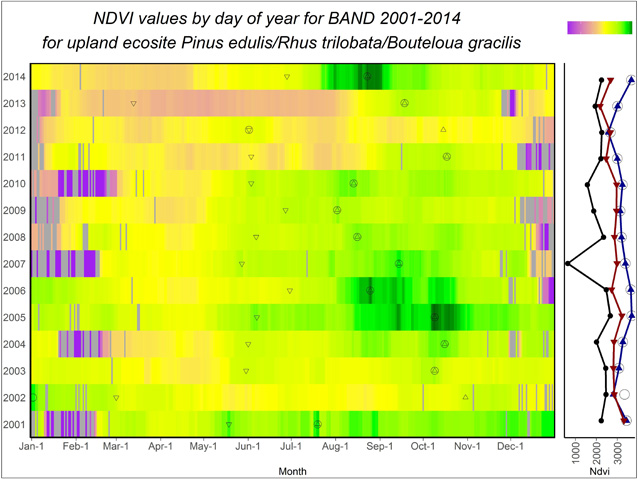
Satellites measure “greenness” using Normalized Difference Vegetation Index (NDVI), NDVI is calculated from the near infrared and red wavelengths and is one of the most commonly used vegetation indices. (Figure 2).

What can we learn from phenological patterns?
Figure 2 shows greenness patterns inferred from smoothed satellite NDVI data over a period of 15 years. On the Colorado plateau we typically identify two possible peaks of greeness—a spring peak and a late summer peak associated with the monsoon. We can use the phenology data in Figure 2 to answer questions such as:
- How variable is the peak greenness from year to year?
- What years had the highest peak greenness?
- What years had the lowest peak greenness?
- When is the growing season, and how consistent is it from year to year?
- Is the timing of spring or monsoon peak greenness changing through time?
As a part of studying this we would like to tie these patterns of greenness to the forces that drive them, like patterns of temperature and precipitation. As another part of studying phenology, we hope that scientists can learn how these patterns of greenness affect ecosystems, for example, the timing of migratory bird arrivals, nesting bird success rates, abundance of herbivores, such as deer and elk, and of seasonal pollinators like hummingbirds, bees, and bats.
SCPN’s objectives for land surface phenology monitoring are
- to determine annual status, interannual variability, and long-term trends in growing season NDVI (start and end of season dates; duration of growing season; maximum NDVI) within select ecosystems
- determine annual status, interannual variability, and long-term trends in the timing and duration of snow cover (establishment of snowpack, persistence, time and rate of melt) within select ecosystems.
Land surface phenology is being monitored in most SCPN parks.
Management Applications
Monitoring landscape processes, such as snow cover and land surface phenology, provides information on observed changes, as well as support for ecological forecasts that alert park managers to future issues of management concern, such as the potential for ecological invasions, or wildland fires (Schlaepfer et al., 2012). Tracking land surface phenology trends also provides a broader context for understanding other vital signs, such as vegetation dynamics observed in plot-based monitoring of the same ecosystems.
The consequences of changes in moisture availability driven by climate change may be severe in the semiarid western United States, as evidenced by recent drought (Rosenberg and Edmonds, 2005, Williams et al., 2010, Gonzalez et al., 2010; Bowers, 2005). Changes in climate may result in vegetation biome shifts or the development of non-analog communities, as species respond individually to form novel ecosystems (Williams and Jackson, 2007; Williams et al., 2012). Monitoring the variability and trends in the timing and intensity of vegetation phenology may provide early indicators of climate trends that represent increased stress or vulnerability for plants, or may be a sign of gradual or sudden vegetation community shifts. Phenological monitoring also provides a means of understanding the stressors at work by revealing how timing affects overall seasonal productivity at the landscape scale.
Literature Cited
Bowers, J. E. 2005. Effects of Drought on Shrub Survival and Longevity in the Northern Sonoran Desert. Journal of the Torrey Botanical Society 132(3):421-431.
Bureau of Land Management. 2014. Climate on the Colorado Plateau. Accessed on 5 October 2016 at http://www.blm.gov/ut/st/en/prog/more/CPNPP/Historic_Climate_Conditions.html.
Gonzalez, P., R. P. Neilson, J. M. Lenihan and R. J. Drapek. 2010. Global patterns in the vulnerability of ecosystems to vegetation shifts due to climate change. Global Ecology and Biogeography 19(6):755-768.
International Panel on Climate Change (IPCC). 2014. Climate Change 2014: Impacts, Adaptation, and Vulnerability. Part B: Regional Aspects. Contribution of Working Group II to the Fifth Assessment Report of the Intergovernmental Panel on Climate Change [Barros, V.R., C.B. Field, D.J. Dokken, M.D. Mastrandrea, K.J. Mach, T.E. Bilir, M. Chatterjee, K.L. Ebi, Y.O. Estrada, R.C. Genova, B. Girma, E.S. Kissel, A.N. Levy, S. MacCracken, P.R. Mastrandrea, and L.L. White (eds.)]. Cambridge University Press, Cambridge, United Kingdom and New York, NY, USA.
Lenart, Melanie. 2007. Global Warming in the Southwest: Projections, Observations and Impacts. CLIMAS, University of Arizona. Tucson, Arizona.
Lundquist, J. and J. Roche. 2009. Climate change and water supply in western national parks. Park Science 26.
Pederson, G., S. Gray, C. A. Woodhouse, J. L. Betancourt, D. B. Fagre, J. S. Littell, E. Watson, B. H. Luckman and L. J. Graumlich. 2011. The unusual nature of recent snowpack declines in the North American Cordillera. Science 333(6040):332-335.
Rosenberg, N. J. and J. A. Edmonds editors. 2005. Climate change impacts for the conterminous USA: an integrated assessment. Springer Netherlands.
Schlaepfer, D. R., W. K. Lauenroth and J. B. Bradford. 2012. Ecohydrological niche of sagebrush ecosystems. Ecohydrology 5(4):453-466.
Williams, P. A., C. D. Allen, A. K. Macalady, D. Griffin, C. A. Woodhouse, D. M. Meko, T. W. Swetnam, S. A. Rauscher, R. Seager, H. Grissino-Mayer, J. S. Dean, E. R. Cook, C. Gangodagamage, M. Cai and N. G. McDowell. 2012. Temperature as a potent driver of regional forest drought stress and tree mortality. Nature Climate Change 3:292-297.
Williams, A. P., C. D. Allen, C. I. Millar, T. W. Swetnam, J. Michaelsen, C. J. Still and S. W. Leavitt. 2010. Forest responses to increasing aridity and warmth in the southwestern United States. Proceedings of the National Academy of Sciences.
Williams, J. W. and S. T. Jackson. 2007. Novel climates, no-analog communities, and ecological surprises. Frontiers in Ecology & the Environment 5(9):475-482.
Prepared by Jean Palumbo and Jodi Norris, Southern Colorado Plateau Network Inventory and Monitoring Program, 2016.
Last updated: September 19, 2019
