Last updated: September 29, 2021
Article
Jordan Pond Dips into Big Data

Flickr/Brent Danley
Oh buoy: that’s a lot of data.
Since 2013, the continuous monitoring buoy has been compiling a massive dataset that is providing a host of insights into the health of Jordan Pond. Over 30 parameters are measured every 15 minutes, totaling about 16,000 sampling events throughout a monitoring season. Compare this to the mere six in-person sampling events during the pre-buoy days, and it is obvious how much clearer of a water quality health picture this buoy can paint.Currently, trends in the changing water clarity and dissolved organic matter (DOM) of the pond are of particular interest. Acadia National Park has a dataset going back to 1980 for Jordan Pond that reveals from 1995 to 2010 water clarity was declining and DOM was increasing. It is important to note that a decrease in water clarity is not necessarily a bad thing, and could actually be a sign of increasing pond health. Prior to the Clean Air Act Amendments of 1990, the pond and surrounding soils were receiving significant amounts of acidic deposition (primarily from acid rain) that altered the water’s very chemical make-up. Water that is too acidic may look “clean”, but that is only because it can support very little plant life and is actually a sign of a malfunctioning ecosystem. Water that is a little less clear could be a sign of a return to pre-acidification conditions, as surrounding soils can now more easily give up DOM which gets washed into the lake.
When it rains, it pours
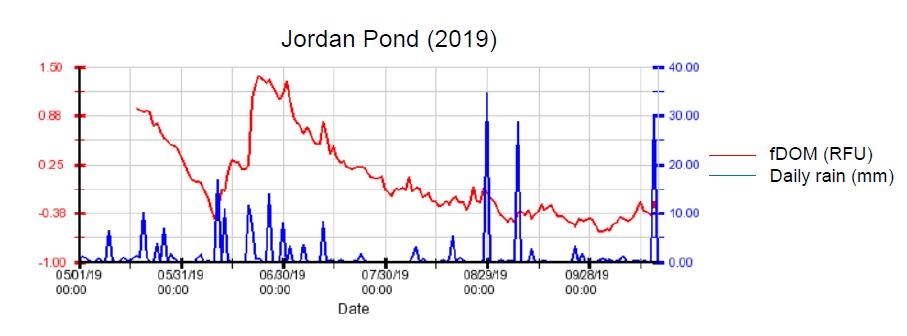
Trends associated with climate change may also be impacting Jordan Pond’s water quality. Since 2010, water clarity has been more variable than previous years which can in large part be attributed to the northeast now experiencing more frequent and severe heavy precipitation events than in previous decades.The monitoring team has the ability to compare buoy data with that of a nearby weather station, which records precipitation, air temperature, wind conditions, and other related parameters. Back in the once-a-month sampling days, it was nearly impossible to tell how large storms affected water quality in Jordan Pond. Now the buoy records water quality data before, during, and after storms allowing for precise comparisons.
As NETN’s water quality lead Bill Gawley notes, the buoy clearly shows “the relationship between weather events and water quality values, like the increase in dissolved organic carbon (DOC) after precipitation events. The interesting thing is how the response seems to decrease over the course of the season, suggesting that the DOC gets ‘washed out’ of the watershed over time, and since we see this pattern annually, we know the DOC re-accumulates over the winter.”

