Last updated: January 12, 2023
Article
Increasing temperature seasonality may overwhelm shifts in soil moisture to favor shrub over grass dominance in Colorado Plateau drylands

NPS
Shifting balance of grasses and shrubs can have major impacts in natural areas
Scientists predict that drought and rising temperature will continue to affect dryland ecosystems in the southwestern United States. Dryland ecosystems cover large areas, support both human and wildlife populations, and sequester 25% of the carbon in Earth’s soils. Climate change can shift the balance between grass and shrub abundance in dryland systems. This can negatively affect the survival of plants and animals, ecosystem processes, and an ecosystem’s ability to adapt to future climate change.
Factors that contribute to shifts in the balance of grasses and shrubs
To anticipate the effects of climate change, land managers must understand what drives the balance between grass and shrub abundance in dryland systems. But climate, land use, and disturbance, all interact to affect vegetation dynamics. In addition, plants get moisture from the soil, and soil moisture can vary in response to the texture and depth of the soil, even where climate is consistent. These interactions complicate efforts to quantify the effects of climate and other variables on the balance of grass and shrubs, which we also refer to as “relative abundance” in this brief.
Studying present and future conditions in dryland ecosystems
Scientists from the US Geological Survey’s Southwest Biological Science Center and the National Park Service’s Southern Colorado Plateau Network (SCPN) worked together to understand what is driving changes in dryland ecosystems. They wanted to know: 1) what are the soil moisture and climate conditions that support current patterns of relative abundance of grass and shrubs in different dryland ecosystems, and 2) how will shifts in climate and soil water conditions, caused by climate change, influence the future balance between grass and shrubs?
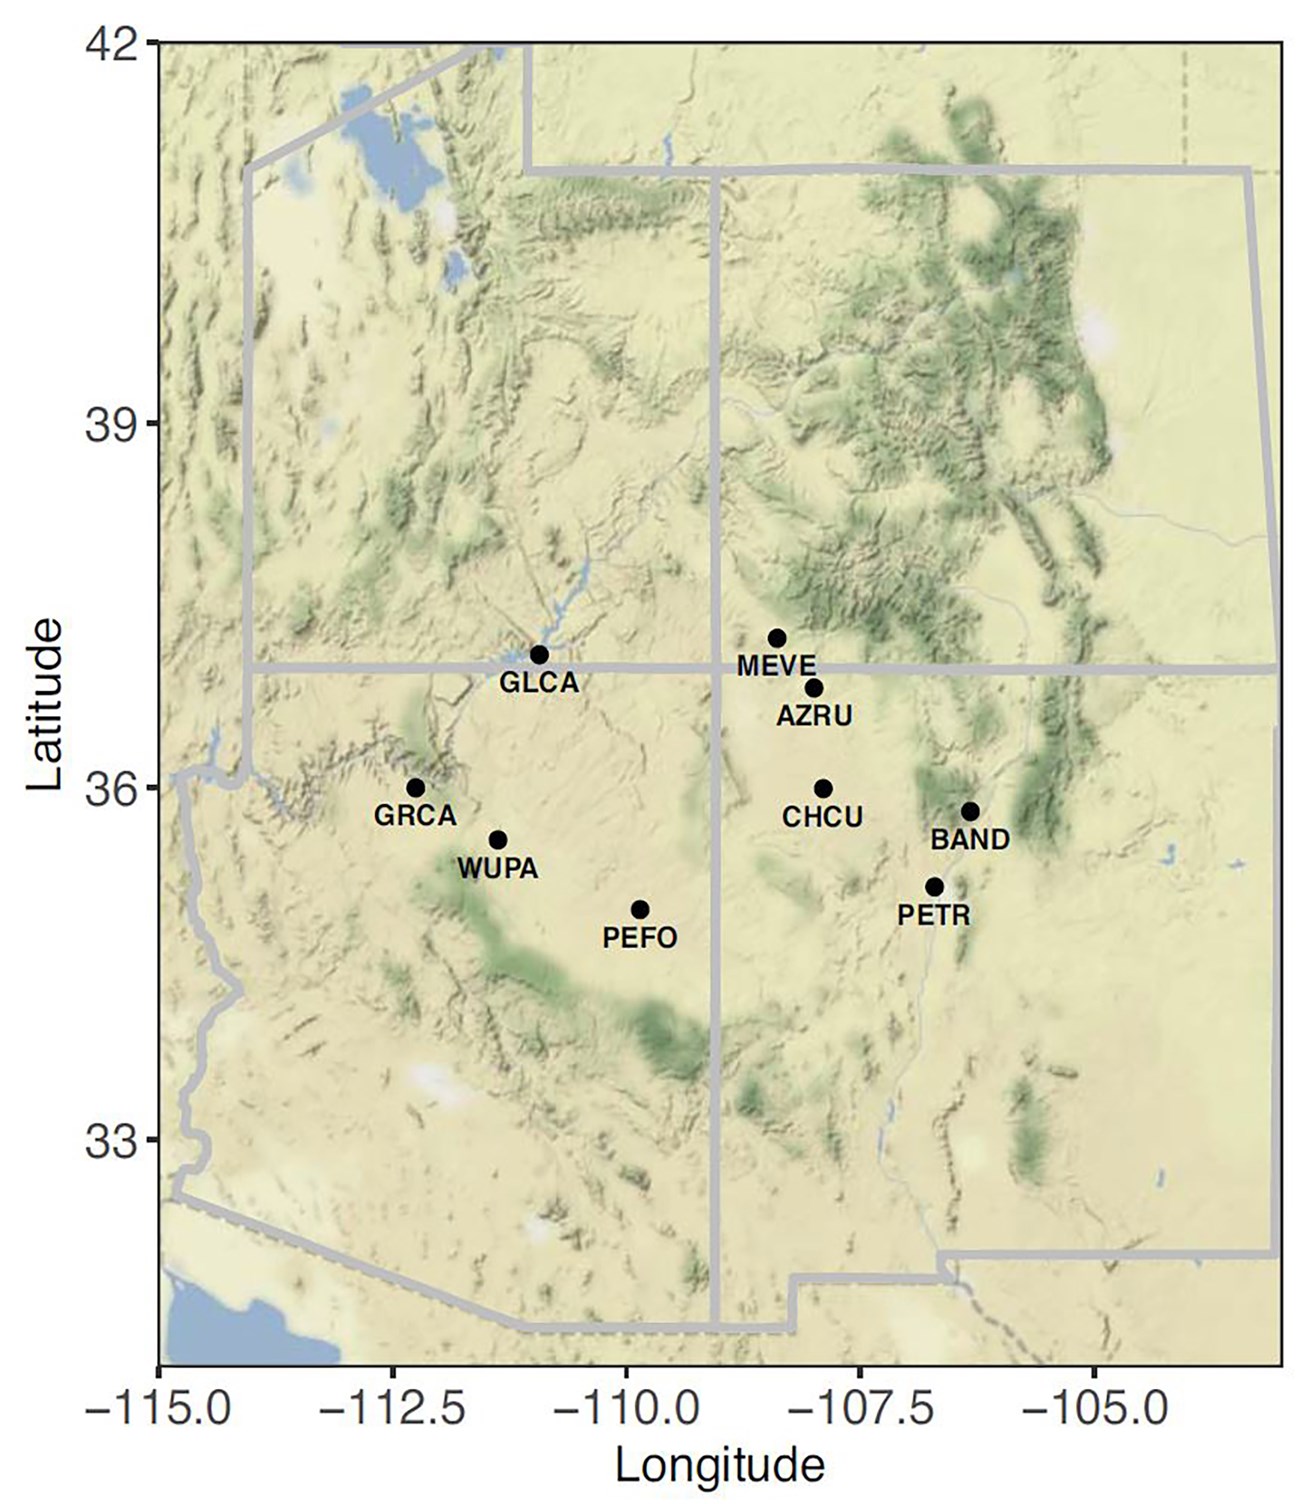
Their study focused on thirteen ecosystems in nine SCPN parks (Figure 1, Table 1). The monitoring plots in these ecosystems have generally been protected from human-caused disturbance, such as grazing or roads, except in Glen Canyon NRA, where grazing is permitted. This allowed researchers to focus on separating out the role of climate from the role of soil moisture in affecting the balance of grass and shrubs. The plots represented a range of upland ecosystem types with varying monthly temperature and precipitation patterns.
| U.S. NPS unit | Abbreviation | Dominant vegetation |
|---|---|---|
| Aztec Ruins NM | AZRU | Shrubland, grassland |
| Bandelier NM | BAND | Woodland |
| Chaco Culture NHP | CHCU_S | Grassland |
| Glen Canyon NRA | GLCA_B | Shrubland |
| Glen Canyon NRA | GLCA_H | Shrubland |
| Grand Canyon NP | GRCA_P | Woodland |
| Mesa Verde NP | MEVE_L | Woodland |
| Mesa Verde NP | MEVE_S | Woodland |
| Petrified Forest NP | PEFO_C | Grassland |
| Petrified Forest NP | PEFO_P | Grassland |
| Petroglyph NM | PETR_P | Grassland |
| Wupatki NM | WUPA_L | Grassland |
| Wupatki NM | WUPA_S | Shrubland |

NPS
Relationships between soil moisture and the balance of grass and shrubs
To determine the current conditions in these ecosystems, scientists calculated the percentage of grasses versus shrubs in the plots, based on upland vegetation and soils monitoring data collected by the SCPN. They used the SOILWAT model, which simulates how water flows in and out of an ecosystem, in their analysis. They plugged in weather data (precipitation, temperature) and the percent grass and shrub composition, and soil texture and depth for each plot. The model derives “soil water potential”, a measure of how much water in the soil is available for plants to use (not just how much water is in the soil). This metric was used to represent the amount of moisture in the soil available to plants for each plot, which accounts for differences in soil texture.
From the model results, scientists determined the time of year and the depth of soil that best correlated with 1) a higher percentage of grass in a plot, and 2) a higher percentage of shrubs in a plot. A higher percentage of shrubs versus grass was most strongly correlated to high soil moisture at depths of 130 cm in February, whereas a higher percentage of grass was most correlated to high soil moisture at a depth of 10 cm in July.
Which factors have the most influence on the balance of grass and shrubs?
To predict the effects of climate change, scientists used the current relationships between soil moisture and relative abundance of grass and shrubs, together with monthly predictions of historical and future climate conditions based on general circulation models (GCMs). GCMs attempt to represent the climate system by calculating properties of Earth’s atmosphere, like solar radiation, earth radiation, aerosols, and wind.
They conducted the following simulations:
-
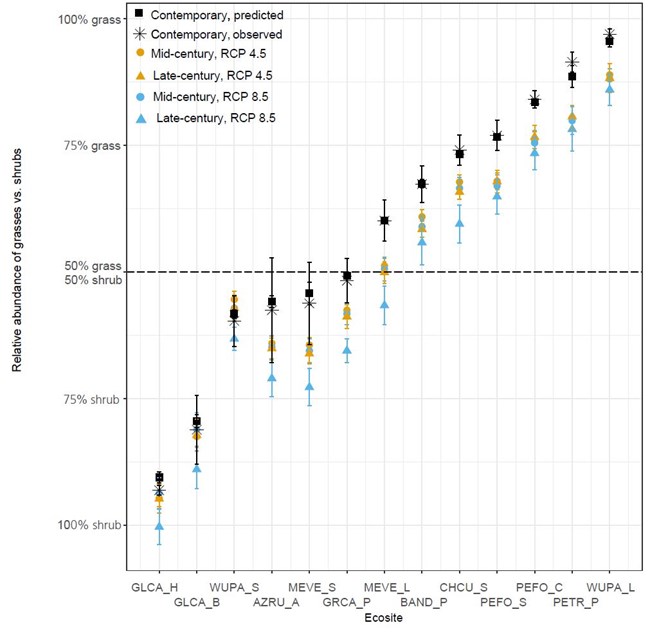
They modeled the current relative abundance of grasses and shrubs in the plots in the nine SCPN parks using a variety of climate and soil moisture variables. They compared these predictions of current abundance to the actual relative abundance derived from the SCPN monitoring data (Figure 2). This helps them test the model to see how well it performs.
- Because the model did a good job of predicting current conditions, they then applied it to see how climate change would affect the relative abundance of grass and shrubs in the plots. Since the amount of climate change predicted for the future is tied to the increase of carbon emissions, they ran the model under two scenarios: 1) a high-carbon emission scenario, representing a future in which climate change had not been addressed and 2) a reduced carbon emissions scenario, representing a future where climate change was being addressed. They analyzed the effects of climate change on the balance between grass and shrubs under both of these scenarios for two future periods—mid-century (2020-2059) and late century (2060-2099).
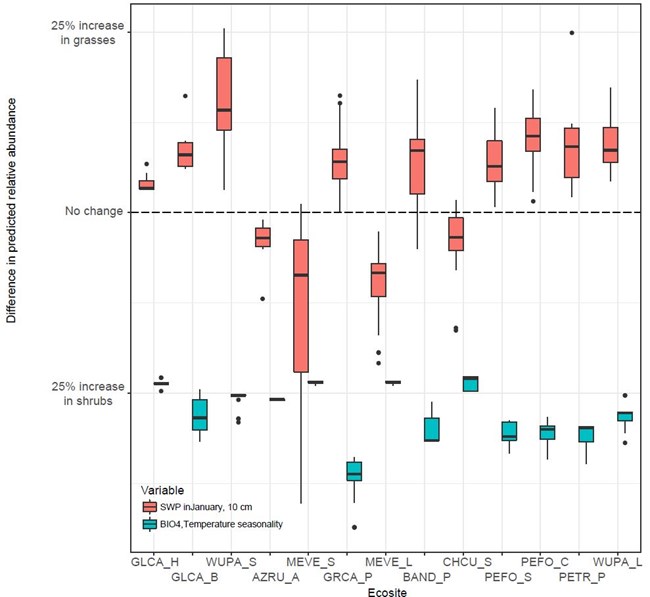
- Two variables used in the model had opposing effects—winter soil moisture and average temperature seasonality (how much temperature typically varies in a year). Scientists wanted to understand what the effect was from each of these variables separately, so in another set of simulations, they kept soil water potential at the current, observed levels, but used the predicted temperature variability under climate change. Similarly, to examine the effects of only soil moisture on relative abundance, they kept temperature variability at the current level and used the projected soil water potential under climate change.
Results: Greater extremes of temperature supported shifts to shrub dominance
The results of this study show that temperature seasonality and seasonal soil moisture are important to the balance of grass and shrubs in dryland ecosystems. Further, the more extreme warming under the higher carbon emissions scenario was associated with a greater shift in the relative abundance of grass and shrubs (Figure 2). When the effects of soil moisture and temperature were separated out, higher variability in temperature throughout the year (higher temperature seasonality) proved to have more of an effect on the relative abundance of grass and shrubs than soil moisture. Greater temperature extremes supported greater shrub dominance (Figure 3). In some parks, the predicted shift in balance between grasses and shrubs was small or within the predicted error of the model. However, results for most parks showed a predicted shift in relative abundance of 15-25% towards a greater proportion of shrubs (Figure 2).

Gremer et al. 2018
In Figure 2 (right click on the image to open in a new tab or window), observed relative abundance of grasses vs. shrubs (black asterisks) is compared with the relative abundance for the present as predicted by the model (black squares). Predicted relative abundance for the mid-century and late-century time frames under different climate change scenarios are also shown. RCP 4.5 represents the low carbon emission scenario where climate change is being addressed, and RCP 8.5 represents the high carbon scenario, in which climate change is not being addressed. Error bars represent one standard error of the mean for observed and predicted relative abundance. This figure shows that nearly every park ecosystem examined is expected to shift to greater shrub dominance, and that larger increases in greenhouse gas levels are predicted to lead to greater change than smaller increases in greenhouse gas levels.
These results differed from what we would have expected if we had only looked at a single ecosystem variable, like seasonal soil moisture. They remind us that ecosystems have complex relationships and that there is more to this story. For example, this work did not include interactions among plant species, or interactions with pollinators or predators, which may shift with changing conditions. Furthermore, the Colorado Plateau supports hundreds of species of mammals, birds, reptiles, and insects. How will wildlife respond to such fundamental shifts in their habitat? As we collect more data and improve modeling and other methods of analysis, we can use these tools to continue to learn about the effects of climate change on arid ecosystems. This information will continue to be important to park managers who want to understand the directions that park ecosystems may go under climate change, and what species are likely to be successful in the future.

Gremer et al. 2018
Figure 3 shows that changes in soil water potential often have an opposite impact (favoring grasses) to the impact of changing temperature seasonality (favoring shrubs). When including both impacts, the results generally favored greater shrub dominance (Figure 2).
Information presented in this project brief was summarized from Gremer et al. 2018. Increasing temperature seasonality may overwhelm shifts in soil moisture to favor shrub over grass dominance in Colorado Plateau Drylands. Oecologia. 188:1195–1207
Tags
- aztec ruins national monument
- bandelier national monument
- chaco culture national historical park
- glen canyon national recreation area
- grand canyon national park
- mesa verde national park
- petrified forest national park
- petroglyph national monument
- wupatki national monument
- climate change
- scpn
- soil moisture
- future climate
- grasslands
- shrublands
- research
- waterbalancecc
- jmrlc
- natural resources
